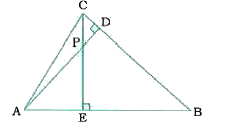
In the given figure, altitudes AD and CE of ΔABC intersect each other at the point P. Show that :
ΔABD~ΔCBE
 Solution in Gujrati
The correct Answer is:AA criterion, ΔABD~ΔCBE.
Step by step video, text & image solution for In the given figure, altitudes AD and CE of DeltaABC intersect each other at the point P. Show that : DeltaABD ~ DeltaCBE by Maths experts to help you in doubts & scoring excellent marks in Class 10 exams.
Updated on:21/07/2023Topper's Solved these Questions
- TRIANGLESBook:KUMAR PRAKASHANChapter:TRIANGLESExercise:EXERCISE 6.4
Explore 9 Videos
- TRIANGLESBook:KUMAR PRAKASHANChapter:TRIANGLESExercise:EXERCISE 6.5
Explore 23 Videos
- TRIANGLESBook:KUMAR PRAKASHANChapter:TRIANGLESExercise:EXERCISE 6.2
Explore 12 Videos
- SURFACE AREAS AND VOLUMESBook:KUMAR PRAKASHANChapter:SURFACE AREAS AND VOLUMESExercise:TEST YOUR SKILLS
Explore 5 Videos
Similar Questions
Let ΔABC~ΔDEF and their areas be, respectively, 64cm2 and 121cm2. If EF=15.4cm, find BC.
View SolutionSides of triangles are given below, Determine which of them are right triangles. In case of a right triangle, write the length of its hypotenuse :
7 cm, 24 cm, 25 cm
View SolutionIn the given figures 1 and 2, DE∣∣BC. Find the EC in 1 and AD in 2.

View SolutionThe slant height of a frustum of a cone is 4 m and the perimeter of circular ends are 18 m and 16 m. Find the cost of painting its curved surface at 10 per sq. m.
View SolutionHow many lines of symmetry does the above figure have ?
View SolutionDetermine the point of symmetry of a regular hexagon.
View SolutionDtermine the images of the following figure about the given line :
View SolutionMatch the following Column A to Column B

View SolutionMatch the following Column A to Column B

View SolutionMatch the following Column A to Column B

View SolutionFind the area of figure given below.

View SolutionFind the perimeter of the figure given below.

View SolutionFind the area of the figure given below.

View SolutionThe area of the shaded part in the figure given below is ______.

View SolutionThe inequation represented by the graph given below is :
View SolutionThe inequation that best describes the graph given below is _________
View Solution

