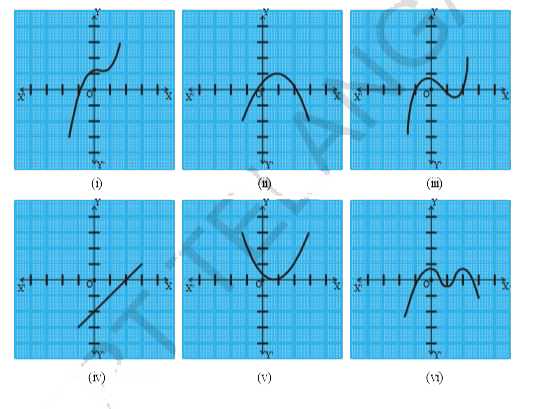
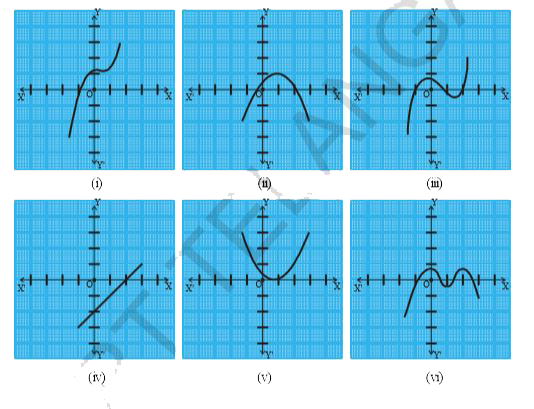
Look at the graphs in the figures given below. Each is the graph of y=p(x), where p(x) is a polynomial. For each of the graphs, find the number of zeroes of p(x).
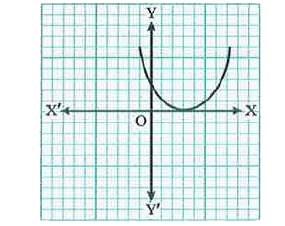 Solution in Gujrati
The correct Answer is:1
Step by step video, text & image solution for Look at the graphs in the figures given below. Each is the graph of y= p(x), where p(x) is a polynomial. For each of the graphs, find the number of zeroes of p(x). by Maths experts to help you in doubts & scoring excellent marks in Class 10 exams.
Topper's Solved these Questions
- BOOK - KUMAR PRAKASHANCHAPTER - POLYNOMIALSEXERCISE - OTHER IMPORTANT EXAMPLES5videos
POLYNOMIALS
- BOOK - KUMAR PRAKASHANCHAPTER - POLYNOMIALSEXERCISE - EXERCISE 2.16videos
POLYNOMIALS
- BOOK - KUMAR PRAKASHANCHAPTER - PAIR OF LINEAR EQUATIONS IN TWO VARIABLES EXERCISE - Test Your Skills48videos
PAIR OF LINEAR EQUATIONS IN TWO VARIABLES
- BOOK - KUMAR PRAKASHANCHAPTER - PROBABILITY EXERCISE - OBJECTIVE QUESTIONS (State whether each of the following statements is true or false:)5videos
PROBABILITY
Similar Questions
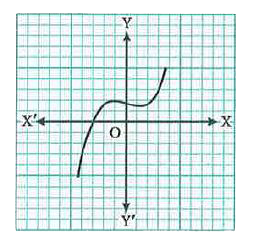
The graphs of y=p(x) are given in the figures below, for some polynomials p(x) :
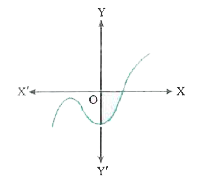
Find the number of zeroes of p(x) in each case .01:54View SolutionThe graphs of y=p(x) are given in the figures below, for some polynomials p(x). Find the number of zeroes of p(x), in each case.
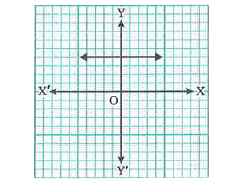 02:10View Solution
If the numerator of a fraction is decreased by 1. It reduces to 12 and if its numerator is increased by 1. it reduces to 1. Represent this situation algebraically and graphically.
02:17View SolutionFor any event A, P (A) is always greater than P(¯¯¯A).
02:10View SolutionLook at the graphs in Figure given below. Each is the graph of y=p(x), where p(x) is a polynomial. For each of the graphs, find the number of zeroes of p(x).
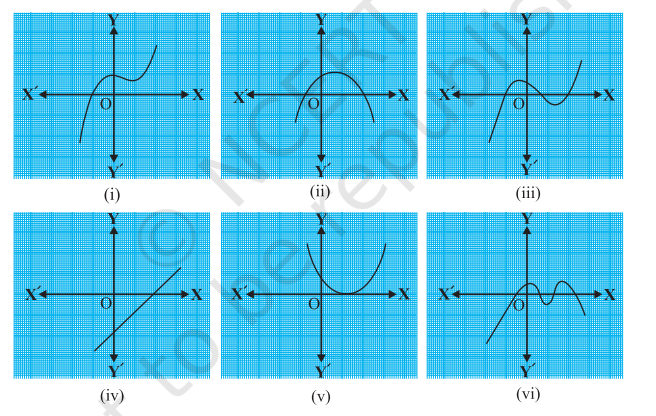 02:43View Solution
The inequation represented by the graph given below is :
02:16View SolutionThe inequation that best describes the graph given below is _________
04:05View SolutionThe inequation that best describes the following graph is _________
02:01View Solutionनीचे दी गई आकृति 2.9 में , ग्राफों को देखिए । प्रत्येक आकृति y=p(x) जहाँ p(x) एक बहुपद है , का ग्राफ है । ग्राफ है । ग्राफों से प्रत्येक के लिए p(x) के शून्यको की संख्या ज्ञात कीजिए ।
 04:49View Solution
Look at the graph in the figures given below. Each is the graph of y = p(x), where p(x) is a polynomial. In each of the graphs, find the number of zeroes of p(x) in the given range of x.
01:33View SolutionLook at graphs in the figures below. Each is the graph of y=p(x), where p(x) is a polynomial. In each of the graphs, find the number of zeroes of p(x) in the given range of x .
 01:57View Solution
x3−2x+5 find coefficient of x2,x1,x0.
02:44View SolutionLook at graphs in the figures below. Each is the graph of y=p(x), where p(x) is a polynomial. In each of the graphs, find the number of zeroes of p(x) in the given range of x .
 02:28View Solution
Look at the graphs in Figure given below. Each is the graph of y=p(x), where p(x) is a polynomial. For each of the graphs, find the number of zeroes of p(x).
02:23View SolutionLook at the graphs in the figures given below. Each is the graph of y=p(x), where p(x) is a polynomial. For each of the graphs, find the number of zeroes of p(x).
 02:33View Solution
