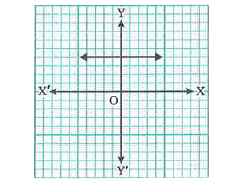
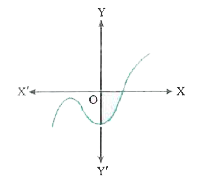
The graphs of y=p(x) are given in the figures below, for some polynomials p(x). Find the number of zeroes of p(x), in each case.
 Solution in Gujrati
The correct Answer is:0
Step by step video, text & image solution for The graphs of y= p (x) are given in the figures below, for some polynomials p(x). Find the number of zeroes of p(x), in each case. by Maths experts to help you in doubts & scoring excellent marks in Class 10 exams.
Updated on:21/07/2023Topper's Solved these Questions
- POLYNOMIALSBook:KUMAR PRAKASHANChapter:POLYNOMIALSExercise:EXERCISE 2.2
Explore 12 Videos
- POLYNOMIALSBook:KUMAR PRAKASHANChapter:POLYNOMIALSExercise:EXERCISE 2.3
Explore 11 Videos
- POLYNOMIALSBook:KUMAR PRAKASHANChapter:POLYNOMIALSExercise:OTHER IMPORTANT EXAMPLES
Explore 5 Videos
- PAIR OF LINEAR EQUATIONS IN TWO VARIABLES Book:KUMAR PRAKASHANChapter:PAIR OF LINEAR EQUATIONS IN TWO VARIABLES Exercise:Test Your Skills
Explore 48 Videos
- PROBABILITY Book:KUMAR PRAKASHANChapter:PROBABILITY Exercise:OBJECTIVE QUESTIONS (State whether each of the following statements is true or false:)
Explore 5 Videos
Similar Questions
Find the zeroes of the following quadratic polynomials and verify the relationship between the zeroes and the coefficients :
x2−2x−8
View SolutionDivide the polynomial p(x) by the polynomial g(x) and find the quotient and remainder in each of the following :
p(x)=x3−3x2+5x−3,g(x)=x2−2
View SolutionThe graphs of y=p(x) are given in the figures below, for some polynomials p(x) :

Find the number of zeroes of p(x) in each case .
View SolutionIf the numerator of a fraction is decreased by 1. It reduces to 12 and if its numerator is increased by 1. it reduces to 1. Represent this situation algebraically and graphically.
View SolutionFor any event A, P (A) is always greater than P(¯¯¯A).
View SolutionDetermine the point of symmetry of a regular hexagon.
View SolutionMatch the following Column A to Column B

View SolutionMatch the following Column A to Column B

View SolutionMatch the following Column A to Column B

View SolutionFind the area of figure given below.

View SolutionFind the perimeter of the figure given below.

View SolutionFind the area of the figure given below.

View SolutionThe area of the shaded part in the figure given below is ______.

View SolutionThe inequation represented by the graph given below is :
View SolutionThe inequation that best describes the graph given below is _________
View SolutionThe inequation that best describes the following graph is _________
View Solution

