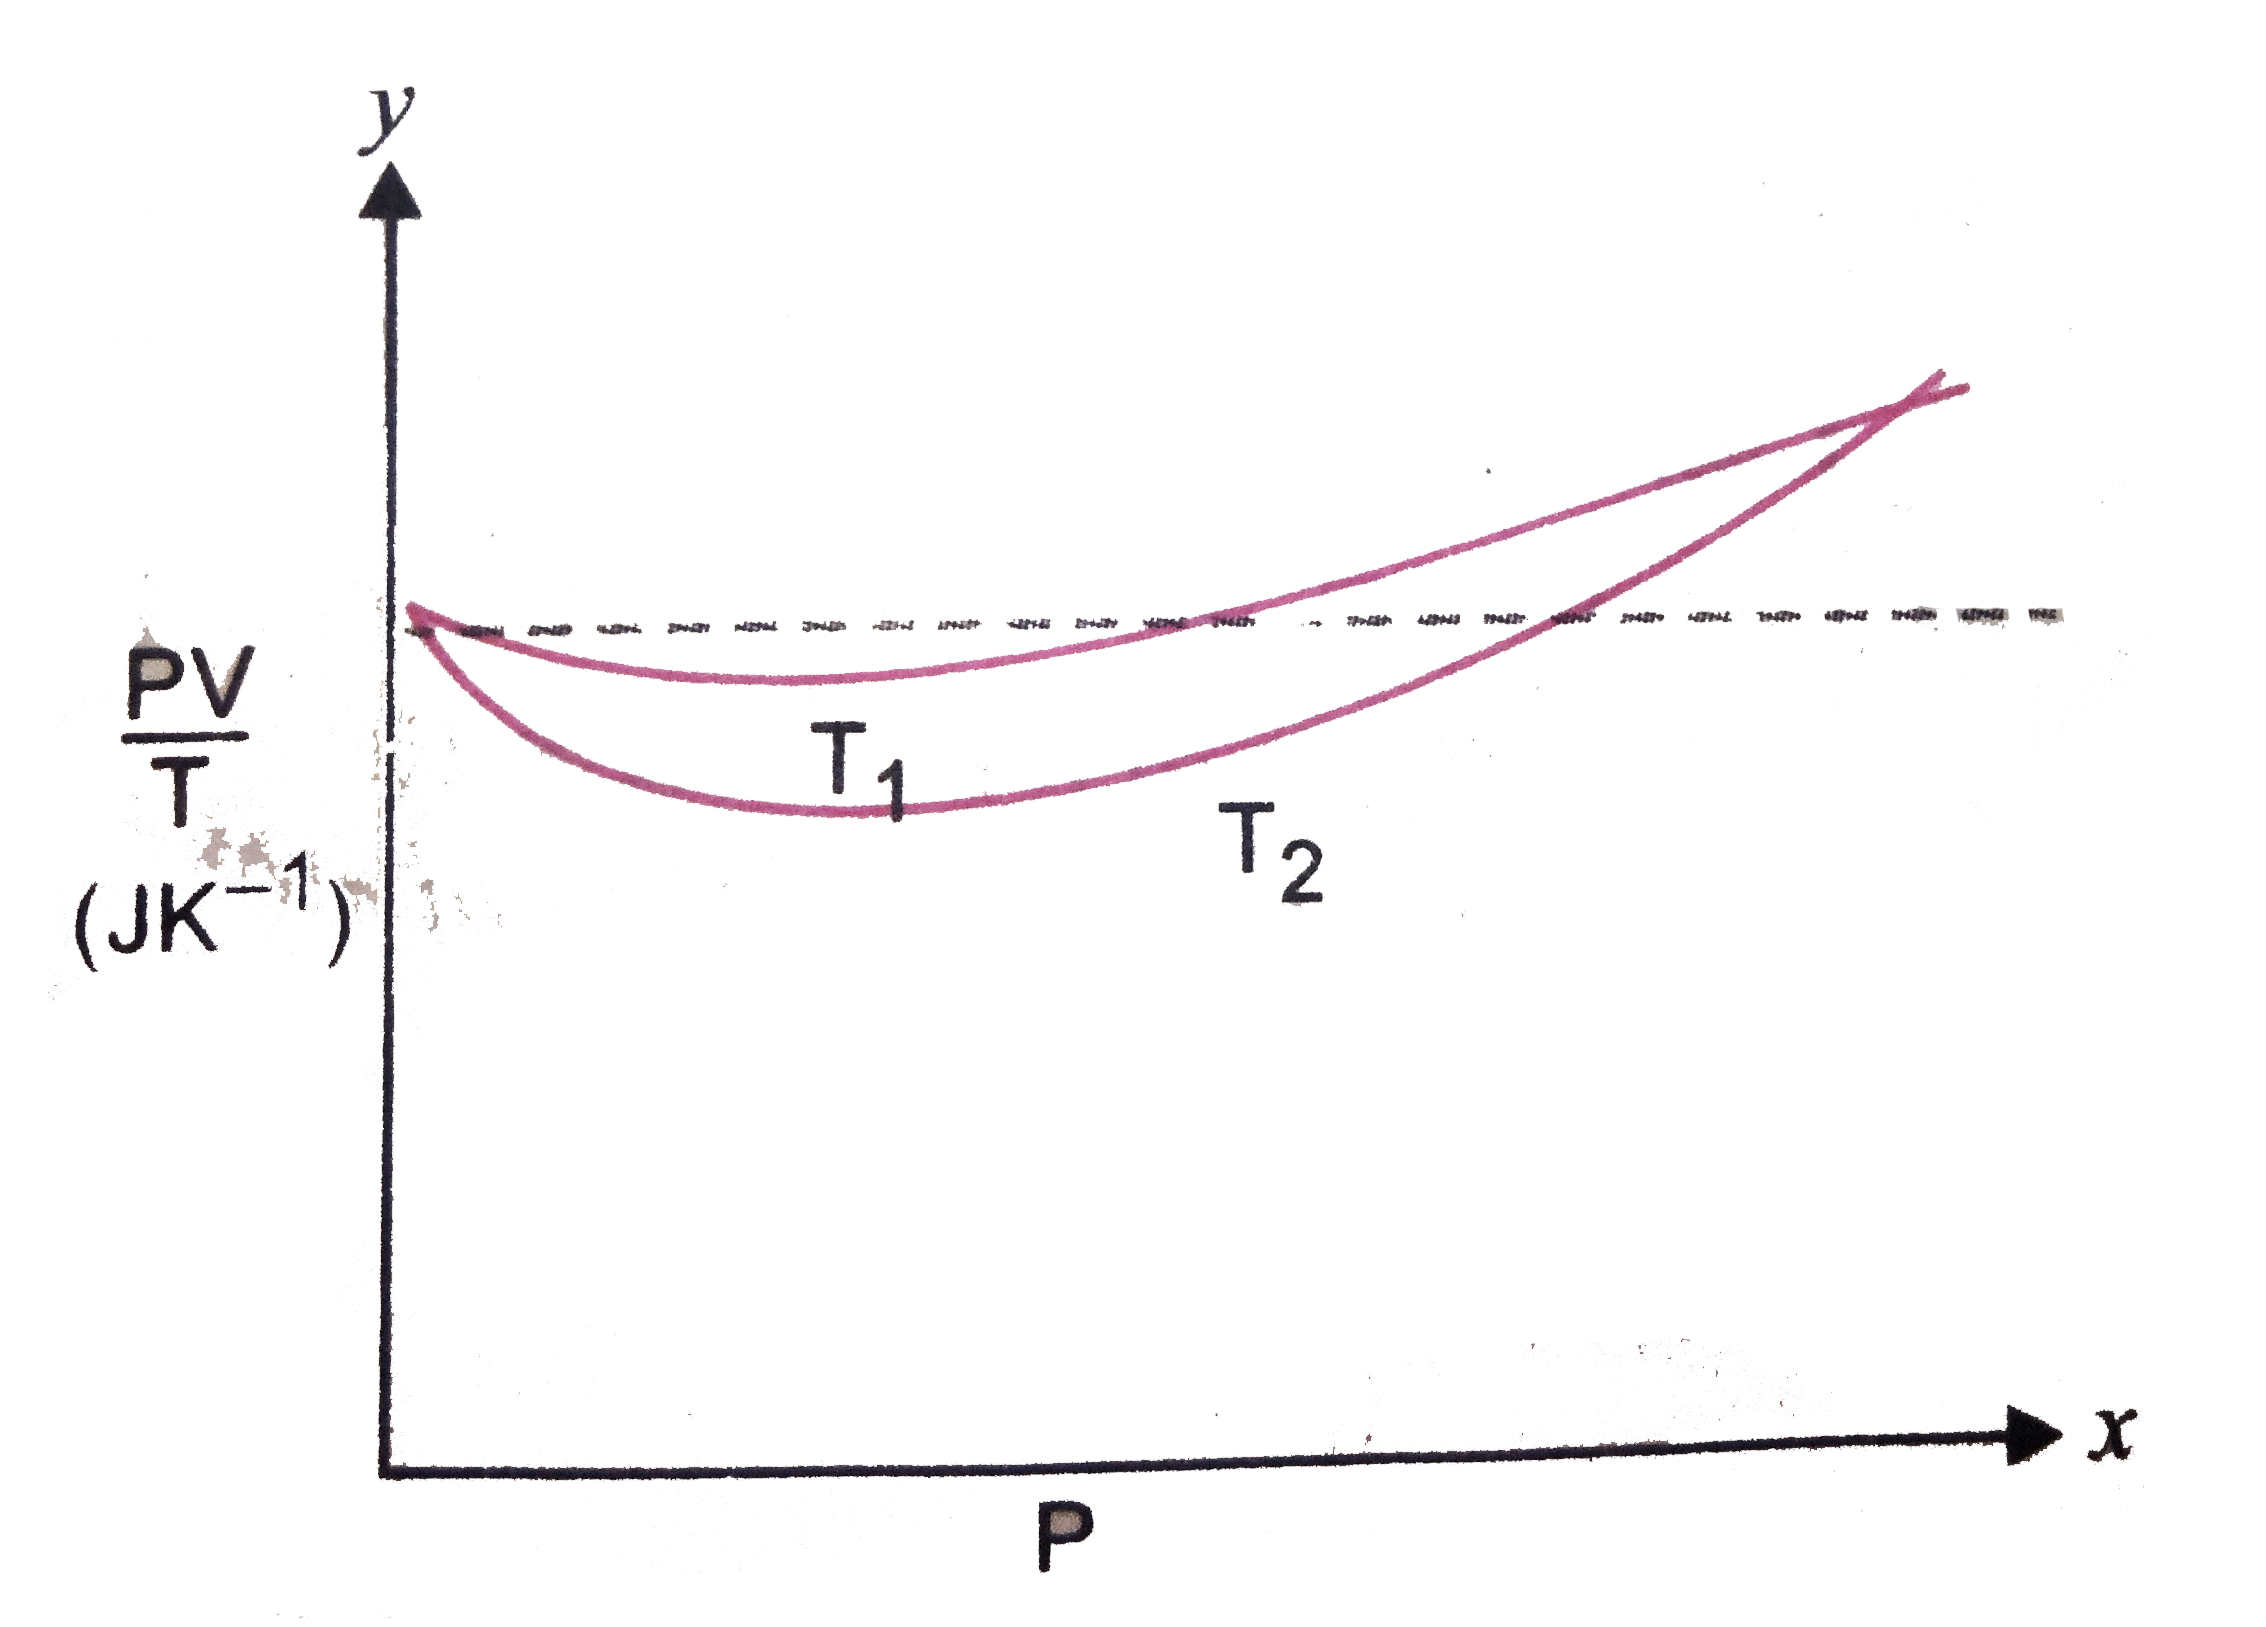
The figure below shows the plot of versus P for oxygen gas at two different temperatures Read the following statements concerning the curves given below

i)The dotted line corresponds to the 'ideal' gas behaviour
ii)T1>T2
iii)The value of PVnT at the point ,where the curves meet on the y-axis is the same for all gases which of the above statement is true?Solution in Telugu
I only
I and ii
all of these
none of these
The correct Answer is:C
Step by step video, text & image solution for The figure below shows the plot of versus P for oxygen gas at two different temperatures Read the following statements concerning the curves given below i)The dotted line corresponds to the 'ideal' gas behaviour ii)T_(1)gtT_(2) iii)The value of (PV)/(nT) at the point ,where the curves meet on the y-axis is the same for all gases which of the above statement is true? by Physics experts to help you in doubts & scoring excellent marks in Class 11 exams.
Updated on:21/07/2023Topper's Solved these Questions
- KINETIC THEORY OF GASESBOOK - AAKASH SERIESCHAPTER - KINETIC THEORY OF GASESEXERCISE - EXERCISE-IB(Theoretical Questions)
29 Videos
- KINETIC THEORY OF GASESBOOK - AAKASH SERIESCHAPTER - KINETIC THEORY OF GASESEXERCISE - EXERCISE-2(Kinetic Theory of an ideal gas)
25 Videos
- KINETIC THEORY OF GASESBOOK - AAKASH SERIESCHAPTER - KINETIC THEORY OF GASESEXERCISE - EXERCISE-IA (kinetic theory of an ideal a gas)
42 Videos
- KINEMATICSBOOK - AAKASH SERIESCHAPTER - KINEMATICSEXERCISE - ADDITIONAL PRACTICE EXERCISE (PRACTICE SHEET (ADVANCED)) (Integer Type Questions)
12 Videos
- LAWS OF MOTIONBOOK - AAKASH SERIESCHAPTER - LAWS OF MOTIONEXERCISE - PRACTICE EXERCISE
108 Videos
Similar Questions
(A): The total translational kinetic energy of all the molecules of a given mass of an ideal gas is 1.5 times the product of its pressure and its volume.
(R): The molecules of a gas collide with each other and the velocities of the molecules change due to the collision.
View Solutioncylinder of capacity 20 litres is filled with H2 gas. The total average kinetic energy of translatory motion of its molecules is 1.5×10⁵ J. The pressure of hydrogen in the cylinder is
View SolutionPressure exerted by a gas is
View SolutionThree particles start from origin at the same time: one with velocity v1 along positive x - axis, the second along the positive y-axis with a velocity v2 and the third along the line y=x with such a speed that all the three always stay in a straight line, then the velocity of the third particle is √kV1V2(V1+V2).
View SolutionA force of 50 N acts on a body of mass 10 kg at rest. Its velocity after 5 seconds if the same force acts, is
View SolutionFig shows of PV/T versus P for 1.00×10⁻³kg of oxygen gas at two different temperatures.
(a) What does the dotted plot signify ?
(b) Which is true : T1<T2orT2<T1?
( c) What is the value of PV/T where the curves meet on the Y-axis ?
(d) If we obtained similar plot for 1.00×10⁻³kg of hydrogen, would we get the same value of PV/T at the point where the curves meet on the y-axis ? If not, what mass of hydrogen yield the same value of PV/T (for low pressure high temperature region of the plot) ? (Molecular mass of H=2.02u, of O=32.0u,R=8.31Jmol−1K−1
View SolutionFigure shows plot of PV//T versus P"for" 1.00 xx 10^(-3) kg of oxygen gas at two different temperatures. (i) What does the dotted plot signify? (ii) Which is true . T_(1) gt T_(2) "or" T_(1) lt T_(2) ? (iii) What is the value of PV//T where the curves meet on the y-axis?
View SolutionThe figure below shows the plot of (PV)/(nT) versus P for oxygen gas at two different temperatures (##ARH_EGN_PRG_PHY_C17_E01_014_Q01.png" width="80%"> Read the following statements concerning the above curves. (i) The dotted line corresponds to the ideal gas behaviour (ii) T_(1)gtT_(2) The value of (pV)/(nT) at the point where the curves meet on the y-axis is the same for all gases Which of the above statements is true ?
View SolutionThe figure shows the plot of PVnT vs P, for oxygen gas at two different temperatures then
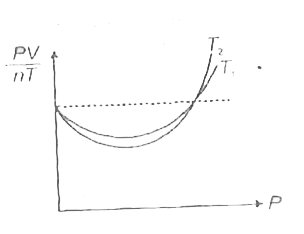
View SolutionFigure Show plot of PV/T versus P for 1.00×10⁻³ kg of oxygen gas at two different temperatures.
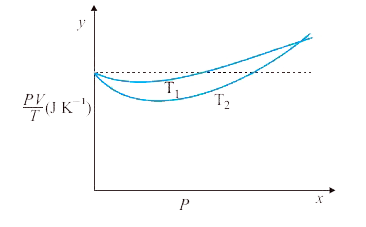
(a) What does the dotted plot signify?
(b) Which is true: T1>T2 or T1<T2?
(c) What is the value of PV/T where the curves meet on the y-axis?
(d) If we obtained similar plots for 1.00×10⁻³ kg of hydrogen, would we get the same value of PV/T at the point where the curves meet on the y-axis? If not, what mass of hydrogen yields the same value of PV/T (for low pressure high temperature region of the plot) ? (Molecular mass of H2=2.02u,ofO2=32.0u,R=8.31Jmol−1K−1.)
View SolutionFigure Show plot of PV/T versus P for 1.00×10⁻³ kg of oxygen gas at two different temperatures.
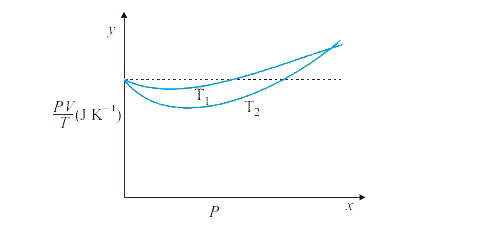
(a) What does the dotted plot signify?
(b) Which is true: T1>T2 or T1<T2?
(c) What is the value of PV/T where the curves meet on the y-axis?
(d) If we obtained similar plots for 1.00×10⁻³ kg of hydrogen, would we get the same value of PV/T at the point where the curves meet on the y-axis? If not, what mass of hydrogen yields the same value of PV/T (for low pressure high temperature region of the plot) ? (Molecular mass of H_(2) = 2.02 u, of O_(2) = 32.0 u, R= 8.31Jmol^(-1)K^(-1).)
View SolutionFigure Show plot of PV/T versus P for 1.00×10⁻³ kg of oxygen gas at two different temperatures.
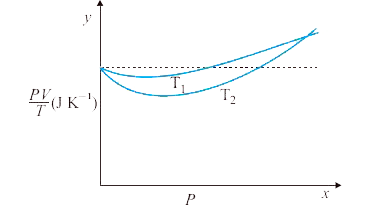
(a) What does the dotted plot signify?
(b) Which is true: T1>T2 or T1<T2?
(c) What is the value of PV/T where the curves meet on the y-axis?
(d) If we obtained similar plots for 1.00×10⁻³ kg of hydrogen, would we get the same value of PV/T at the point where the curves meet on the y-axis? If not, what mass of hydrogen yields the same value of PV/T (for low pressure high temperature region of the plot) ? (Molecular mass of H_(2) = 2.02 u, of O_(2) = 32.0 u, R= 8.31Jmol^(-1)K^(-1).)
View SolutionFigure Show plot of PV/T versus P for 1.00×10⁻³ kg of oxygen gas at two different temperatures.
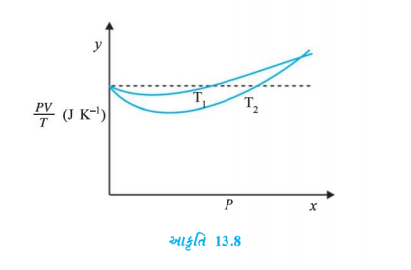
(a) What does the dotted plot signify?
(b) Which is true: T1>T2 or T1<T2?
(c) What is the value of PV/T where the curves meet on the y-axis?
(d) If we obtained similar plots for 1.00×10⁻³ kg of hydrogen, would we get the same value of PV/T at the point where the curves meet on the y-axis? If not, what mass of hydrogen yields the same value of PV/T (for low pressure high temperature region of the plot) ? (Molecular mass of H_(2) = 2.02 u, of O_(2) = 32.0 u, R= 8.31Jmol^(-1)K^(-1).)
View SolutionFigure show plot of (PV)/(T) and P for 2gm of oxygen gas at two different temeratures. (i)The significance of dotted line (ii)The relation between T_(1) and T_(2) (iii)The value of (PV)/(T) where the curves meet on the Y-axis.
View SolutionFigure shows plot of PVT and P for 2gm of oxygen gas at two different temperatures
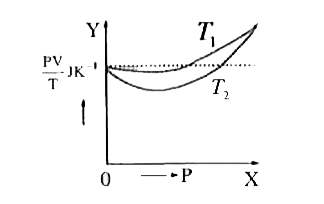
(i) The significance of dotted line
(ii) The relation between T1andT2
(iii) The value of PVT where the curves meet on the x-axis.
View Solution
