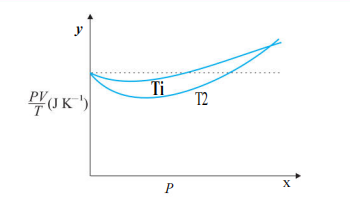
Figure 13.8 shows plot of versus P for kg of oxygen gas at two different temperatures.Which is true: T_1 > T_2 or T_1 < T_2?:
 Solution in Punjabi
Step by step video & image solution for Figure 13.8 shows plot of PV//T versus P for l.OOxxlO^-3 kg of oxygen gas at two different temperatures.Which is true: T_1 > T_2 or T_1 < T_2?: by Physics experts to help you in doubts & scoring excellent marks in Class 11 exams.
Updated on:21/07/2023Topper's Solved these Questions
Similar Questions
Answer the following :- You can shield a charge from electrical forces by putting it inside a hollow conductor. Can you shield a body from the gravitational influence of nearby matter by putting it inside a hollow sphere or by some other means ?
View SolutionGive the magnitude and direction of the net force acting on:- a drop of rain falling down with a constant speed.
View Solutiont1=(sinθ)cosθ,t2=(sinθ)sinθ,t3=(cosθ)cosθ,t4=(cosθ)sinθ (A) t3>t1>t2 (B) t4>t2>t1 (C) t4>t1>t2 (D) t1>t3>t2
View SolutionThe current - voltage graphs for a given metallic wire at two different temperatures T1andT2 are shown in the figure.
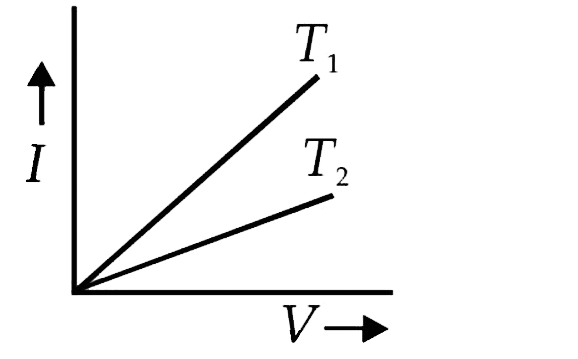
The temperature T2 is greater than T1.
View SolutionThe product (PV) is plotted against P at two temperature T1andT2 and the result is given in following figure
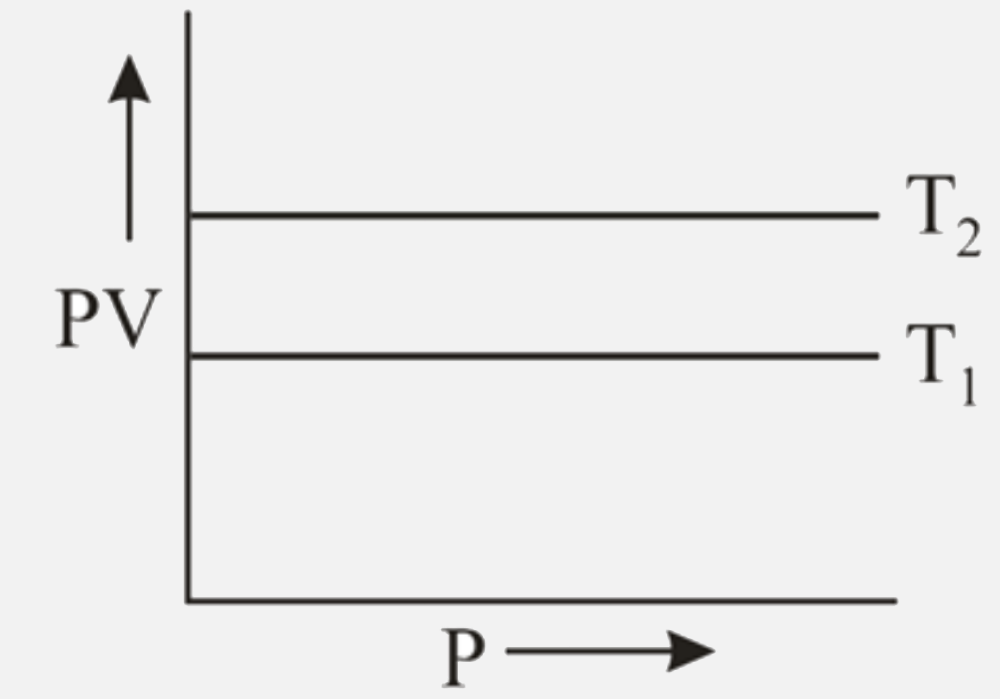
What is correct about T1andT2 ?
View Solutionদুটি ভিন্ন তাপমাত্রা T1 এবং T2 -তে (T2>T1) নির্দিষ্ট ভরের একটি আদর্শ গ্যাসের PV−P লেখচিত্র দুটি অঙ্কন করাে ।
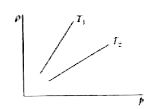
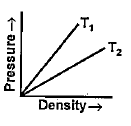
View SolutionFigure shows graphs of pressure versus density for an ideal gas at two temperatures T1 and T2 Then
View SolutionV-I graph for a mettalic wire at two different temperatures T1 and T2 is as shown in figure. WHich of the temperatures T1 and T2 is higher and why.

View Solutionp - V diagram of same mass of a gas are drawn at two different temperatures (T_1) and (T_2) . Explain whether T_1 gt T_2 or T_2 gt T_1 . .
View SolutionFigure shows graphs of pressure versus density for an ideal gas at two temperatures T1 and T2. Which is correct:
View SolutionThe current - voltage graphs for a given metallic wire at two different temperatures T_1 and T_2 are shown in the figure. The temperature T_2 is greater than T_1 .
View SolutionShow that the points (at21,2at1)(at22,2at2) and (a,0) are collinear if t1t2=−1
View SolutionThe current - voltage graphs for a given metallic wire at two different temperatures T_1 and T_2 are shown in the figure. The temperature T_2 is greater than T_1 .
View SolutionFigure 13.8 shows plot of PV/T versus P for l.OO×lO−3 kg of oxygen gas at two different temperatures. What does the dotted plot signif?:
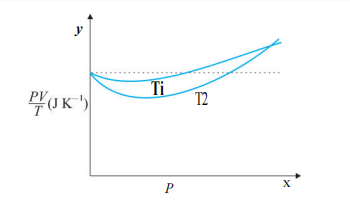
View SolutionFigure 13.8 shows plot of PV//T versus P for l.OOxxlO^-3 kg of oxygen gas at two different temperatures What is the value of PV/Twhere the curves meet on the y-axis? :
View Solution
