Draw the following graphs (expected nature only) between distance and time of an object in case of:For a body moving with uniform velocity.
To draw the graph between distance (s) and time (t) for a body moving with uniform velocity, we can follow these steps:
1. Understand the Concept of Uniform Velocity:
- Uniform velocity means that the object covers equal distances in equal intervals of time. There is no change in speed, and hence, the acceleration is zero.
2. Identify the Relationship:
- The relationship between distance and time for uniform velocity can be expressed with the equation:
s=ut
- Here, s is the distance, u is the uniform velocity, and t is the time.
3. Graph Characteristics:
- Since the equation s=ut is linear, the graph will be a straight line.
- The slope of the line represents the uniform velocity u.
4. Plotting the Graph:
- On the x-axis, plot time t.
- On the y-axis, plot distance s.
- Start from the origin (0,0) because at time t=0, the distance s is also 0.
5. Drawing the Line:
- Draw a straight line from the origin that extends upwards to the right. The angle of the line with the x-axis will depend on the value of the uniform velocity u.
- The steeper the line, the greater the velocity.
6. Labeling the Graph:
- Label the axes: x-axis as "Time (t)" and y-axis as "Distance (s)".
- Optionally, indicate the slope as u (the uniform velocity).
Final Graph:
The resulting graph will be a straight line starting from the origin (0,0) and extending in the first quadrant, indicating that as time increases, distance also increases linearly.
---
- Uniform velocity means that the object covers equal distances in equal intervals of time. There is no change in speed, and hence, the acceleration is zero.
- The relationship between distance and time for uniform velocity can be expressed with the equation:
s=ut
- Here, s is the distance, u is the uniform velocity, and t is the time.
- Since the equation s=ut is linear, the graph will be a straight line.
- The slope of the line represents the uniform velocity u.
- On the x-axis, plot time t.
- On the y-axis, plot distance s.
- Start from the origin (0,0) because at time t=0, the distance s is also 0.
- Draw a straight line from the origin that extends upwards to the right. The angle of the line with the x-axis will depend on the value of the uniform velocity u.
- The steeper the line, the greater the velocity.
- Label the axes: x-axis as "Time (t)" and y-axis as "Distance (s)".
- Optionally, indicate the slope as u (the uniform velocity).
The resulting graph will be a straight line starting from the origin (0,0) and extending in the first quadrant, indicating that as time increases, distance also increases linearly.
Topper's Solved these Questions
Similar Questions
Knowledge Check
The graph between displacement and time for a particle moving with uniform acceleration is a
Astraight line with a positive slopeBparabolaCellipseDstraight line parallel to time axisThe slope of a distance-time graph of a moving object indicates :
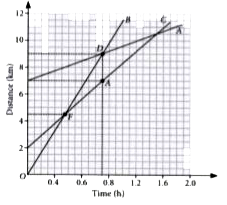
Adistance moved by the objectBtime taken by the objectCspeed of the objectDposition of the objectGiven figure shows the distance - time graph of three object A, B and C as time is taken on x- axis and distance is taken on y - axis . The slope of the distance - time graph of an object represents its speed .
The magnitude of displacement equal to the distance travelled by the object , then we can use the term uniform velocity in place of uniform speed

Choose the correct distance - time graph for an object moving with uniform velocityA B
B C
C D
D
Draw distance time graph of a body moving with constant acceleration.
View SolutionDraw the velocity-time graph of an object moving with uniform positive acceleration.
View SolutionDraw the velocity-time graph of an object moving with uniform negative acceleration.
View SolutionWhat is the nature of the distance time graph for an object moving uniformly along a straight long road ?
View SolutionDraw velocity time graph of a body moving with constant retardation.
View Solution

