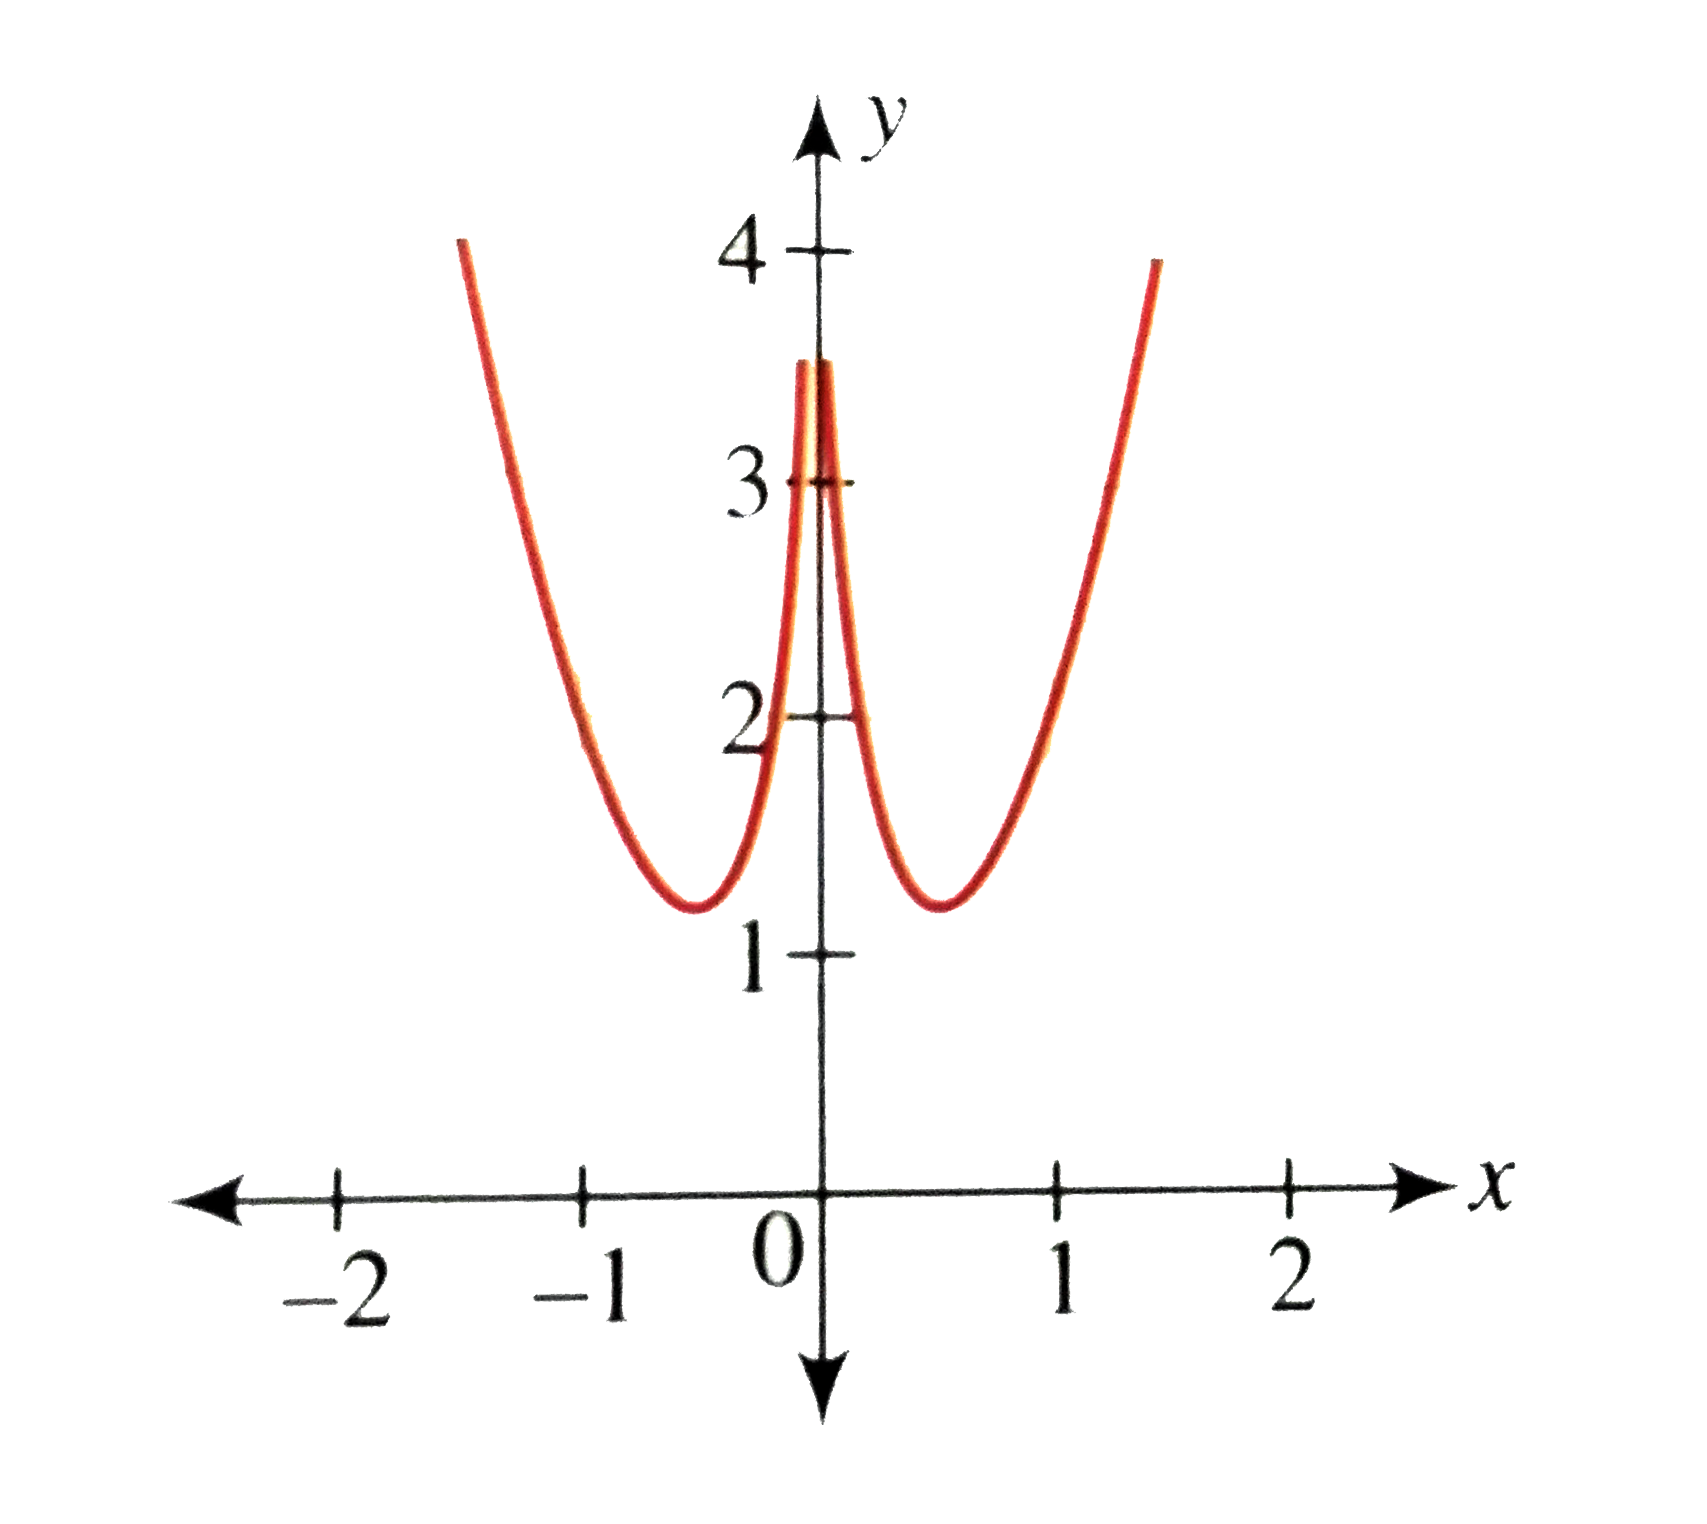
Draw the graph of the function f(x)=2x2−loge|x|
Video Solution
Text Solution
We have f(x)=2x2−loge|x|,x≠0
Clearly, f(x) is an even function, hence its graph is symmetrical about the y-axis.
limx→0+(2x2−loge|x|)=∞ and limx→±∞(2x2−loge|x|)=∞ (as difference between the value of 2x2 and ln|x| is infinite, loge|x| increases very slowly, but 2x2 increases faster)
Also f′(x)=4x−1x=4x2−1x
f′(x)=0⇒x=±12
From the limiting values of the function at x=0 and at inifinity, we can conclude that x=±12 are points of minima.
From the above discussion, the graph of the function is as shown in the following figure.

|
Updated on:21/07/2023
Topper's Solved these Questions
Similar Questions
Draw the graph of the function f(x)=xx
View SolutionDraw the graph of the function f(x)=|x−1|
View SolutionDraw the graph of the function f(x)=(1x)x
View SolutionDraw the graph of the function f(x)=(1+1x)2
View SolutionDraw the graph of the function: f(x)=log|x|
View SolutionDraw the graph of the function f(x)=−x|x|.
View SolutionDraw the graph of the function: |f(x)|=tanx
View SolutionDraw the graph of the function: |f(x)|=tanx
View SolutionDraw the graph of the function: f(x)=||x−2|−3|
View SolutionDraw the graph of the function: f(x)=||x−2|−3|
View Solution
