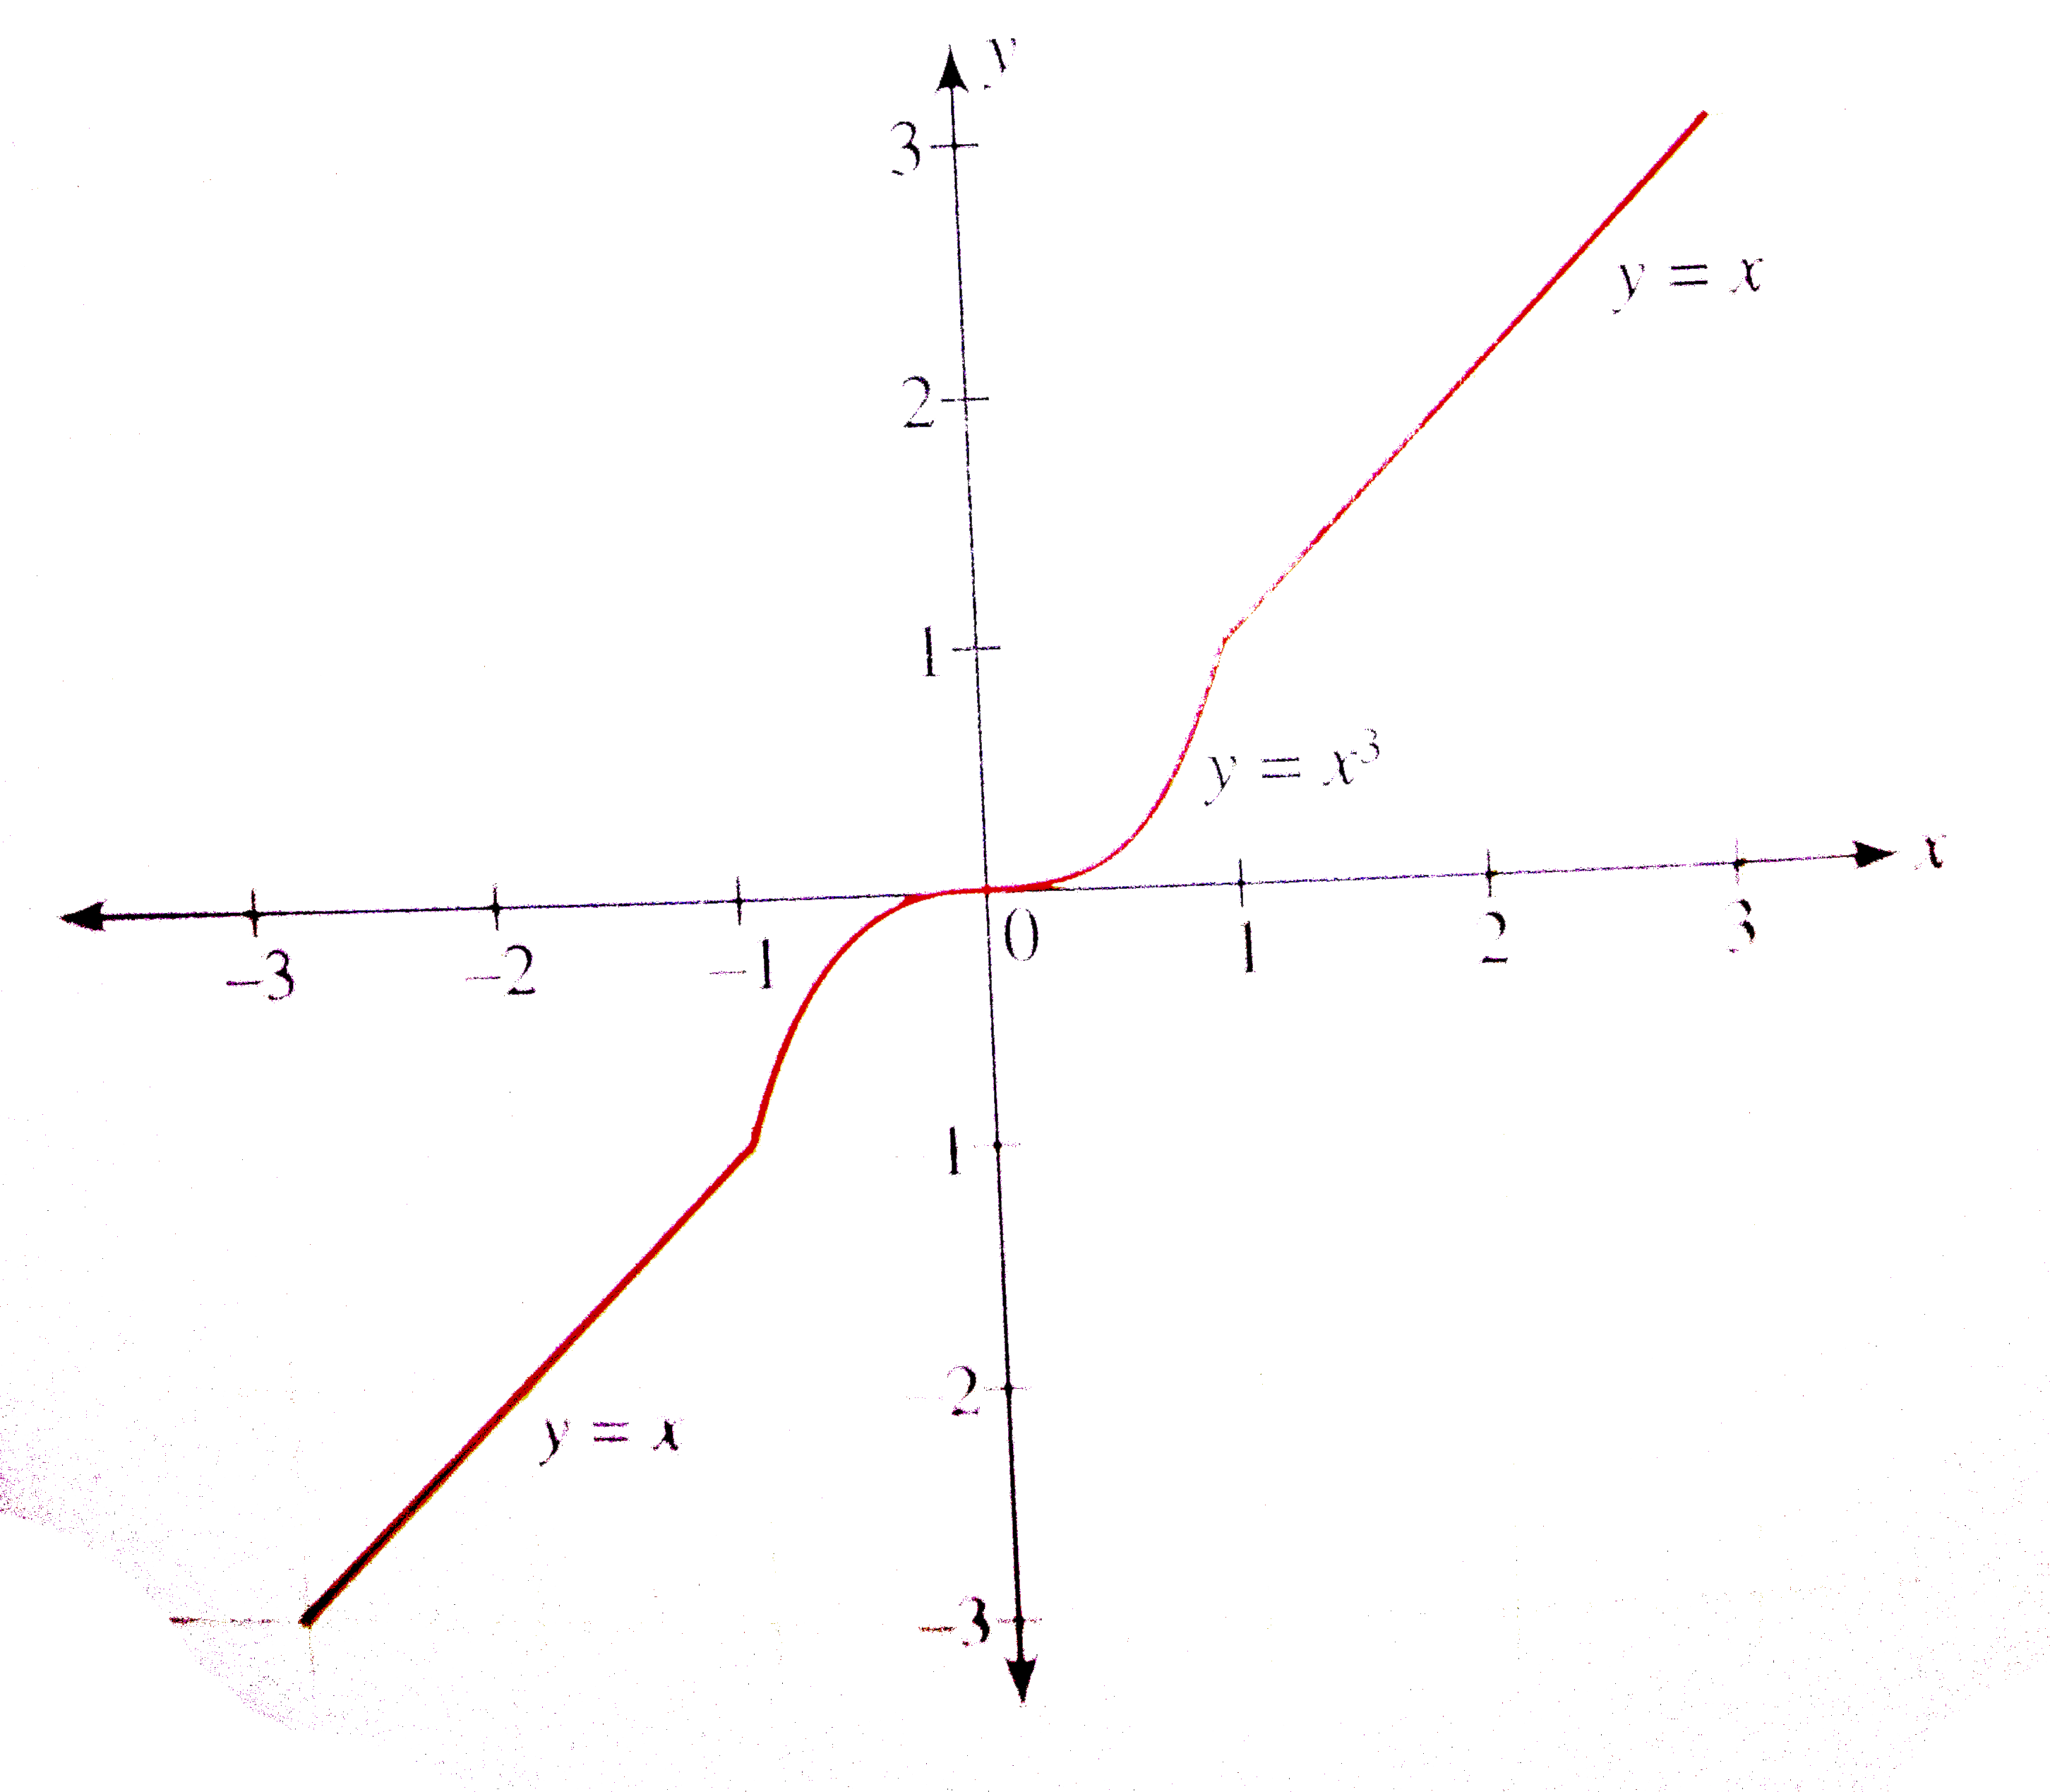
Draw the graph of f(x)={x3,x2<1x,x2≥1
Video Solution
Text Solution
f(x)={x3,x2<1x,x2≤1
={x3,−1<x<1x,x≤−1,x≥1
So the graph of the function is as follows : ltBrgt 
|
Topper's Solved these Questions
- GRAPHS OF ELEMENTARY FUNCTIONS BOOK - CENGAGE ENGLISHCHAPTER - GRAPHS OF ELEMENTARY FUNCTIONS EXERCISE - EXERCISES
34 Videos
- GRAPHS OF POLYNOMIAL AND RATIONAL FUNCTIONSBOOK - CENGAGE ENGLISHCHAPTER - GRAPHS OF POLYNOMIAL AND RATIONAL FUNCTIONSEXERCISE - Exercises
17 Videos
- GRAPHS OF TRIGONOMETRIC FUNCTIONSBOOK - CENGAGE ENGLISHCHAPTER - GRAPHS OF TRIGONOMETRIC FUNCTIONSEXERCISE - Exercises
22 Videos
Similar Questions
Draw the graph of f(x)=x3−xx2−1.
View SolutionDraw the graph of y=f(x)=x2x2+1.
View SolutionDraw the graph of f(x)=√1−e−x2
View SolutionDraw the graph of f(x)=(x+2)|x−1|.
View SolutionDraw the graph of f(x)=5x2(x−1)3.
View SolutionDraw the graph of f(x)=x2−x+1x2+x+1 .
View SolutionDraw the graph of f(x)=x2−x+1x2+x+1 .
View SolutionDraw the graph of f(x)=2|x−1|x2+1.
View SolutionDraw the graph of f(x)=|x−1|x−1.
View SolutionDraw the graph of f(x)=∣∣∣x2−2x2−1∣∣∣ .
View Solution
