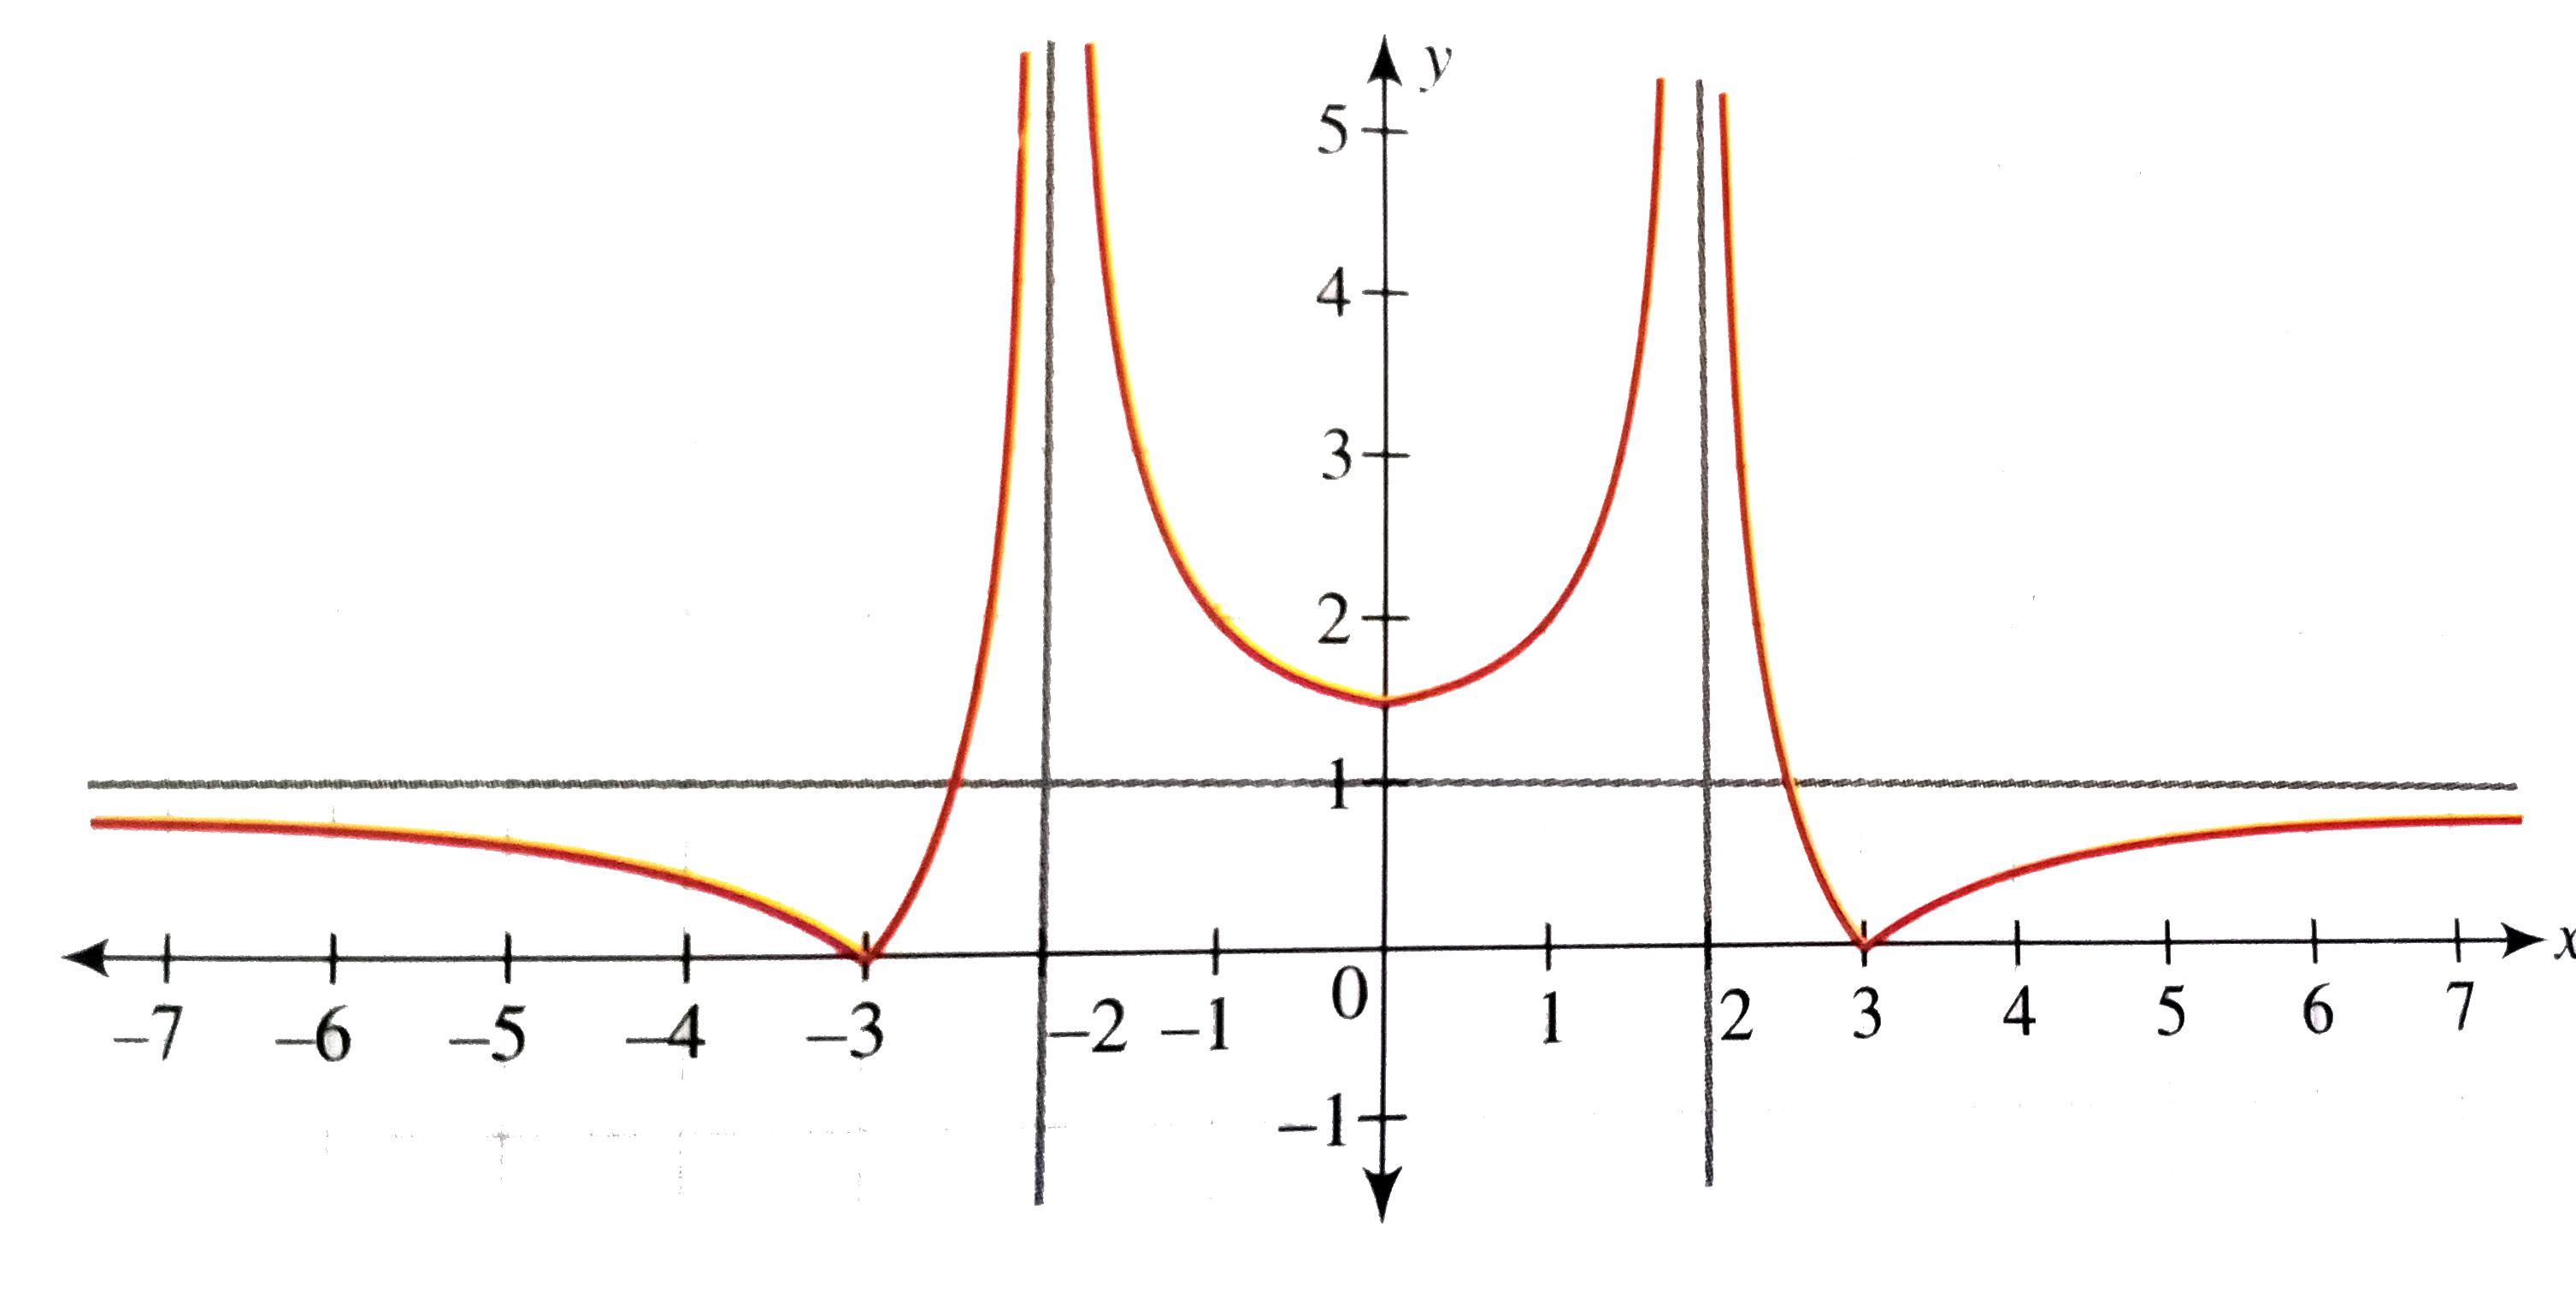
Draw the graph of y=∣∣∣1−1|x|−2∣∣∣.
Video Solution
Text Solution
We have y=∣∣∣1−1|x|−2∣∣∣
Consider y=1x−2, the graph of which is a rectangular hyperbola having centre at (2,0).
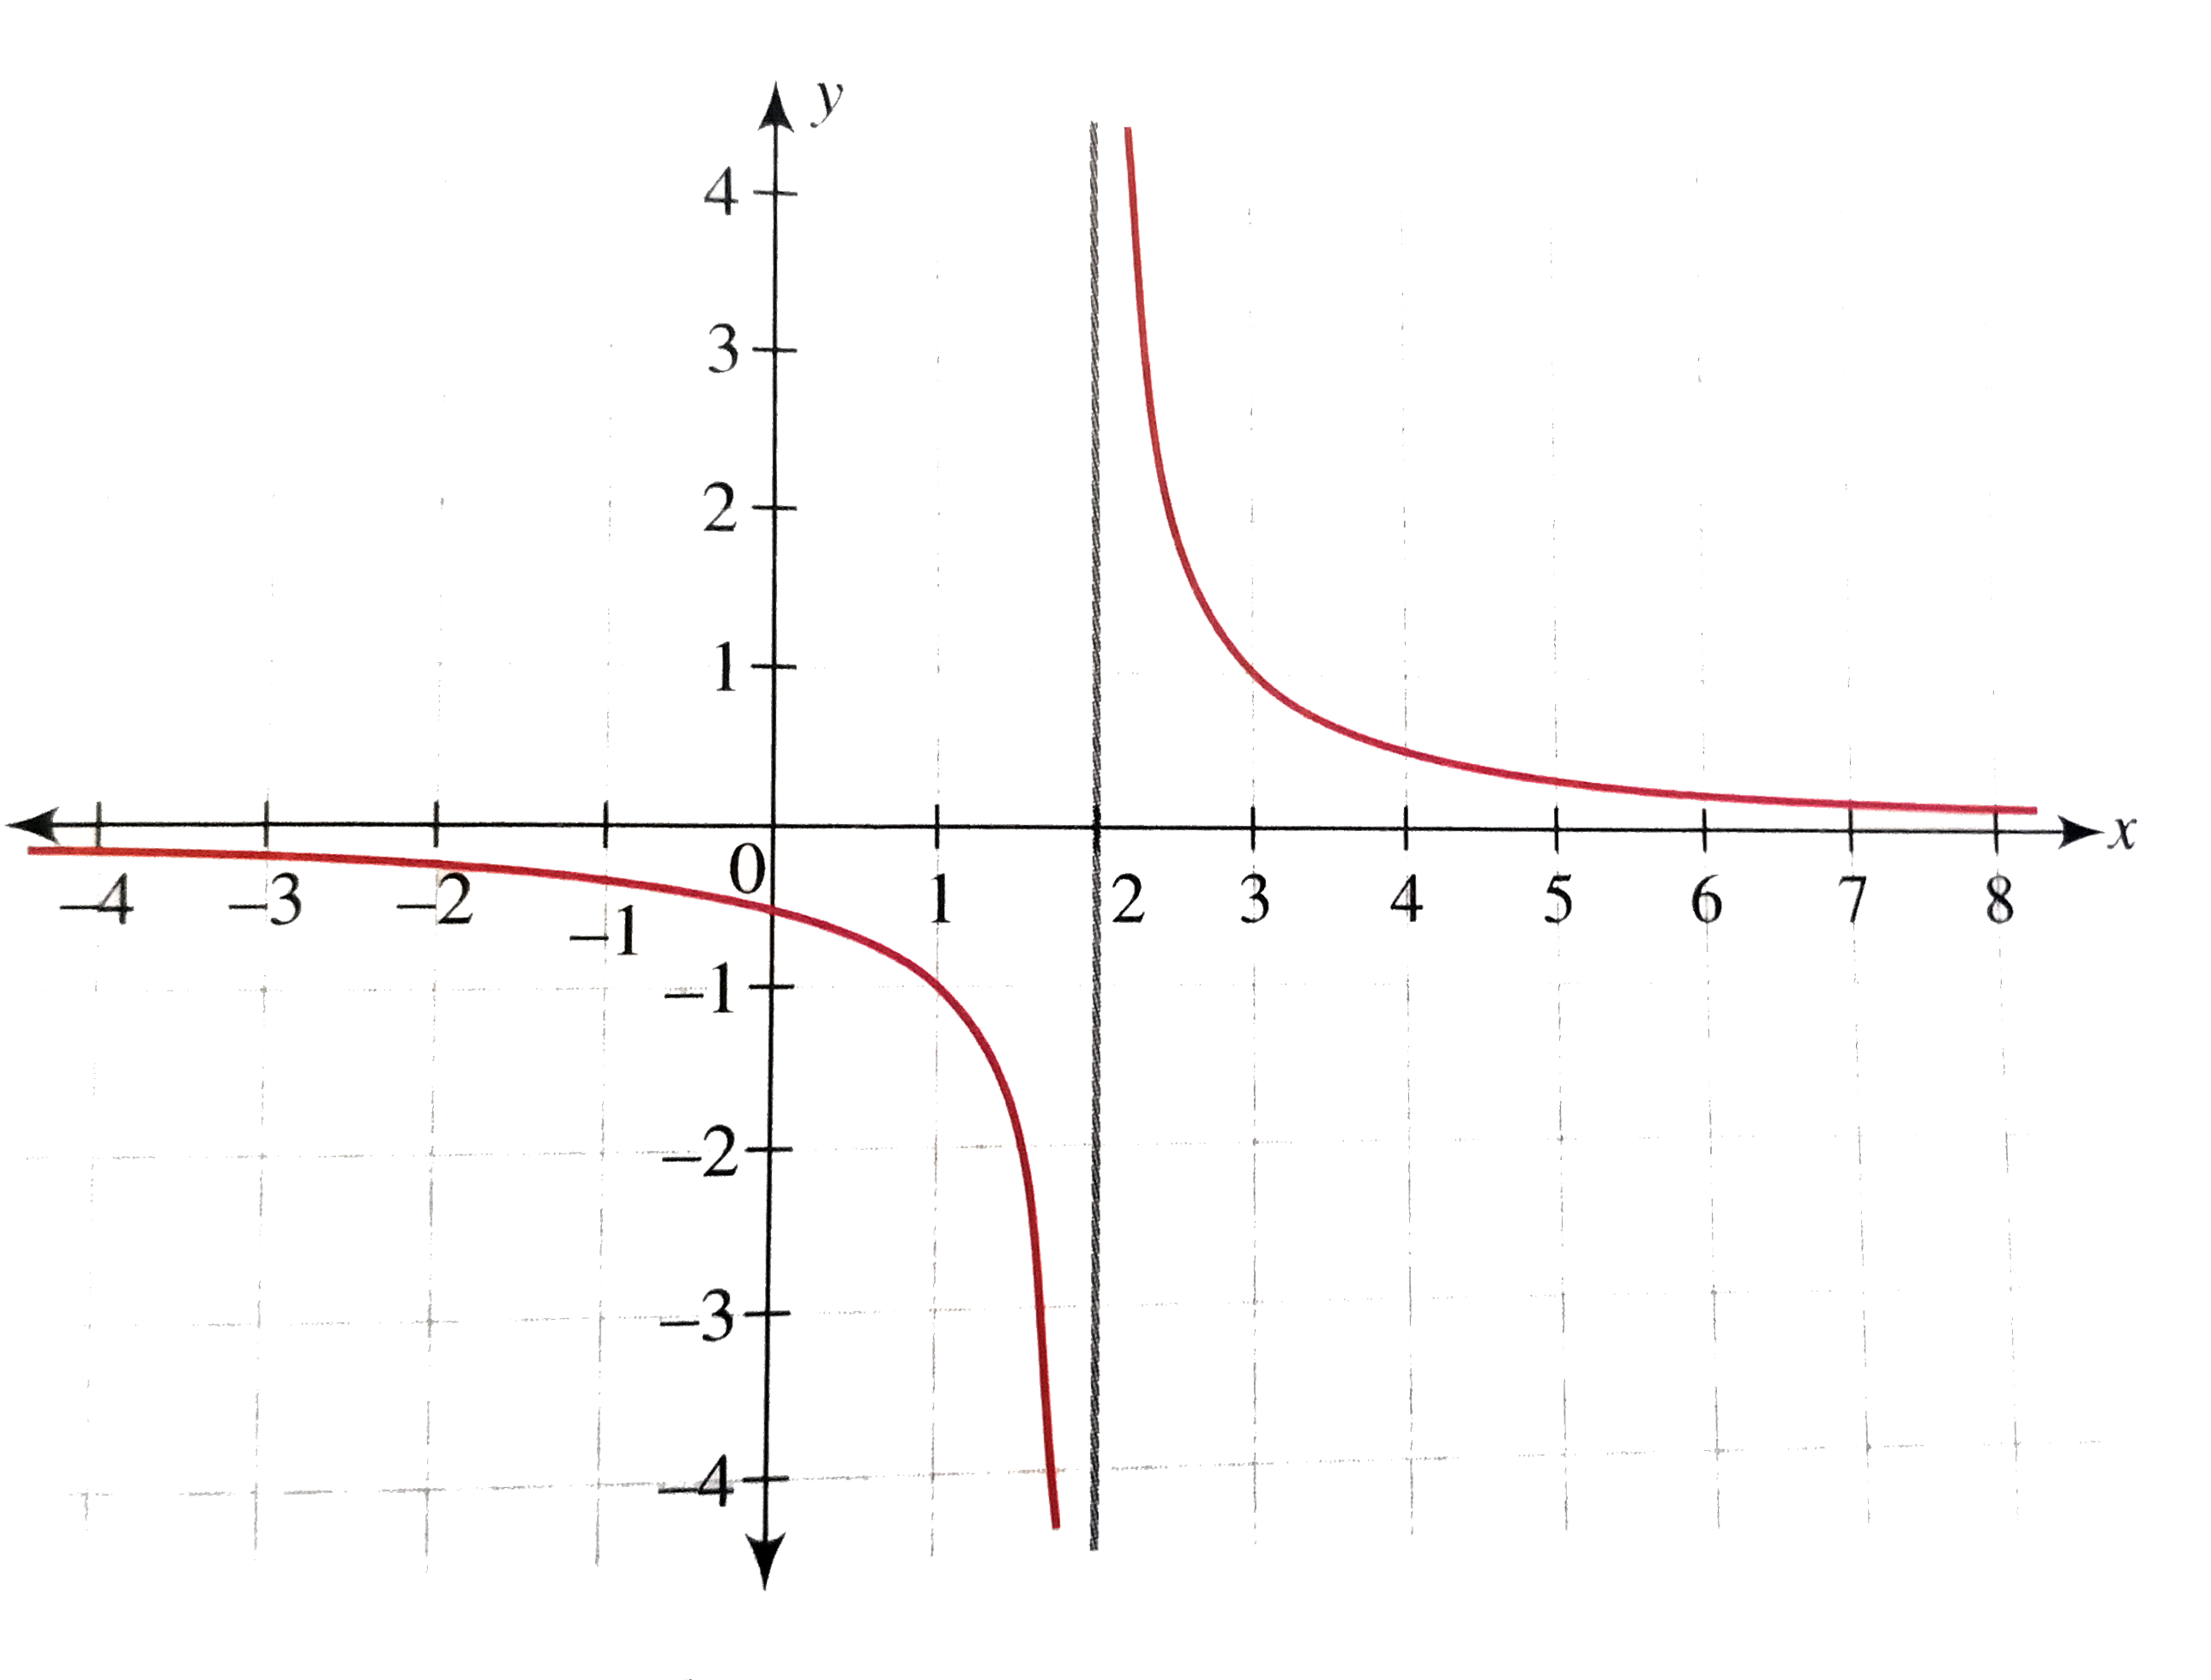
To draw the graph of y=1|x|−2, in the above graph neglect the graph for x<0 and reflect the graph for x≥0 in the y-axis.
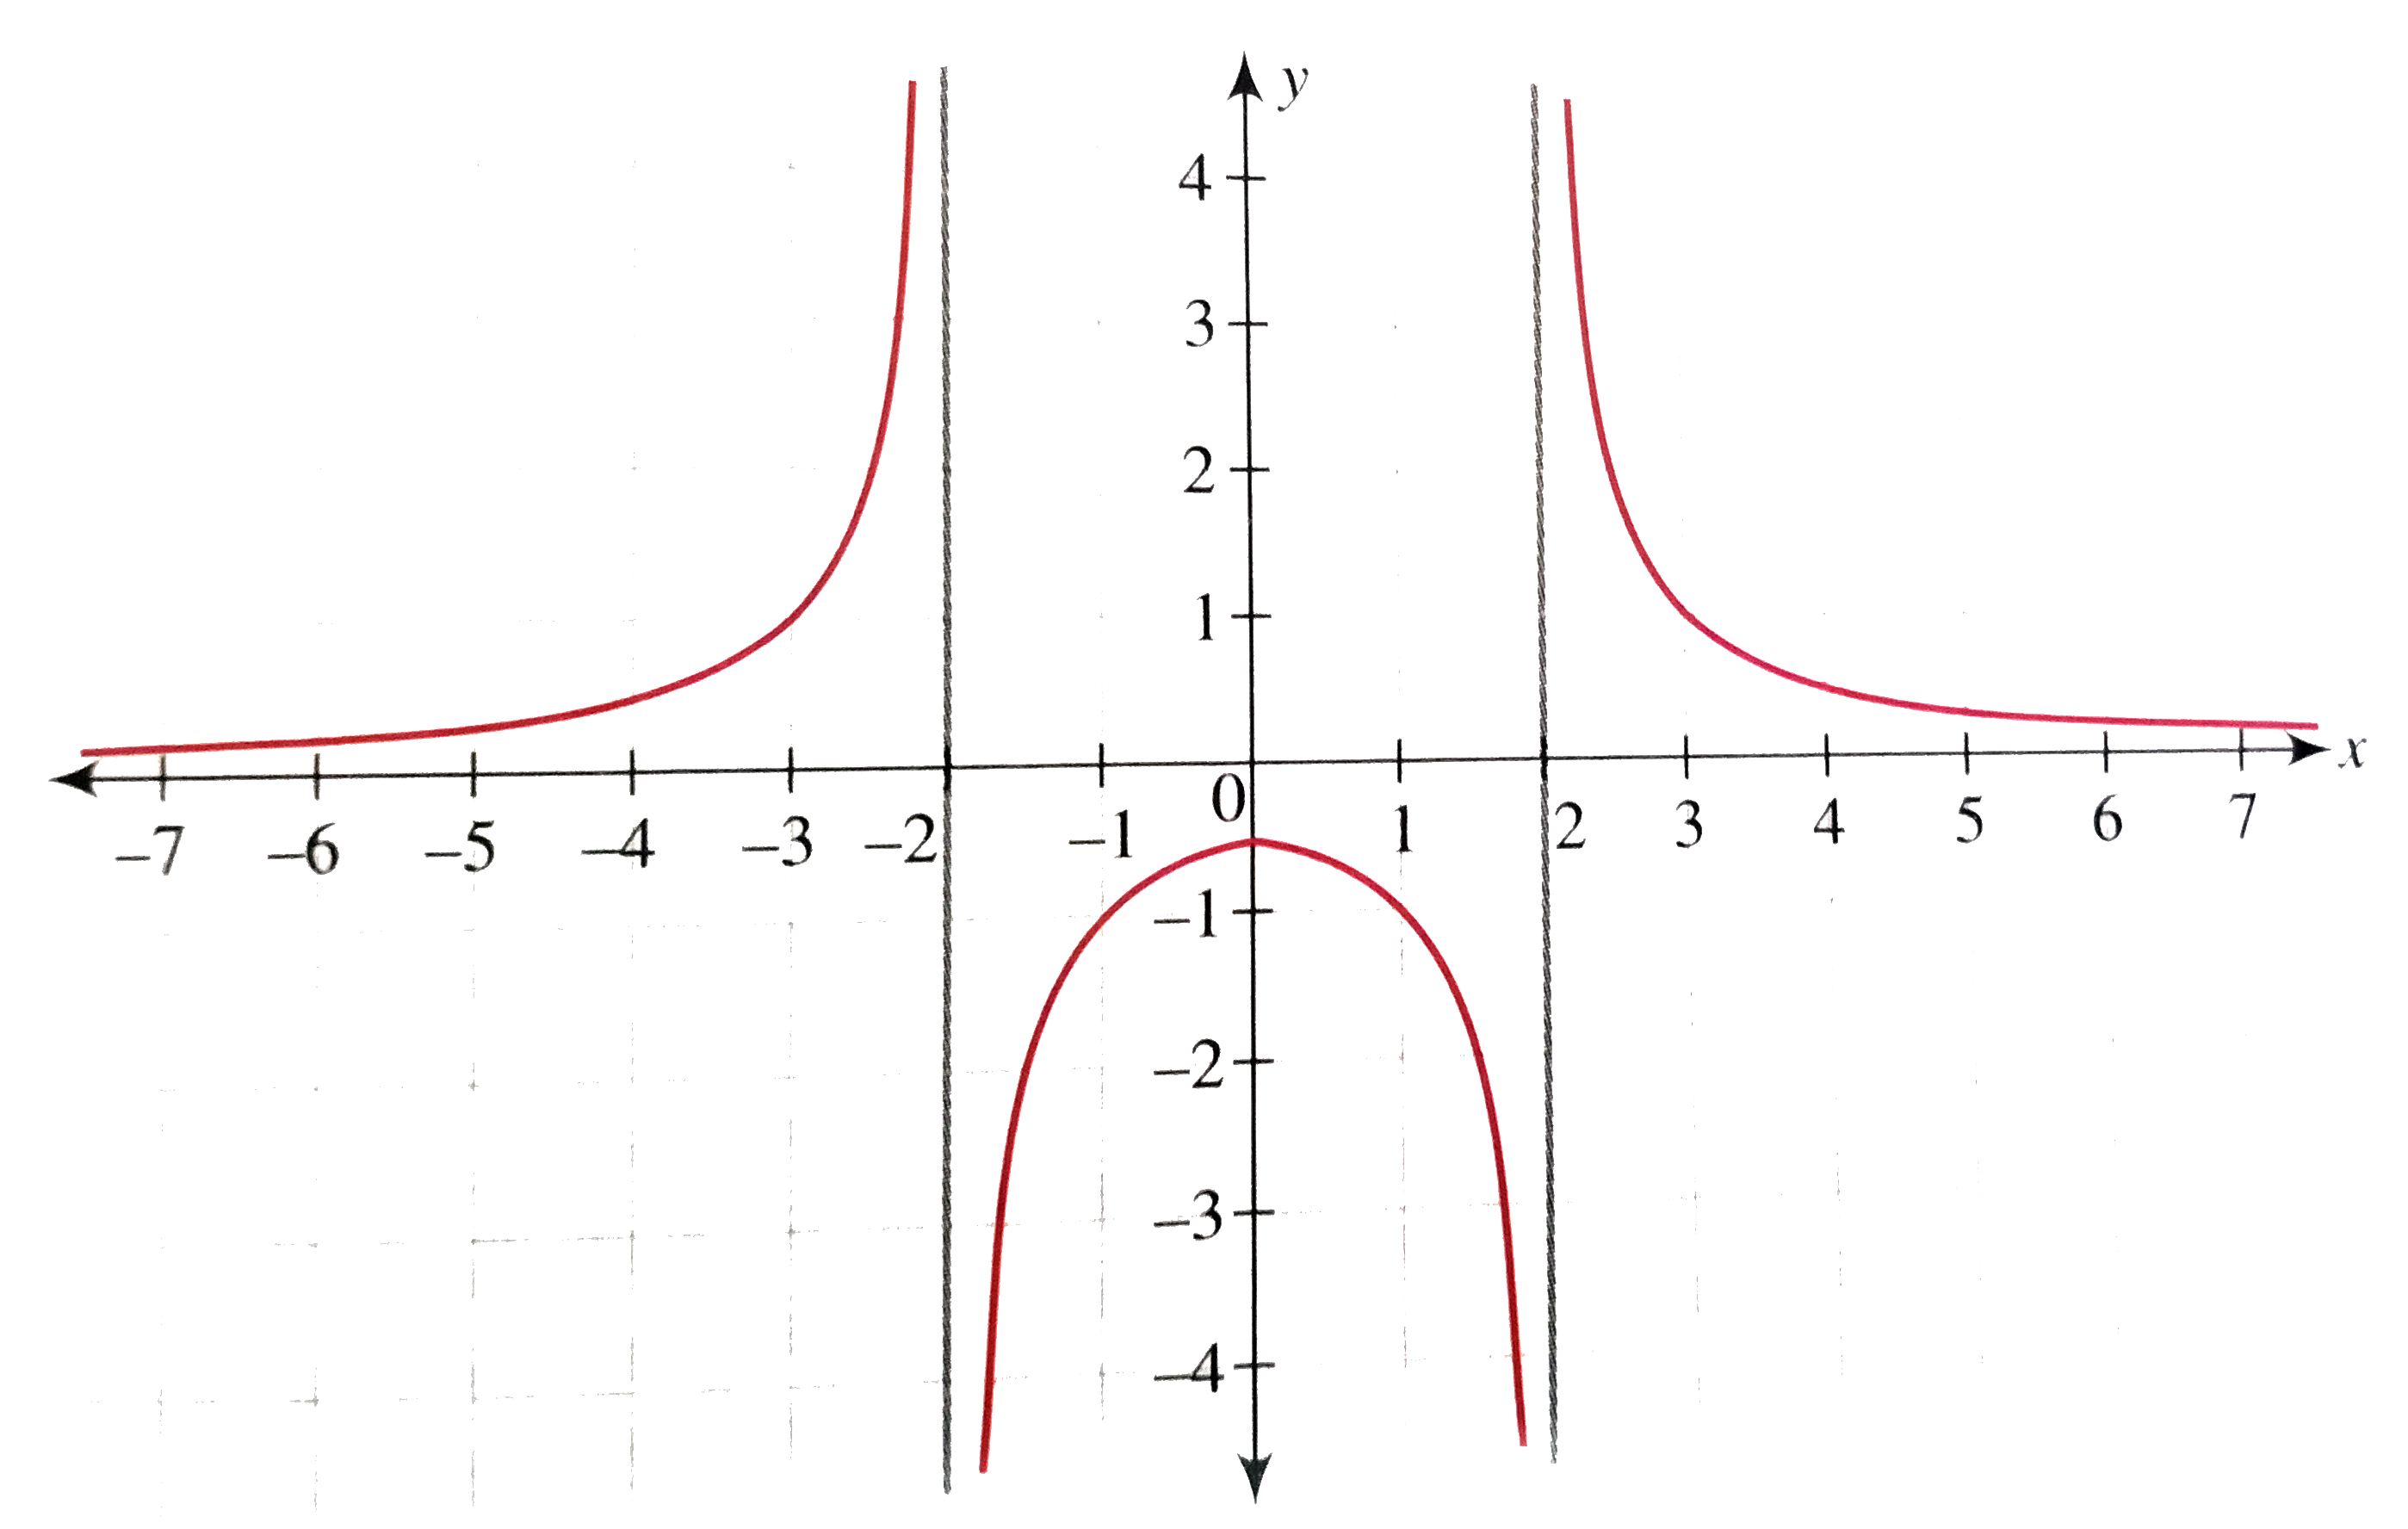
To draw the graph of y=−1|x|−2, flip the above graph over the x-axis.
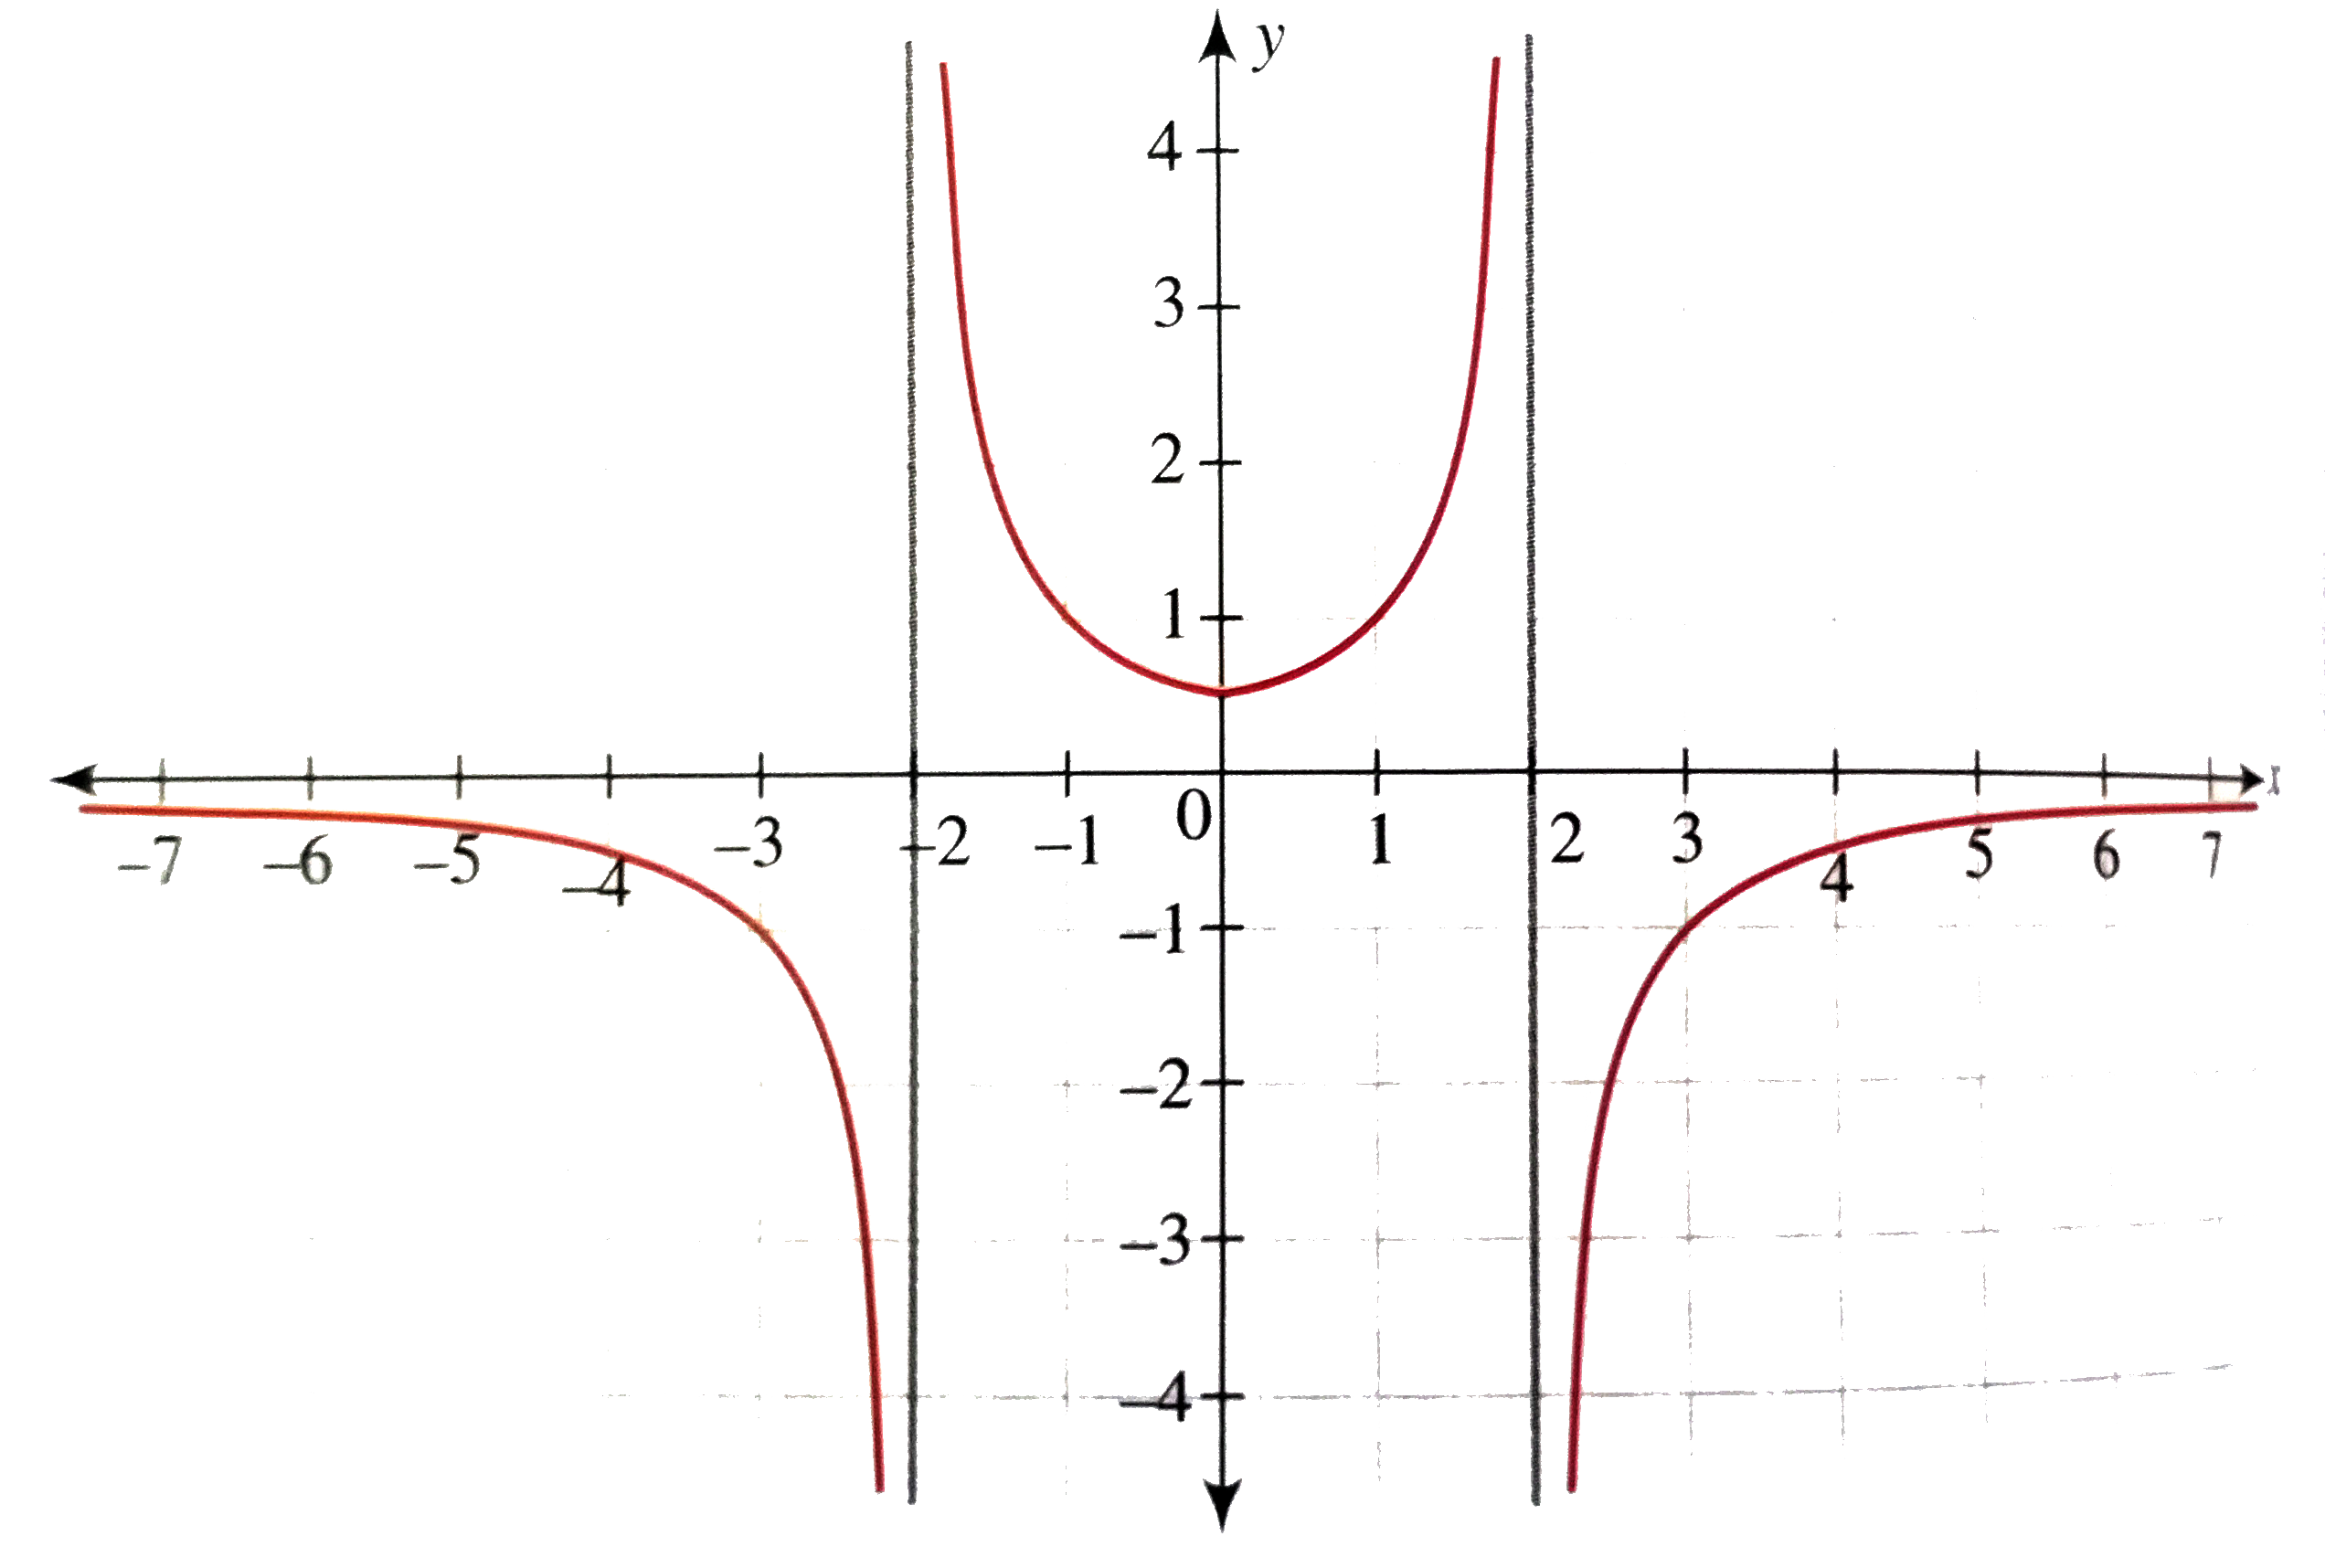
To draw graph y=1−1|x|−2, shift the above graph 1 unit upward.
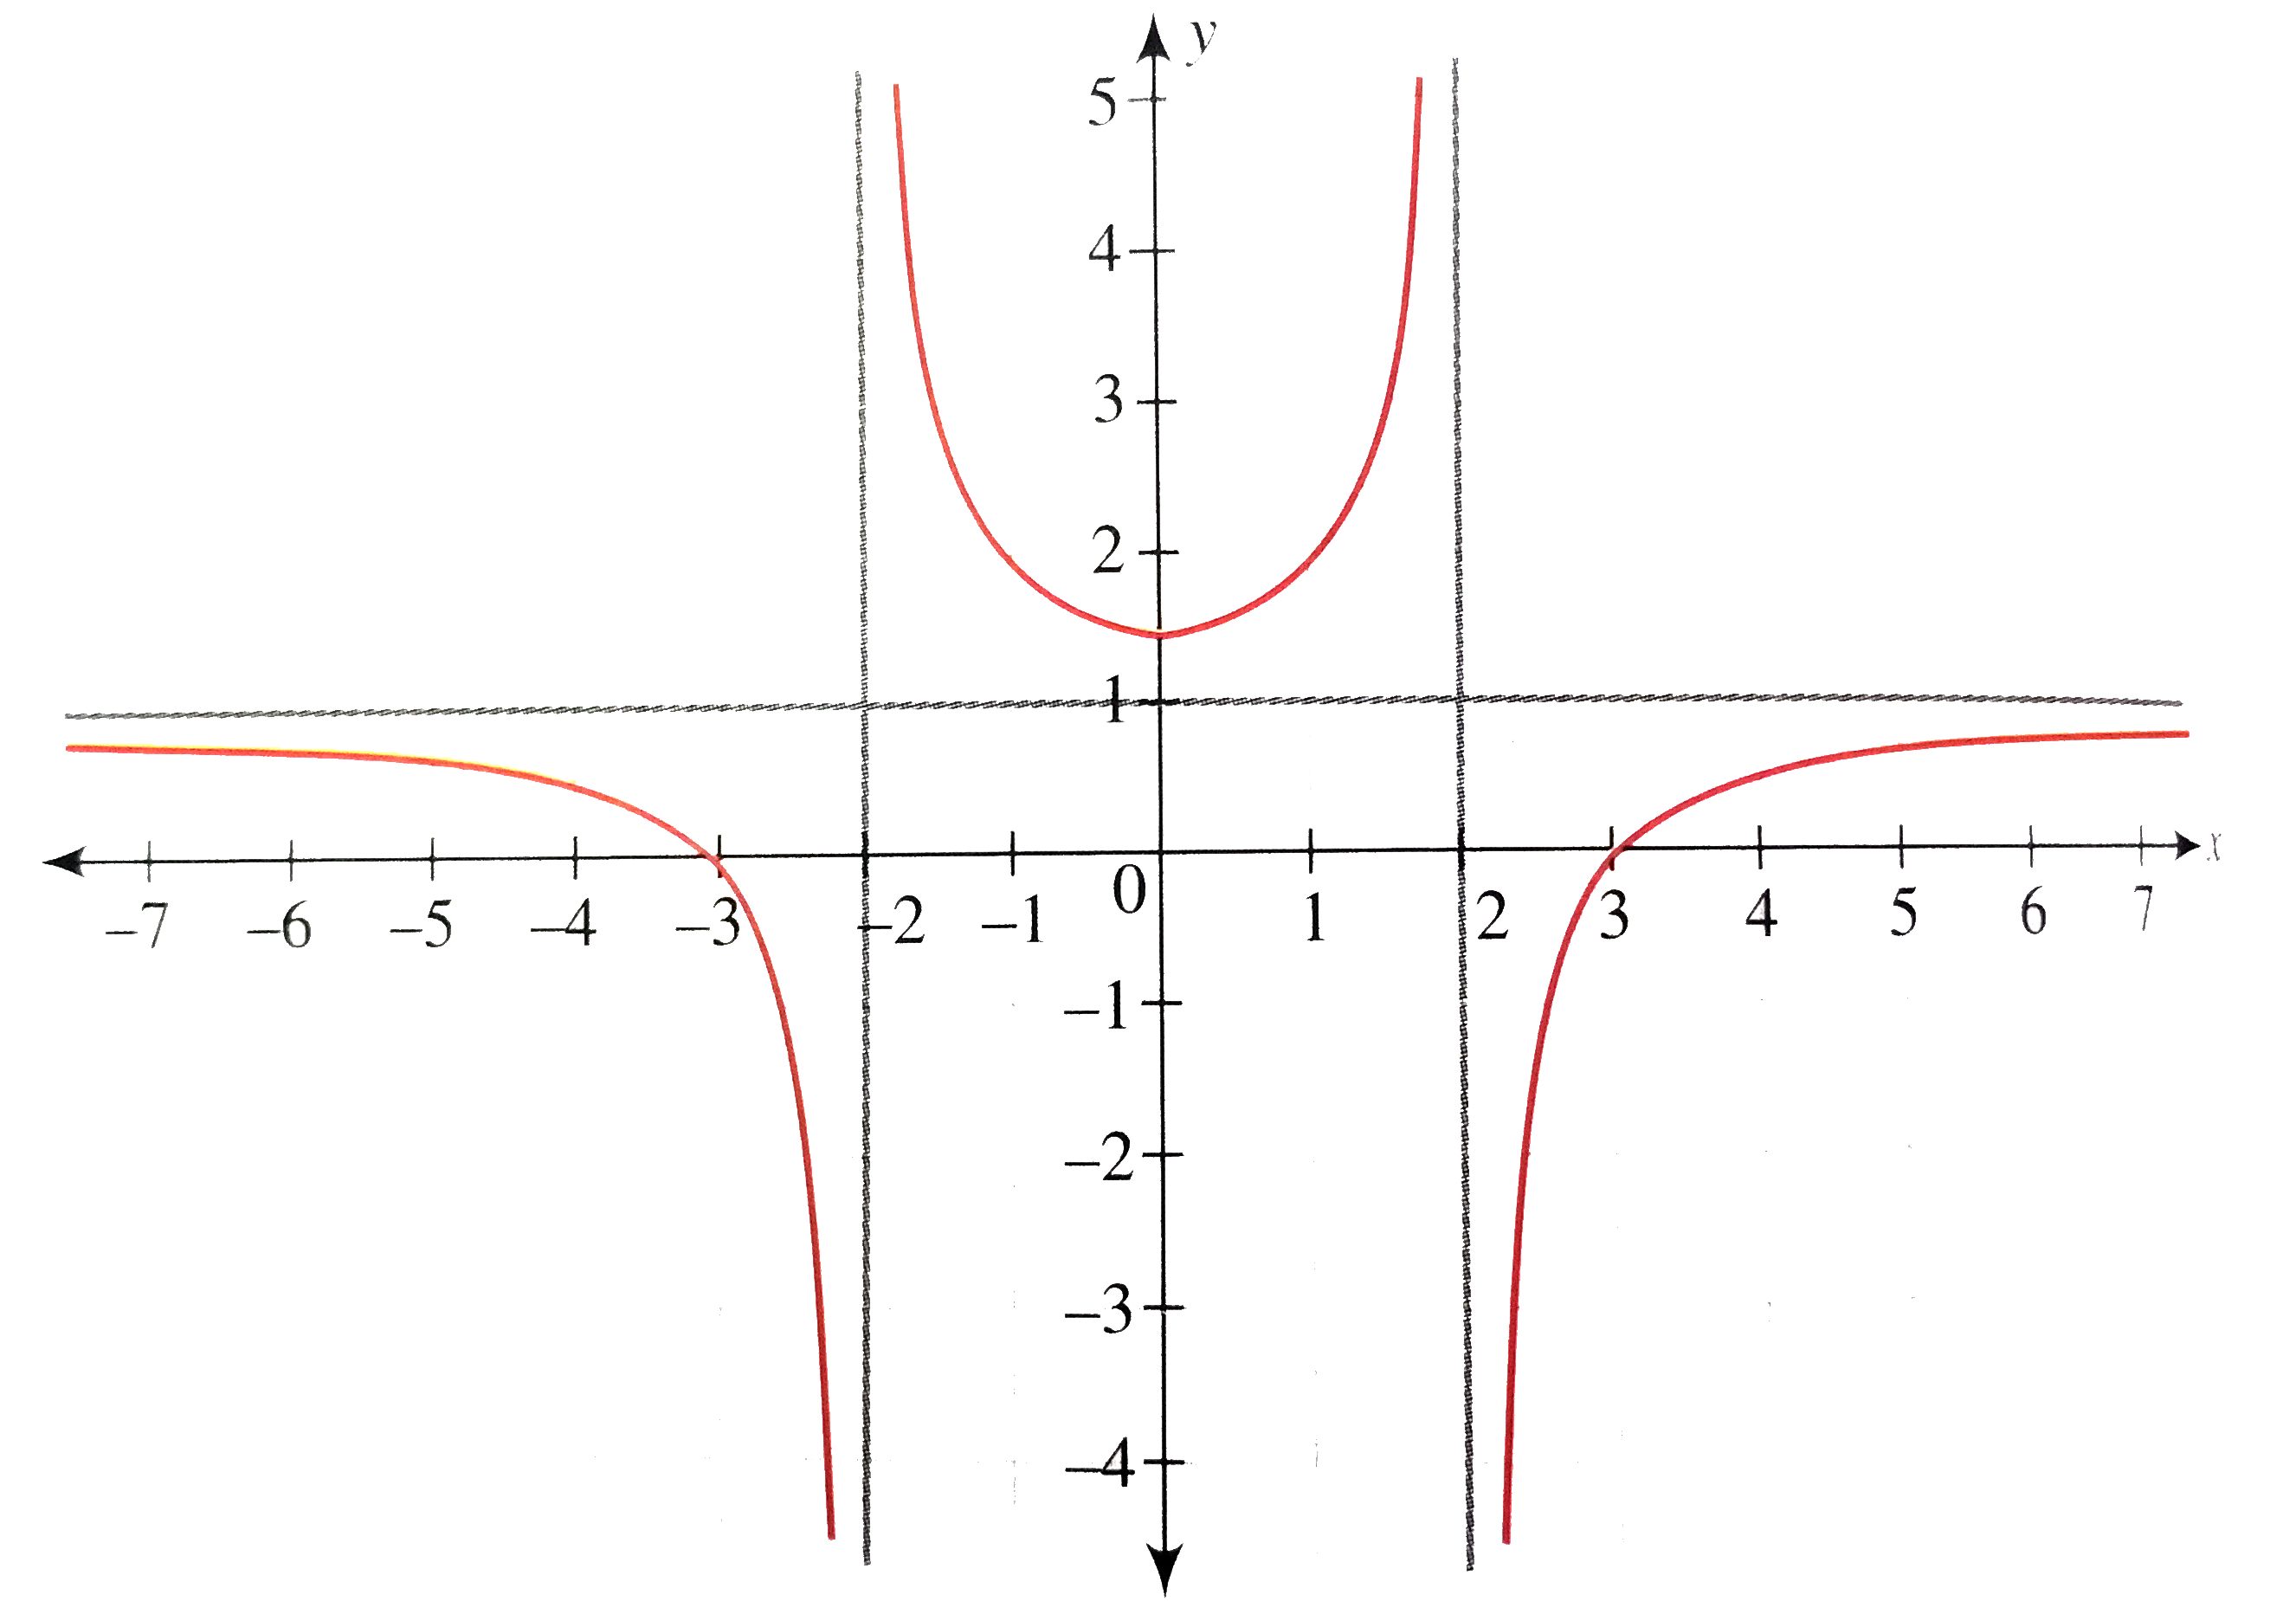
Hence the graph of y=∣∣∣1−1|x|−2∣∣∣ is as shown in the following figure.
|
Topper's Solved these Questions
Similar Questions
Draw the graph of y=∣∣∣1|x|−2∣∣∣.
View SolutionDraw the graph of y=2x−1
View SolutionDraw the graph of y=2x.
View SolutionDraw the graph of y=x+1x
View SolutionDraw the graph of y=|x|+2
View SolutionDraw the graph of y=x−1x−2.
View SolutionDraw the graph of y=2x.
View SolutionDraw the graph of y=1x+1x−2.
View SolutionDraw the graph of y=1x2.
View SolutionDraw the graph of y=2−|x−1|.
View Solution
