Draw the graph of y={|x|}, where {.} represents the fractional part function.
We have y=f(x)={|x|}
Domain of the function is R.
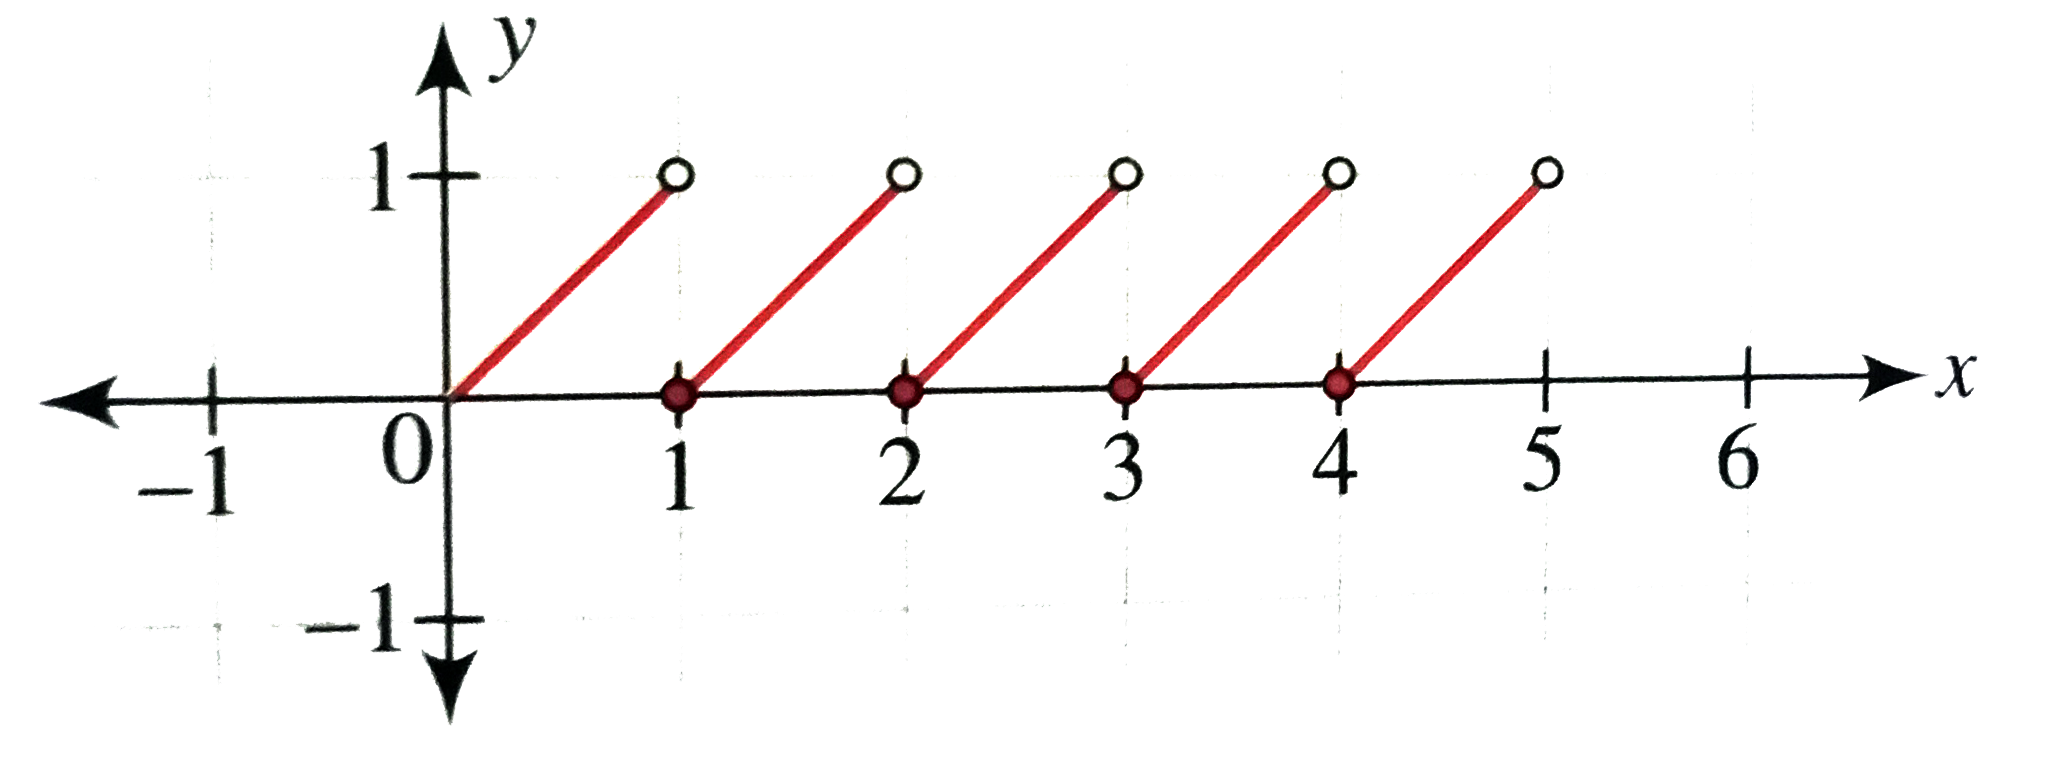
For x≥0,f(x)={x}
The graph of the above function is as follows.

To draw the graph of f(x){|x|} for x<0, we reflect the above graph in the y-axis.

Topper's Solved these Questions
Similar Questions
Draw the graph of |y|={x}, where {.} represents the fractional part function.
View SolutionDraw the graph of y2={x}, where {⋅} represents the fractional part function.
View SolutionDraw the graph of y=2{x}, where {⋅} represents the fractional part function.
View SolutionDraw the graph of y=|{x}−0.5|, where {.} represents the fractional part function.
View SolutionDraw the graph of f(x)={2x}, where {⋅} represents the fractional part function.
View SolutionDraw the graph of f(x)={sinx}, where {⋅} represents the fractional part function.
View SolutionDraw the graph of y=1{x}, where {⋅} denotes the fractional part function.
View SolutionDraw the graphs of y=sin−1{x}, where {⋅} resresent the fractional part function.
View SolutionDraw the graph of y=cos−1{x}, where {⋅} represetns the fractional part function.
View SolutionFind the range of f(x)=[sin{x}], where {} represents the fractional part function and [] represents the greatest integer function.
A. −1
B. 0
C. 1
D. 0.5
View Solution
