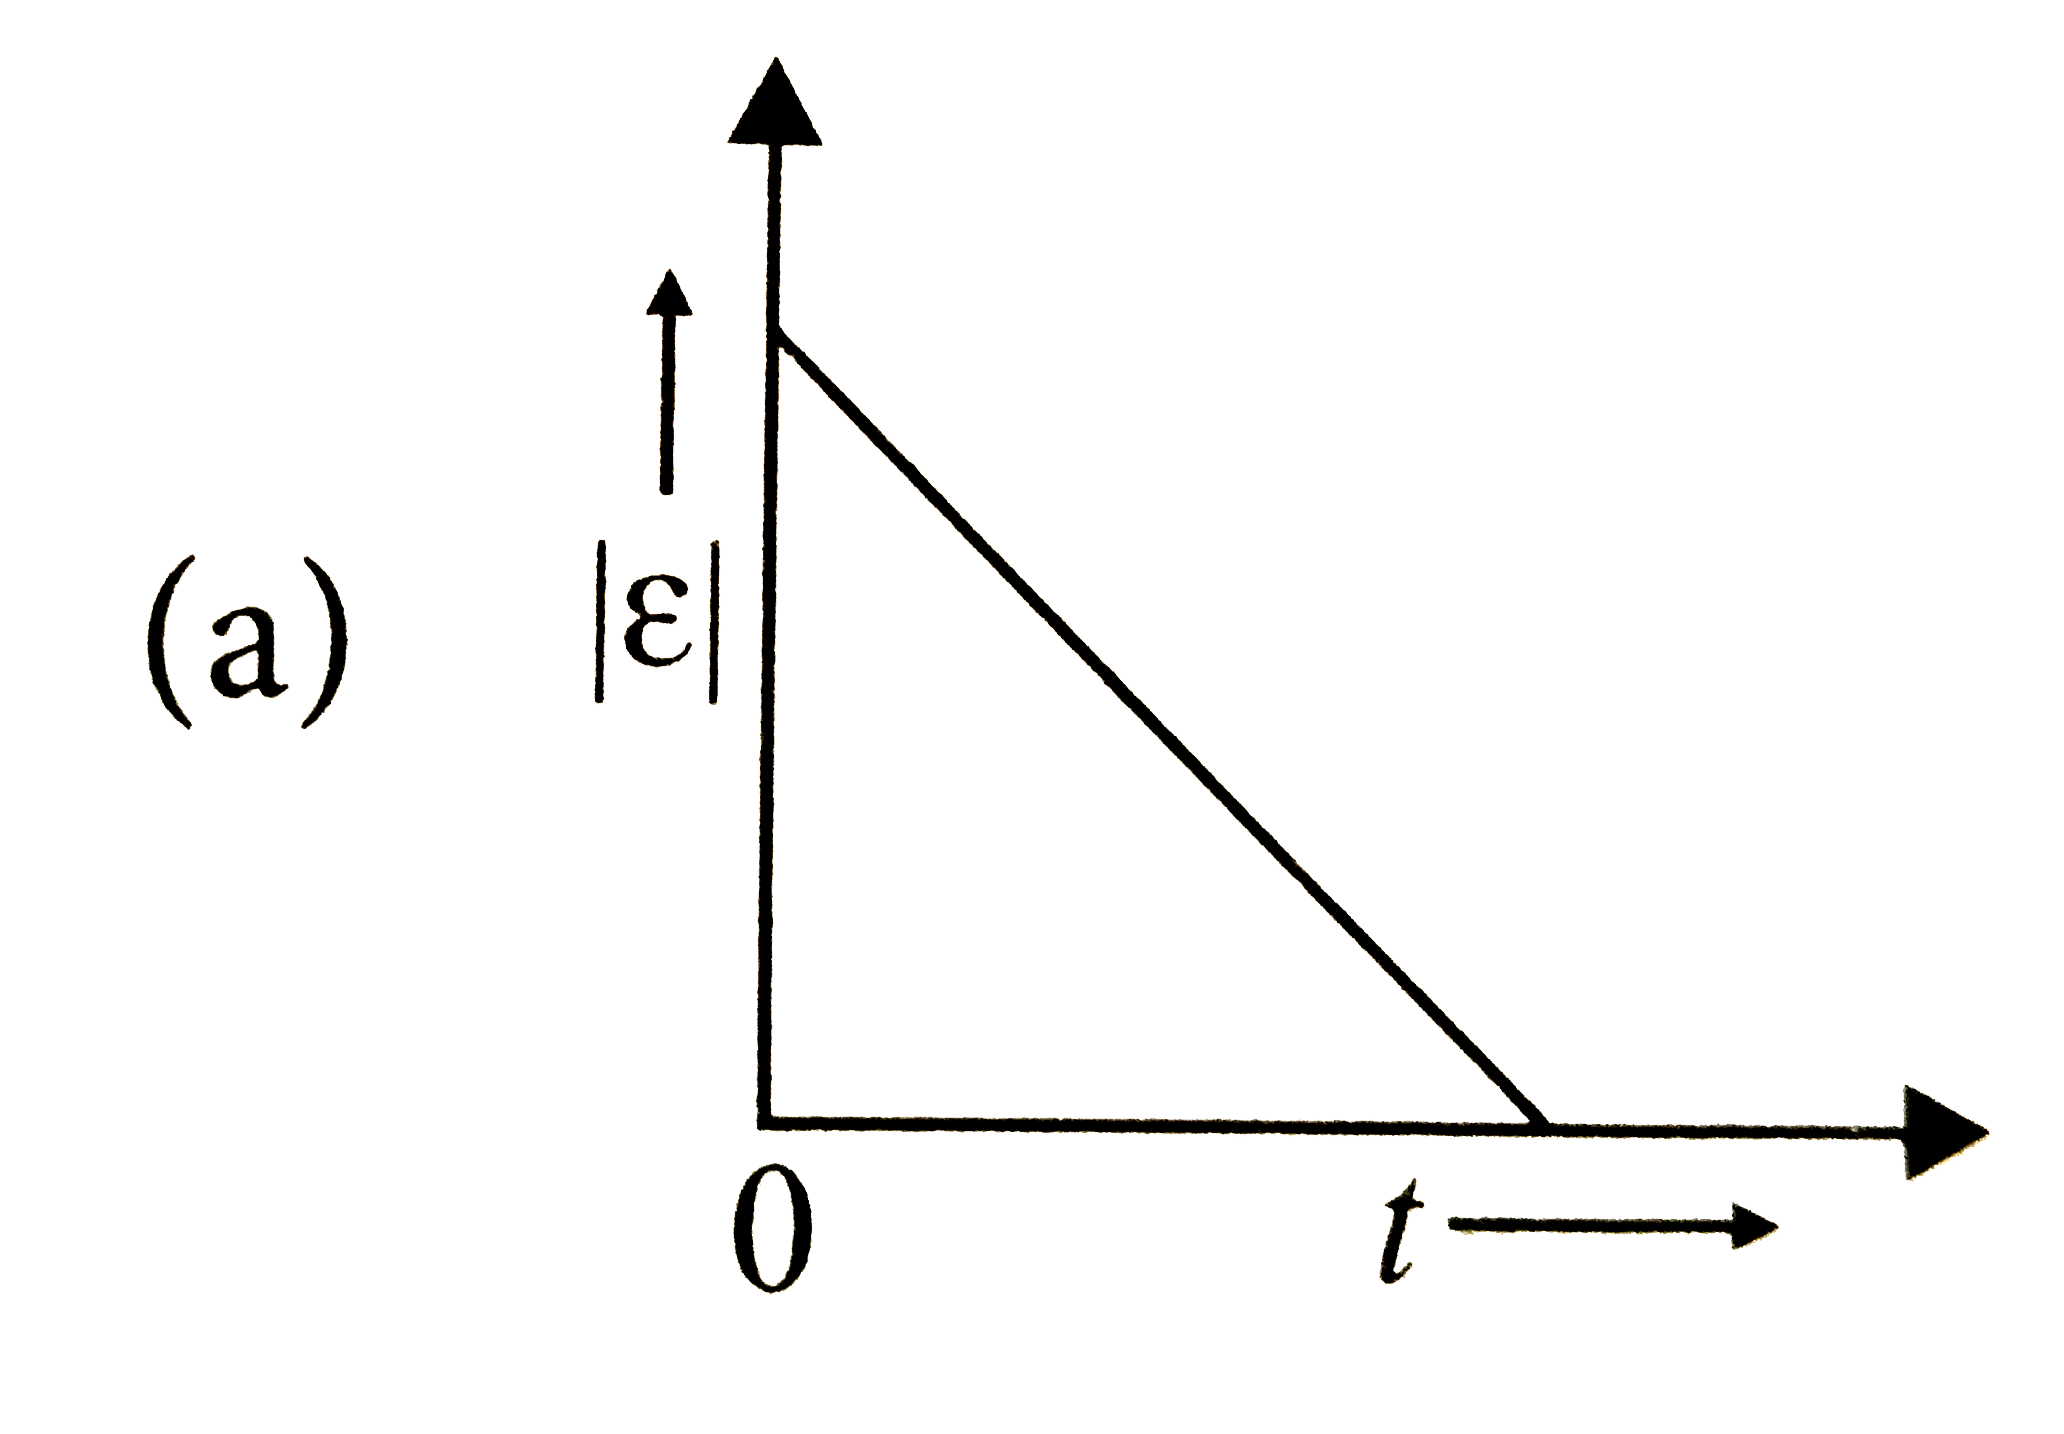
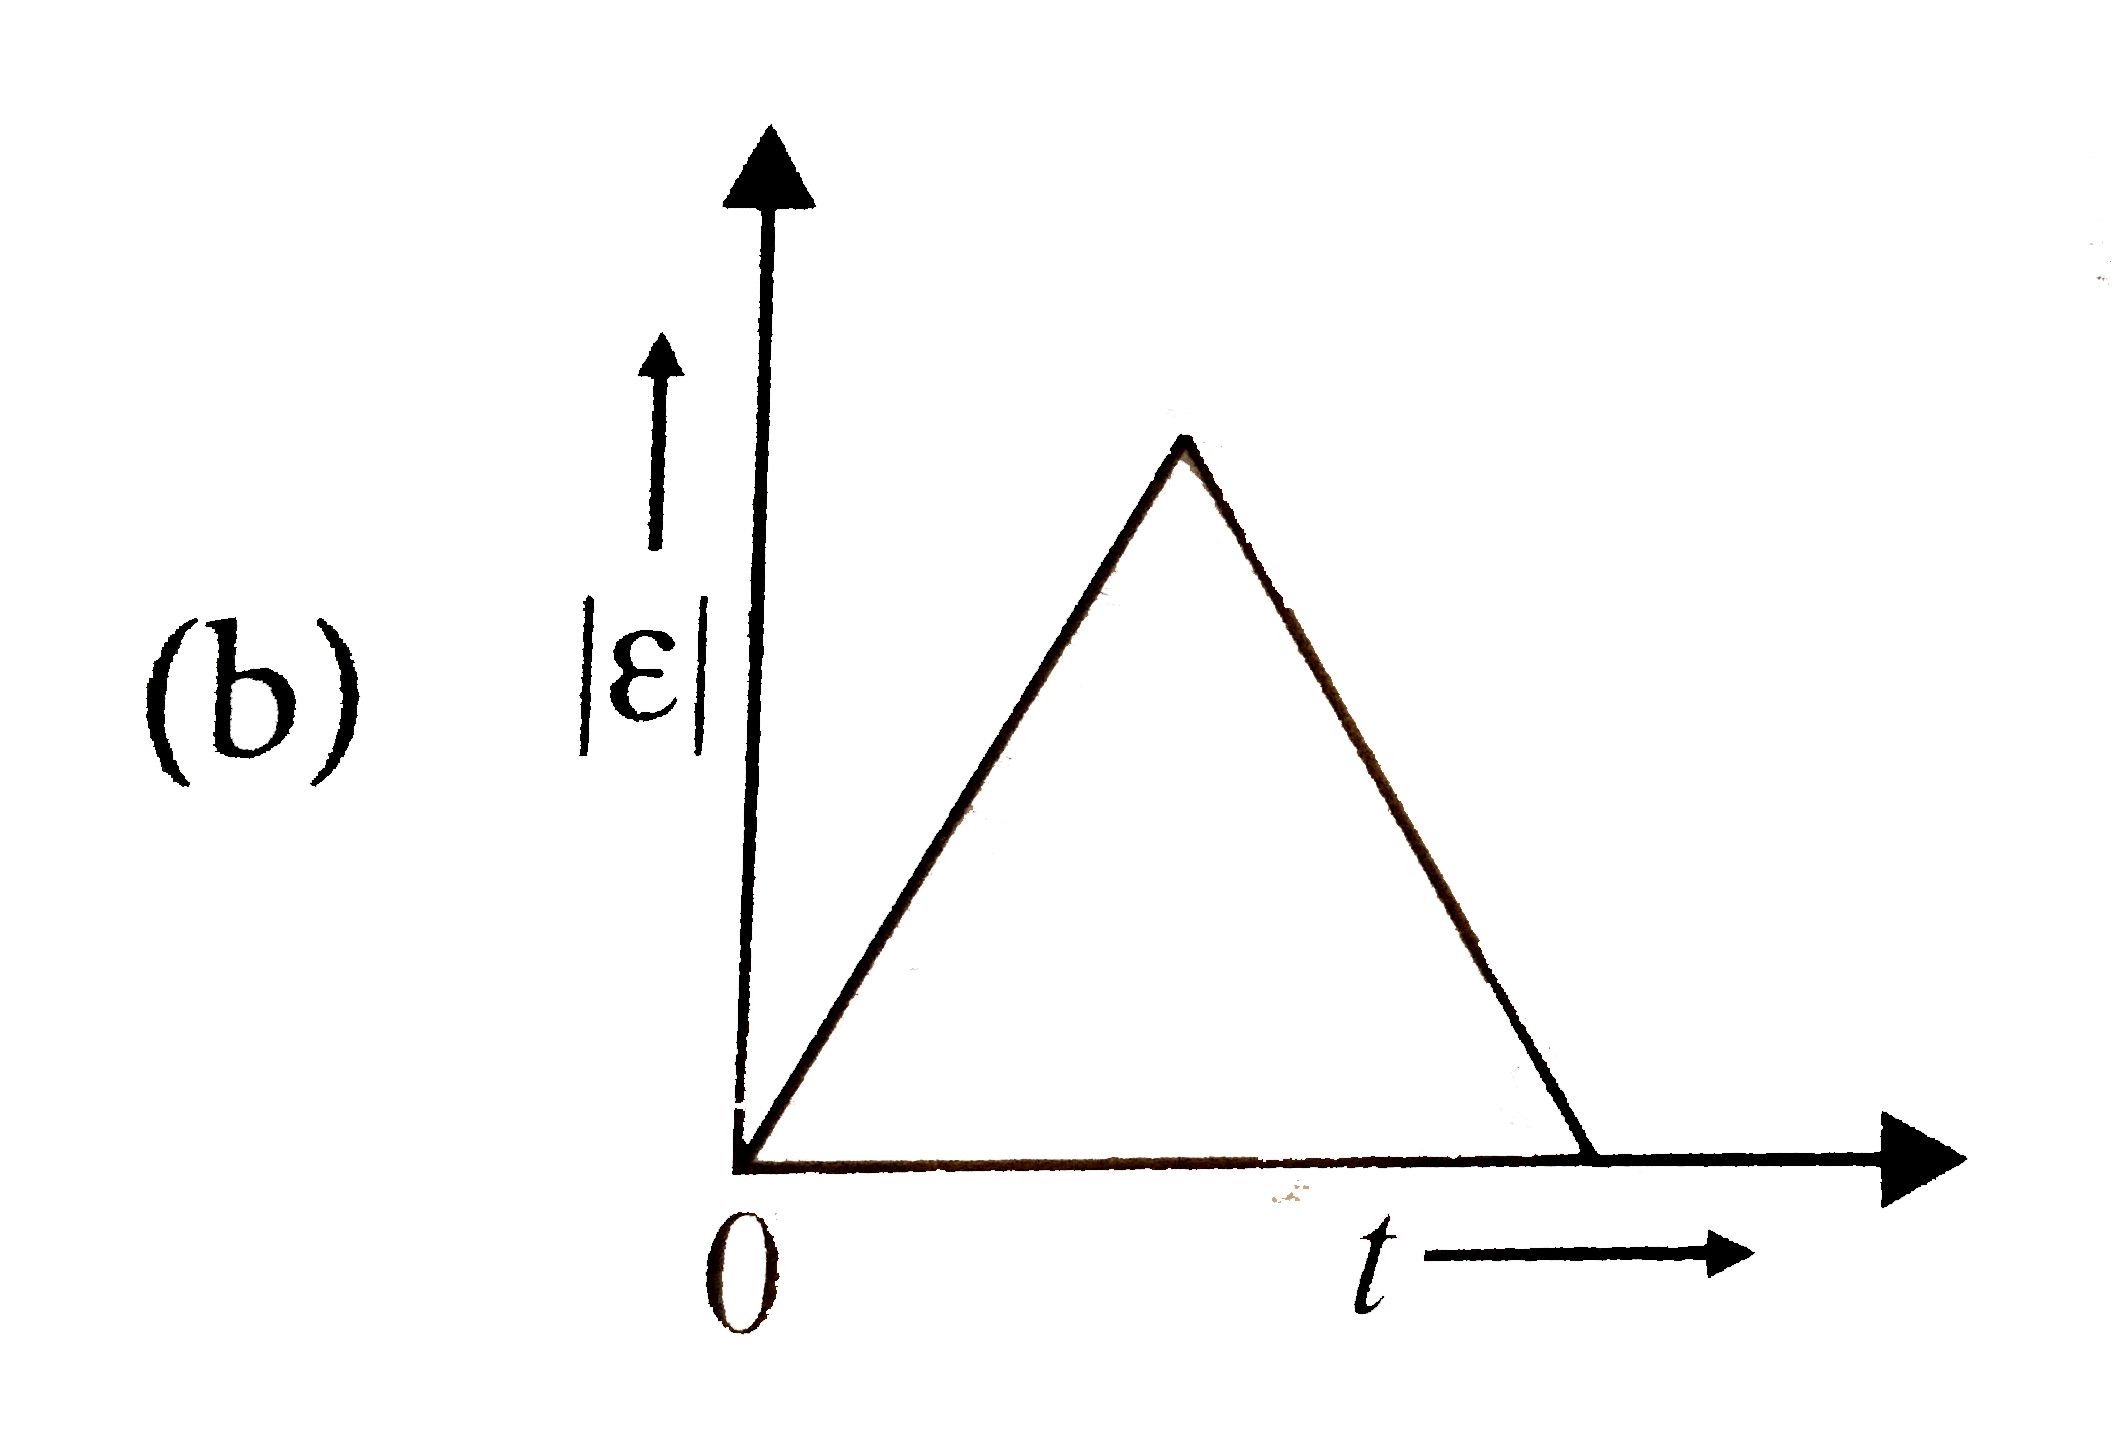
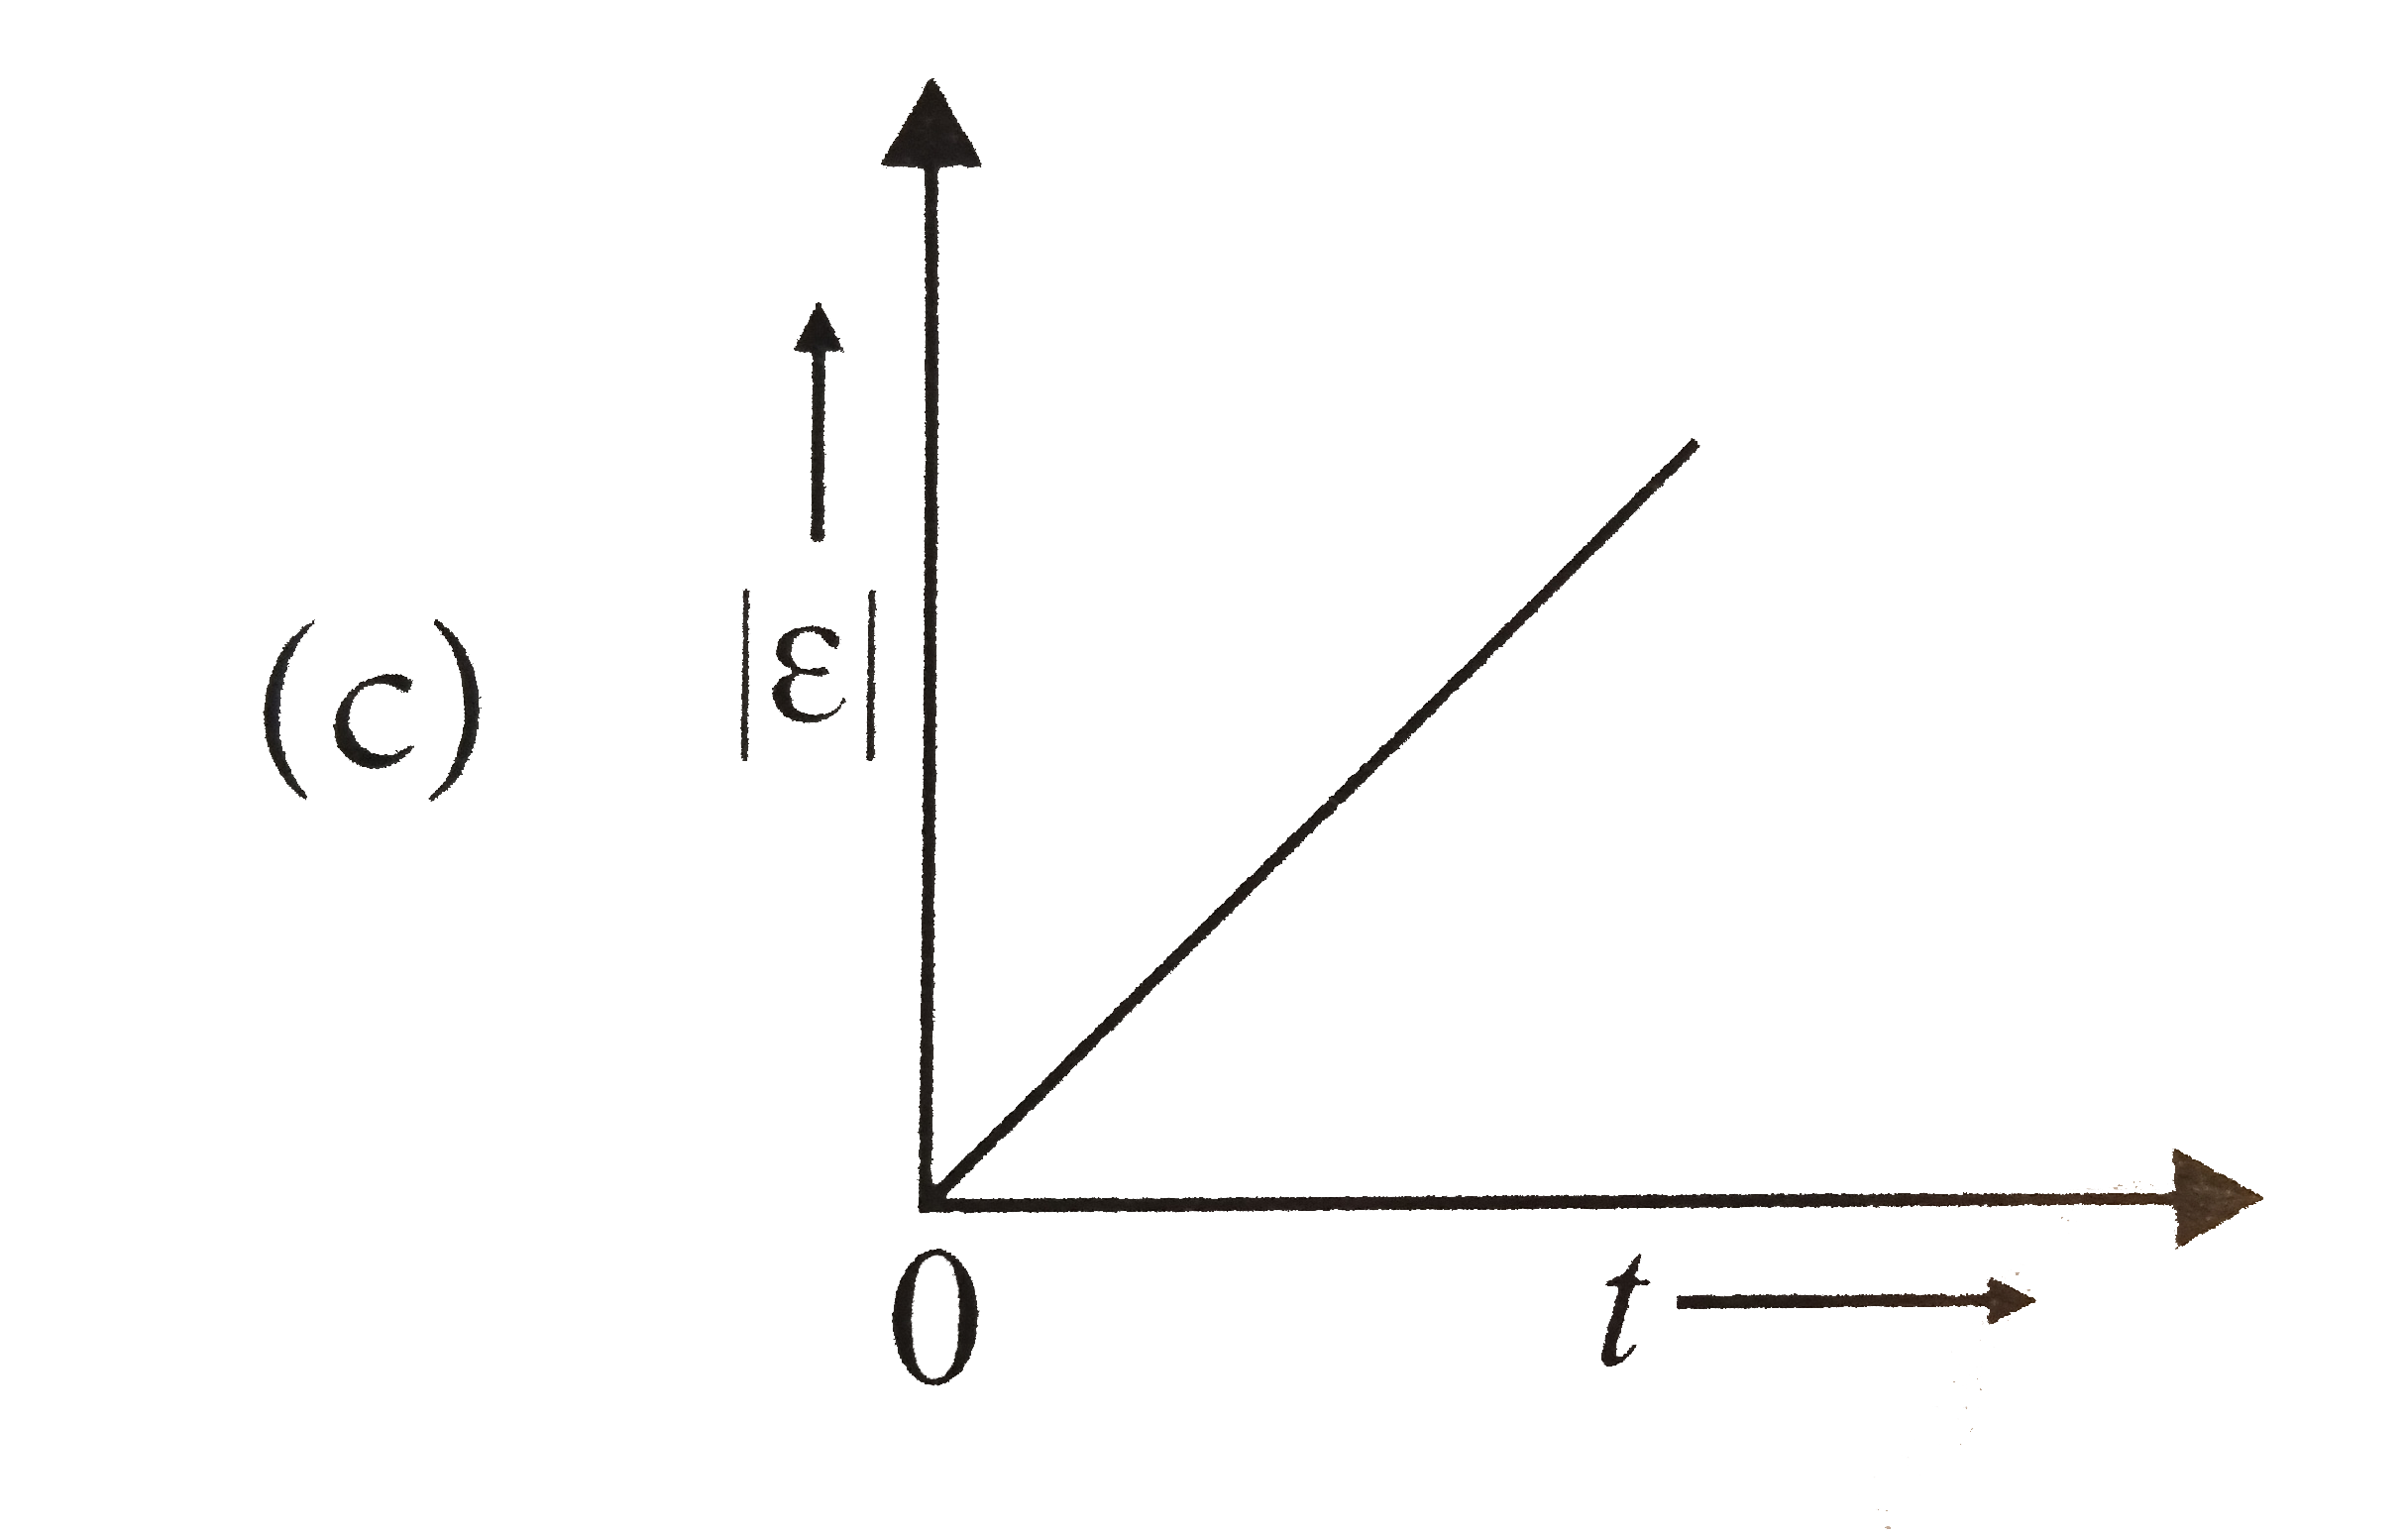
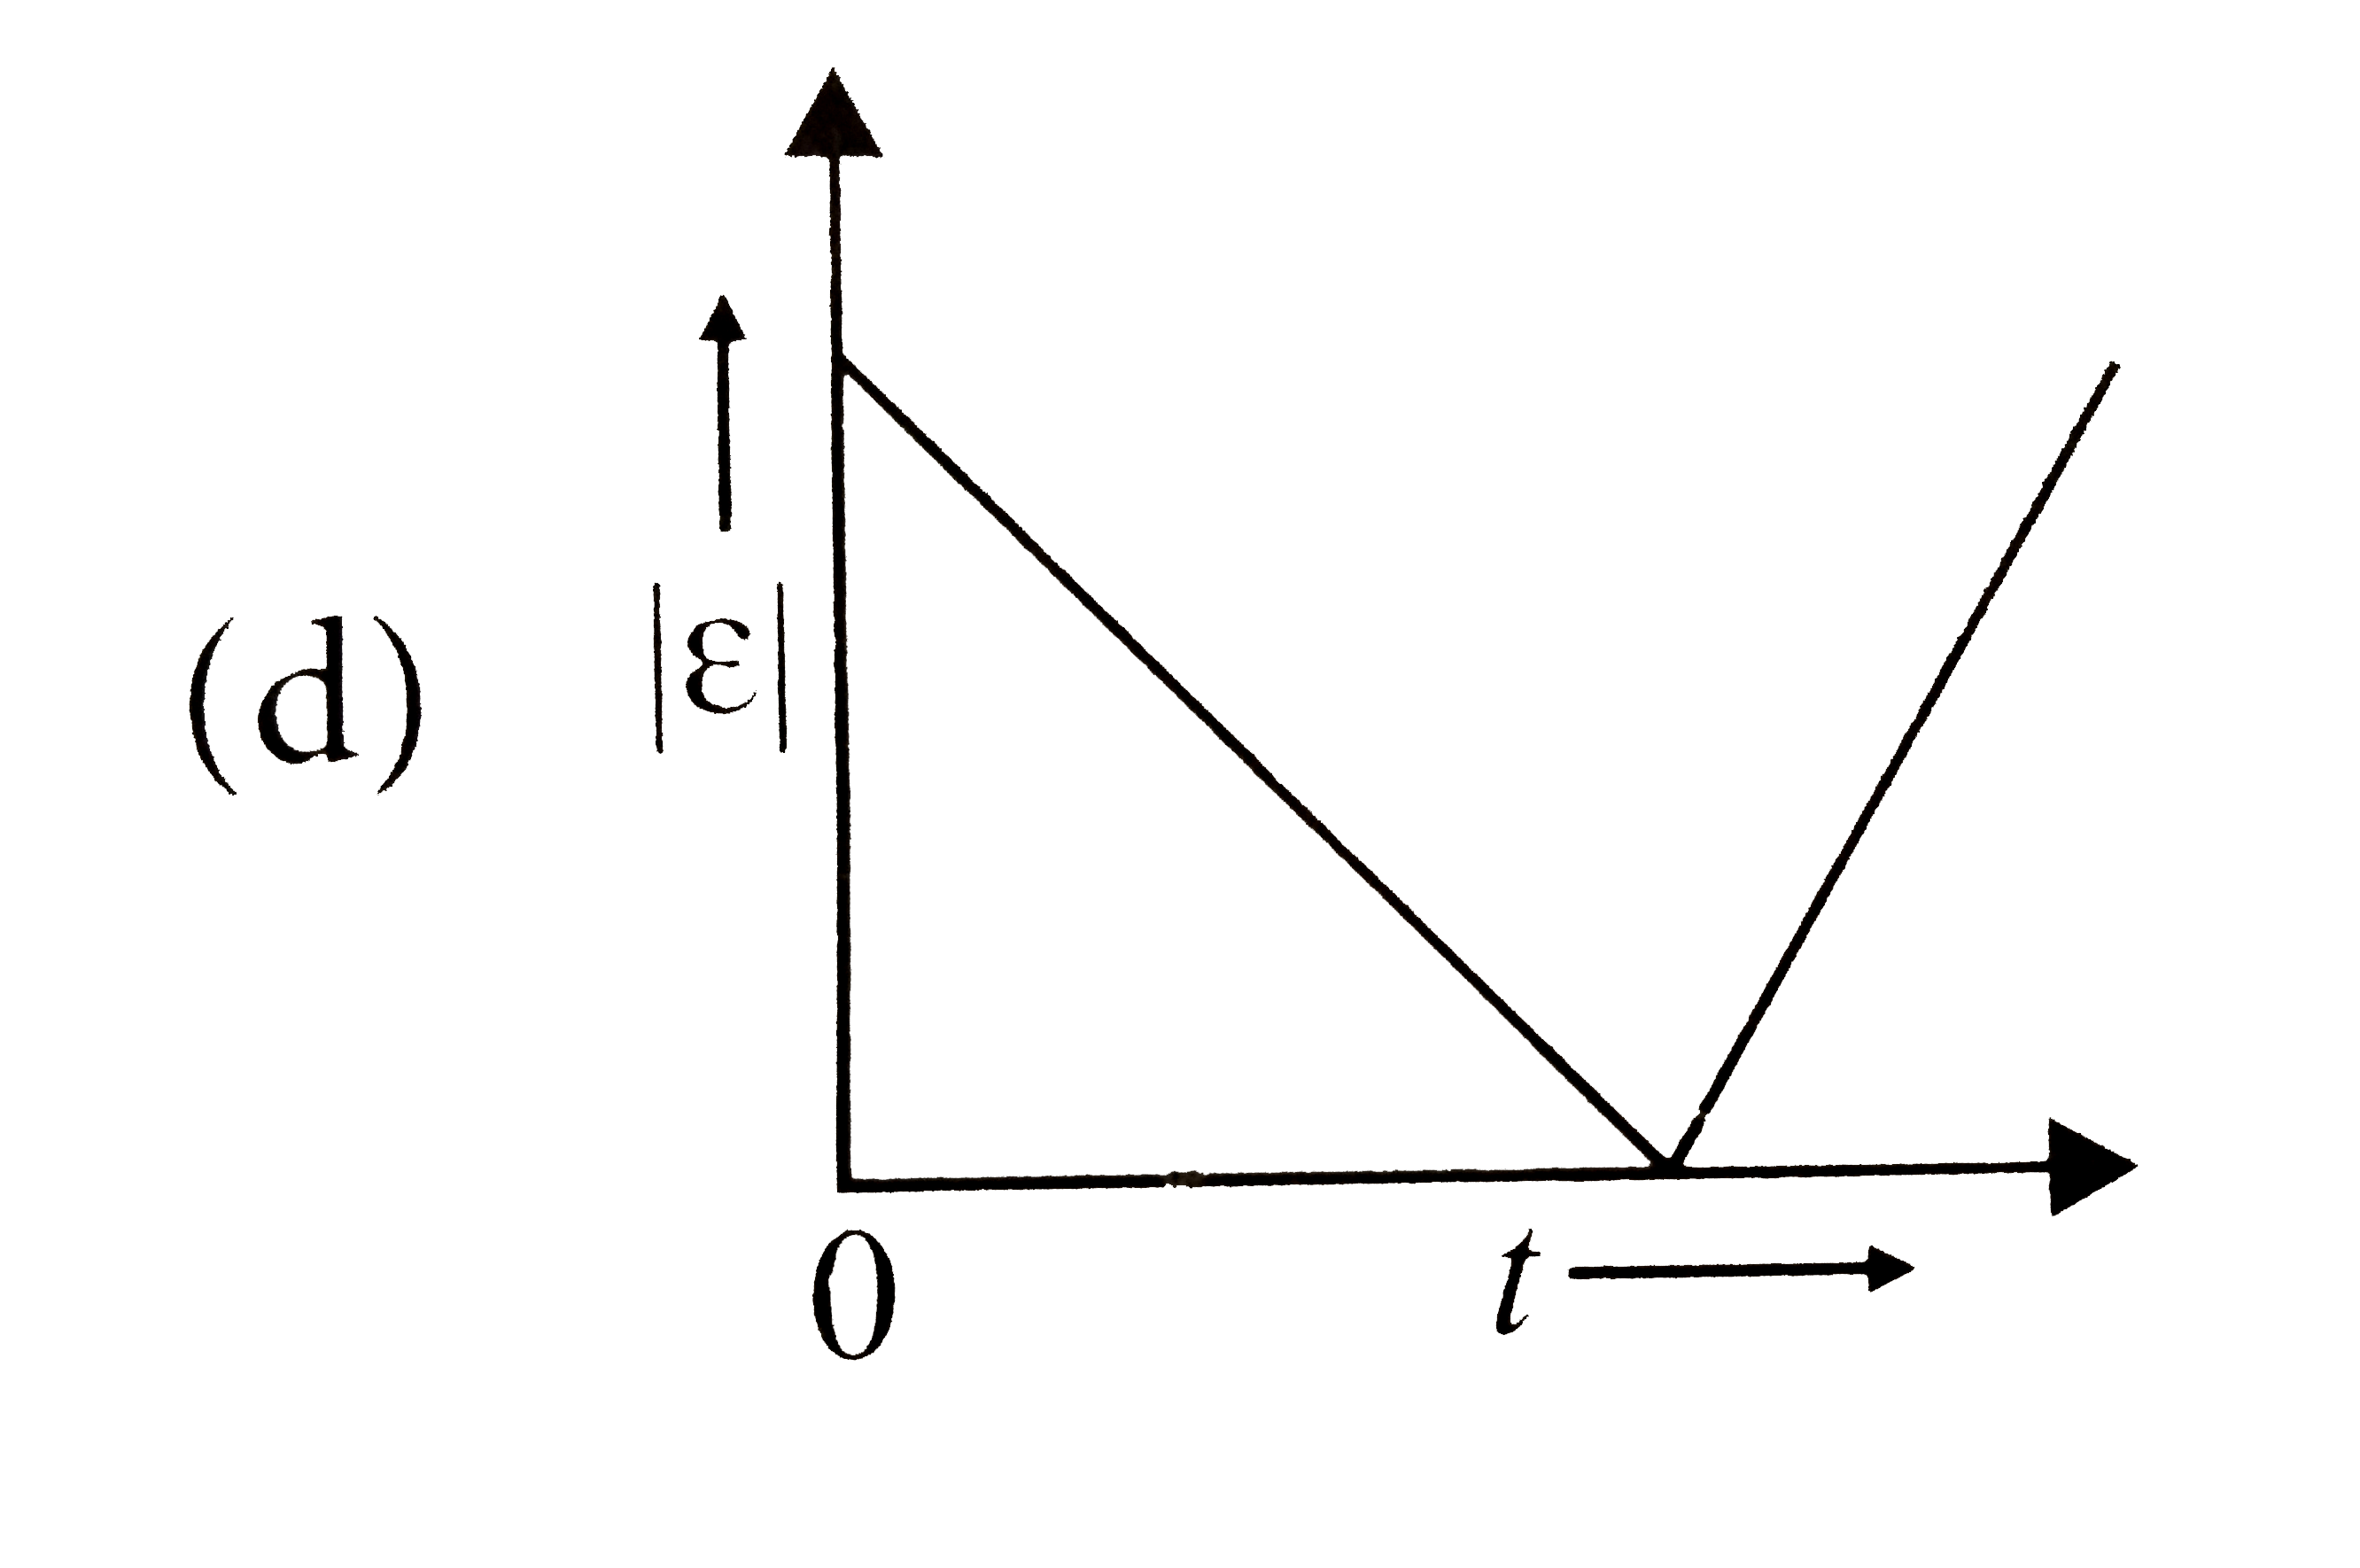
A long solenoid 'S' has 'n' turns per meter, with diameter 'a'. At the center of this coil, we place a smaller coil of 'N' turns and diameter 'b' (where b < a). If the current in the solenoid increase linearly with time, what is the induced emf appearing in the smaller coil. Plot graph showing nature of variation in emf, if current varies as a function of mt2+C.
To find the induced emf in the smaller coil placed at the center of a long solenoid, we can follow these steps:
Step 1: Understand the Problem
We have a long solenoid with 'n' turns per meter and a diameter 'a'. Inside this solenoid, there is a smaller coil with 'N' turns and diameter 'b' (where b < a). The current in the solenoid increases linearly with time, given by the equation I(t)=mt2+C.
Step 2: Determine the Magnetic Field Inside the Solenoid
The magnetic field B inside a long solenoid is given by the formula:
B=μ0nI
where μ0 is the permeability of free space, n is the number of turns per unit length, and I is the current flowing through the solenoid.
Step 3: Calculate the Rate of Change of Current
Given that the current I(t)=mt2+C, we differentiate this with respect to time t to find the rate of change of current:
dIdt=ddt(mt2+C)=2mt
Step 4: Calculate the Magnetic Flux Through the Smaller Coil
The magnetic flux Φ through the smaller coil is given by:
Φ=N⋅B⋅A
where A is the area of the smaller coil. The area A of the smaller coil is:
A=π(b2)2=πb24
Thus, the magnetic flux becomes:
Φ=N⋅B⋅πb24=N⋅(μ0nI)⋅πb24
Step 5: Substitute for Current
Substituting I(t)=mt2+C into the flux equation:
Φ=N⋅μ0n⋅(mt2+C)⋅πb24
Step 6: Calculate the Induced EMF
According to Faraday's law of electromagnetic induction, the induced emf E in the smaller coil is given by:
E=−dΦdt
Differentiating the flux with respect to time:
dΦdt=N⋅μ0n⋅πb24⋅dIdt
Substituting dIdt=2mt:
dΦdt=N⋅μ0n⋅πb24⋅(2mt)
Thus,
E=−N⋅μ0n⋅πb24⋅(2mt)
This simplifies to:
E=−Nμ0nπb2m2⋅t
Step 7: Plot the Graph
The induced emf E is proportional to time t, so we can plot |E| against t:
- The y-axis represents the magnitude of the induced emf |E|.
- The x-axis represents time t.
- The graph will be a straight line passing through the origin with a slope of Nμ0nπb2m2.
Summary of the Induced EMF
The induced emf in the smaller coil is given by:
E=−Nμ0nπb2m2⋅t
We have a long solenoid with 'n' turns per meter and a diameter 'a'. Inside this solenoid, there is a smaller coil with 'N' turns and diameter 'b' (where b < a). The current in the solenoid increases linearly with time, given by the equation I(t)=mt2+C.
The magnetic field B inside a long solenoid is given by the formula:
B=μ0nI
where μ0 is the permeability of free space, n is the number of turns per unit length, and I is the current flowing through the solenoid.
Given that the current I(t)=mt2+C, we differentiate this with respect to time t to find the rate of change of current:
dIdt=ddt(mt2+C)=2mt
The magnetic flux Φ through the smaller coil is given by:
Φ=N⋅B⋅A
where A is the area of the smaller coil. The area A of the smaller coil is:
A=π(b2)2=πb24
Thus, the magnetic flux becomes:
Φ=N⋅B⋅πb24=N⋅(μ0nI)⋅πb24
Substituting I(t)=mt2+C into the flux equation:
Φ=N⋅μ0n⋅(mt2+C)⋅πb24
According to Faraday's law of electromagnetic induction, the induced emf E in the smaller coil is given by:
E=−dΦdt
Differentiating the flux with respect to time:
dΦdt=N⋅μ0n⋅πb24⋅dIdt
Substituting dIdt=2mt:
dΦdt=N⋅μ0n⋅πb24⋅(2mt)
Thus,
E=−N⋅μ0n⋅πb24⋅(2mt)
This simplifies to:
E=−Nμ0nπb2m2⋅t
The induced emf E is proportional to time t, so we can plot |E| against t:
- The y-axis represents the magnitude of the induced emf |E|.
- The x-axis represents time t.
- The graph will be a straight line passing through the origin with a slope of Nμ0nπb2m2.
The induced emf in the smaller coil is given by:
E=−Nμ0nπb2m2⋅t
Topper's Solved these Questions
- ELECTROMAGNETIC INDUCTION Book:NCERT EXEMPLAR ENGLISHChapter:ELECTROMAGNETIC INDUCTION Exercise:Short answer type questions
Explore 5 Videos
- ELECTRIC CHARGES AND FIELDBook:NCERT EXEMPLAR ENGLISHChapter:ELECTRIC CHARGES AND FIELDExercise:Long Answer Type Question
Explore 6 Videos
- ELECTROMAGNETIC WAVESBook:NCERT EXEMPLAR ENGLISHChapter:ELECTROMAGNETIC WAVESExercise:LONG ANSWER
Explore 5 Videos
Similar Questions
A long solenoid having 200 turns per centimeter carries a current of 1.5A. At the center of the solenoid is placed a coil of 100 turns of cross-sectional area 3.14×10⁻⁴m2 having its axis parallel to the field produced by the solenoid. When the direction of current in teh solenoid is reversed within 0.05s, the induced emf in the coil is
View SolutionA long solenoid of diameter 0.1m has 2×10⁴ turns per metre. At the centre of the solenoid, a 100−turns coil of radius 0.01m is placed with its axis coinciding with the constant rate from +2A to 2A in 0.05s. Find the total charge (in μC) flowing through the coil during this time when the resistance of the coil is 40≠2Ω.
View Solution
Knowledge Check
A long solenoid 'S' has 'n' turns per meter, with diameter 'a'. At the centre of this coil, we place a smallar coil of 'N' tunrs and diameter 'b' (where b lt a). If the current in the solenoid increase linearly with time, what is the induced emf apperaing in the smaller coil. Plot graph showing nature of variation in emf, if current varies as a function of mt2+C.
A B
B C
C D
D
If 'N' is the number of turns in a coil, the value of self inductance varies as
AN0BNCN2DN−2
An ideal solenoid of cross-sectional area 10−4m2 has 500 turns per metre. At the centre of this solenoid, another coil of 100 turns is wrapped closely around it. If the current in the coil changes from 0 to 2 A in 3.14 ms, the emf developed in the second coil is
View SolutionThrough a long solenoid of diameter 4.1 cm, having 100 turns per cm, a current I = 1A is flowing. At its centre, a 60 turns closely packed coil of diameter 3.1 cm si placed such that the coil is coaxial with the long solenoid. The current in the solenoid is reduced to zero at a steady rate in 10 ms. What is the magnitude of emf induced in the coil while the current in the solenoid is changing?
View SolutionA long solenoid of diameter 0.1 m has 2×10⁴ turns per meter. At centre of the solenoid is 100 turns coil of radius 0.01 m placed with its axis coinciding with solenoid axis. The current in the solenoid reduce at a constant rate to 0A from 4 a in 0.05 s . If the resistance of the coil is 10π2Ω, the total charge flowing through the coil during this time is
View SolutionIf 'N' is the number of turns in a coil, the value of self inductance varies as
View SolutionThe current in a long solenoid of radius R and having n turns per unit length is given by i=i0sinωt. A coil having N turns is wound around it near the centre. Find (a) the induced emf in the coil and (b) the mutual inductance between the solenoid and the coil.
View SolutionFind the magnetic intensity H at the centre of a long solenoid having n turns per unit length and carrying a current i (a) when no material is kept in it and (b) when a long copper rod is inserted in the solenoid.
View Solution

