A (current vs time) graph of the current passing through a solenoid is shown in Fig. For which time is the back electromotive force (u) a maximum? If the back emf t = 3 s is e, find the back emf at t = 7 s, 15 s and 40 s OA, AB and BC are straight line segments. 
The back electromotive force in solenoid is (u) a maximum when there is maximum rate of change of current. This occurs is in AB part of the graph. So maximum back emf will be obtained between 5s<t<10s.
Since the back emf at t= 3s is e,
Also,
the rate of change of current at t=3,s= slope of OA from t=0s to t=5s=1/5A/s.
So, we have
If u=L1/5(fort=3s,dIdt=1/5) (L is a constant). Applying ε=−LdIdt
Similarly, we have for other values
For 5s<t<10s
u1=−L35=−35L=−3e
Thus, at t=7s,u1=−3e
For 10s<t<30s
u−2=L220=L10=12e
For t>30s,u2=0
Thus, the back emf at t=7s,15s and 30s are −3e,e/2 and 0 respectively .
Topper's Solved these Questions
- ELECTROMAGNETIC INDUCTION Book:NCERT EXEMPLAR ENGLISHChapter:ELECTROMAGNETIC INDUCTION Exercise:Long
Explore 11 Videos
- ELECTROMAGNETIC INDUCTION Book:NCERT EXEMPLAR ENGLISHChapter:ELECTROMAGNETIC INDUCTION Exercise:very short answer
Explore 6 Videos
- ELECTRIC CHARGES AND FIELDBook:NCERT EXEMPLAR ENGLISHChapter:ELECTRIC CHARGES AND FIELDExercise:Long Answer Type Question
Explore 6 Videos
- ELECTROMAGNETIC WAVESBook:NCERT EXEMPLAR ENGLISHChapter:ELECTROMAGNETIC WAVESExercise:LONG ANSWER
Explore 5 Videos
Similar Questions
Current passing through a resistor of resistance 5Ω varies with time as shown in the graph.Heat generated in the resistance during 3s is equal to
_PHY_E05_283_Q01.png)
View SolutionCurrent l versus time t graph through a conductor is shown in the figure. Average current through the conductor in the interval 0 to 15 s is
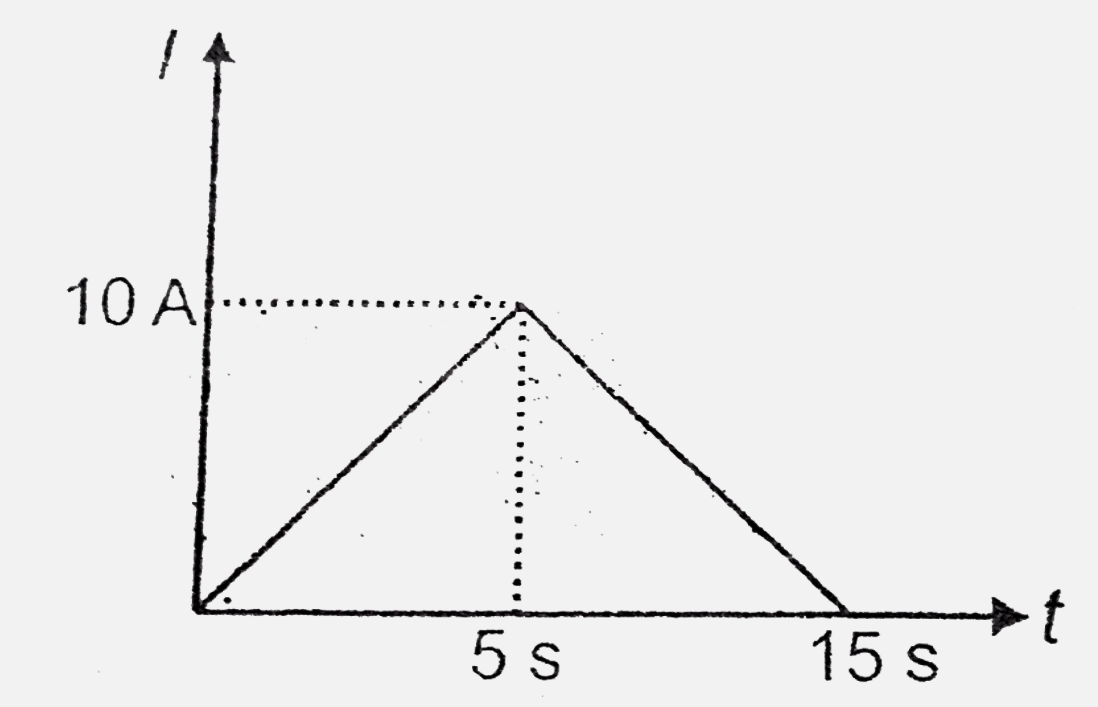
View Solution
Knowledge Check
The speed-time graph of a particle moving along a fixed direction is shown in the Fig. 2 (CF) . 15. The distance traversed by the particle between t=2s and 6s is .
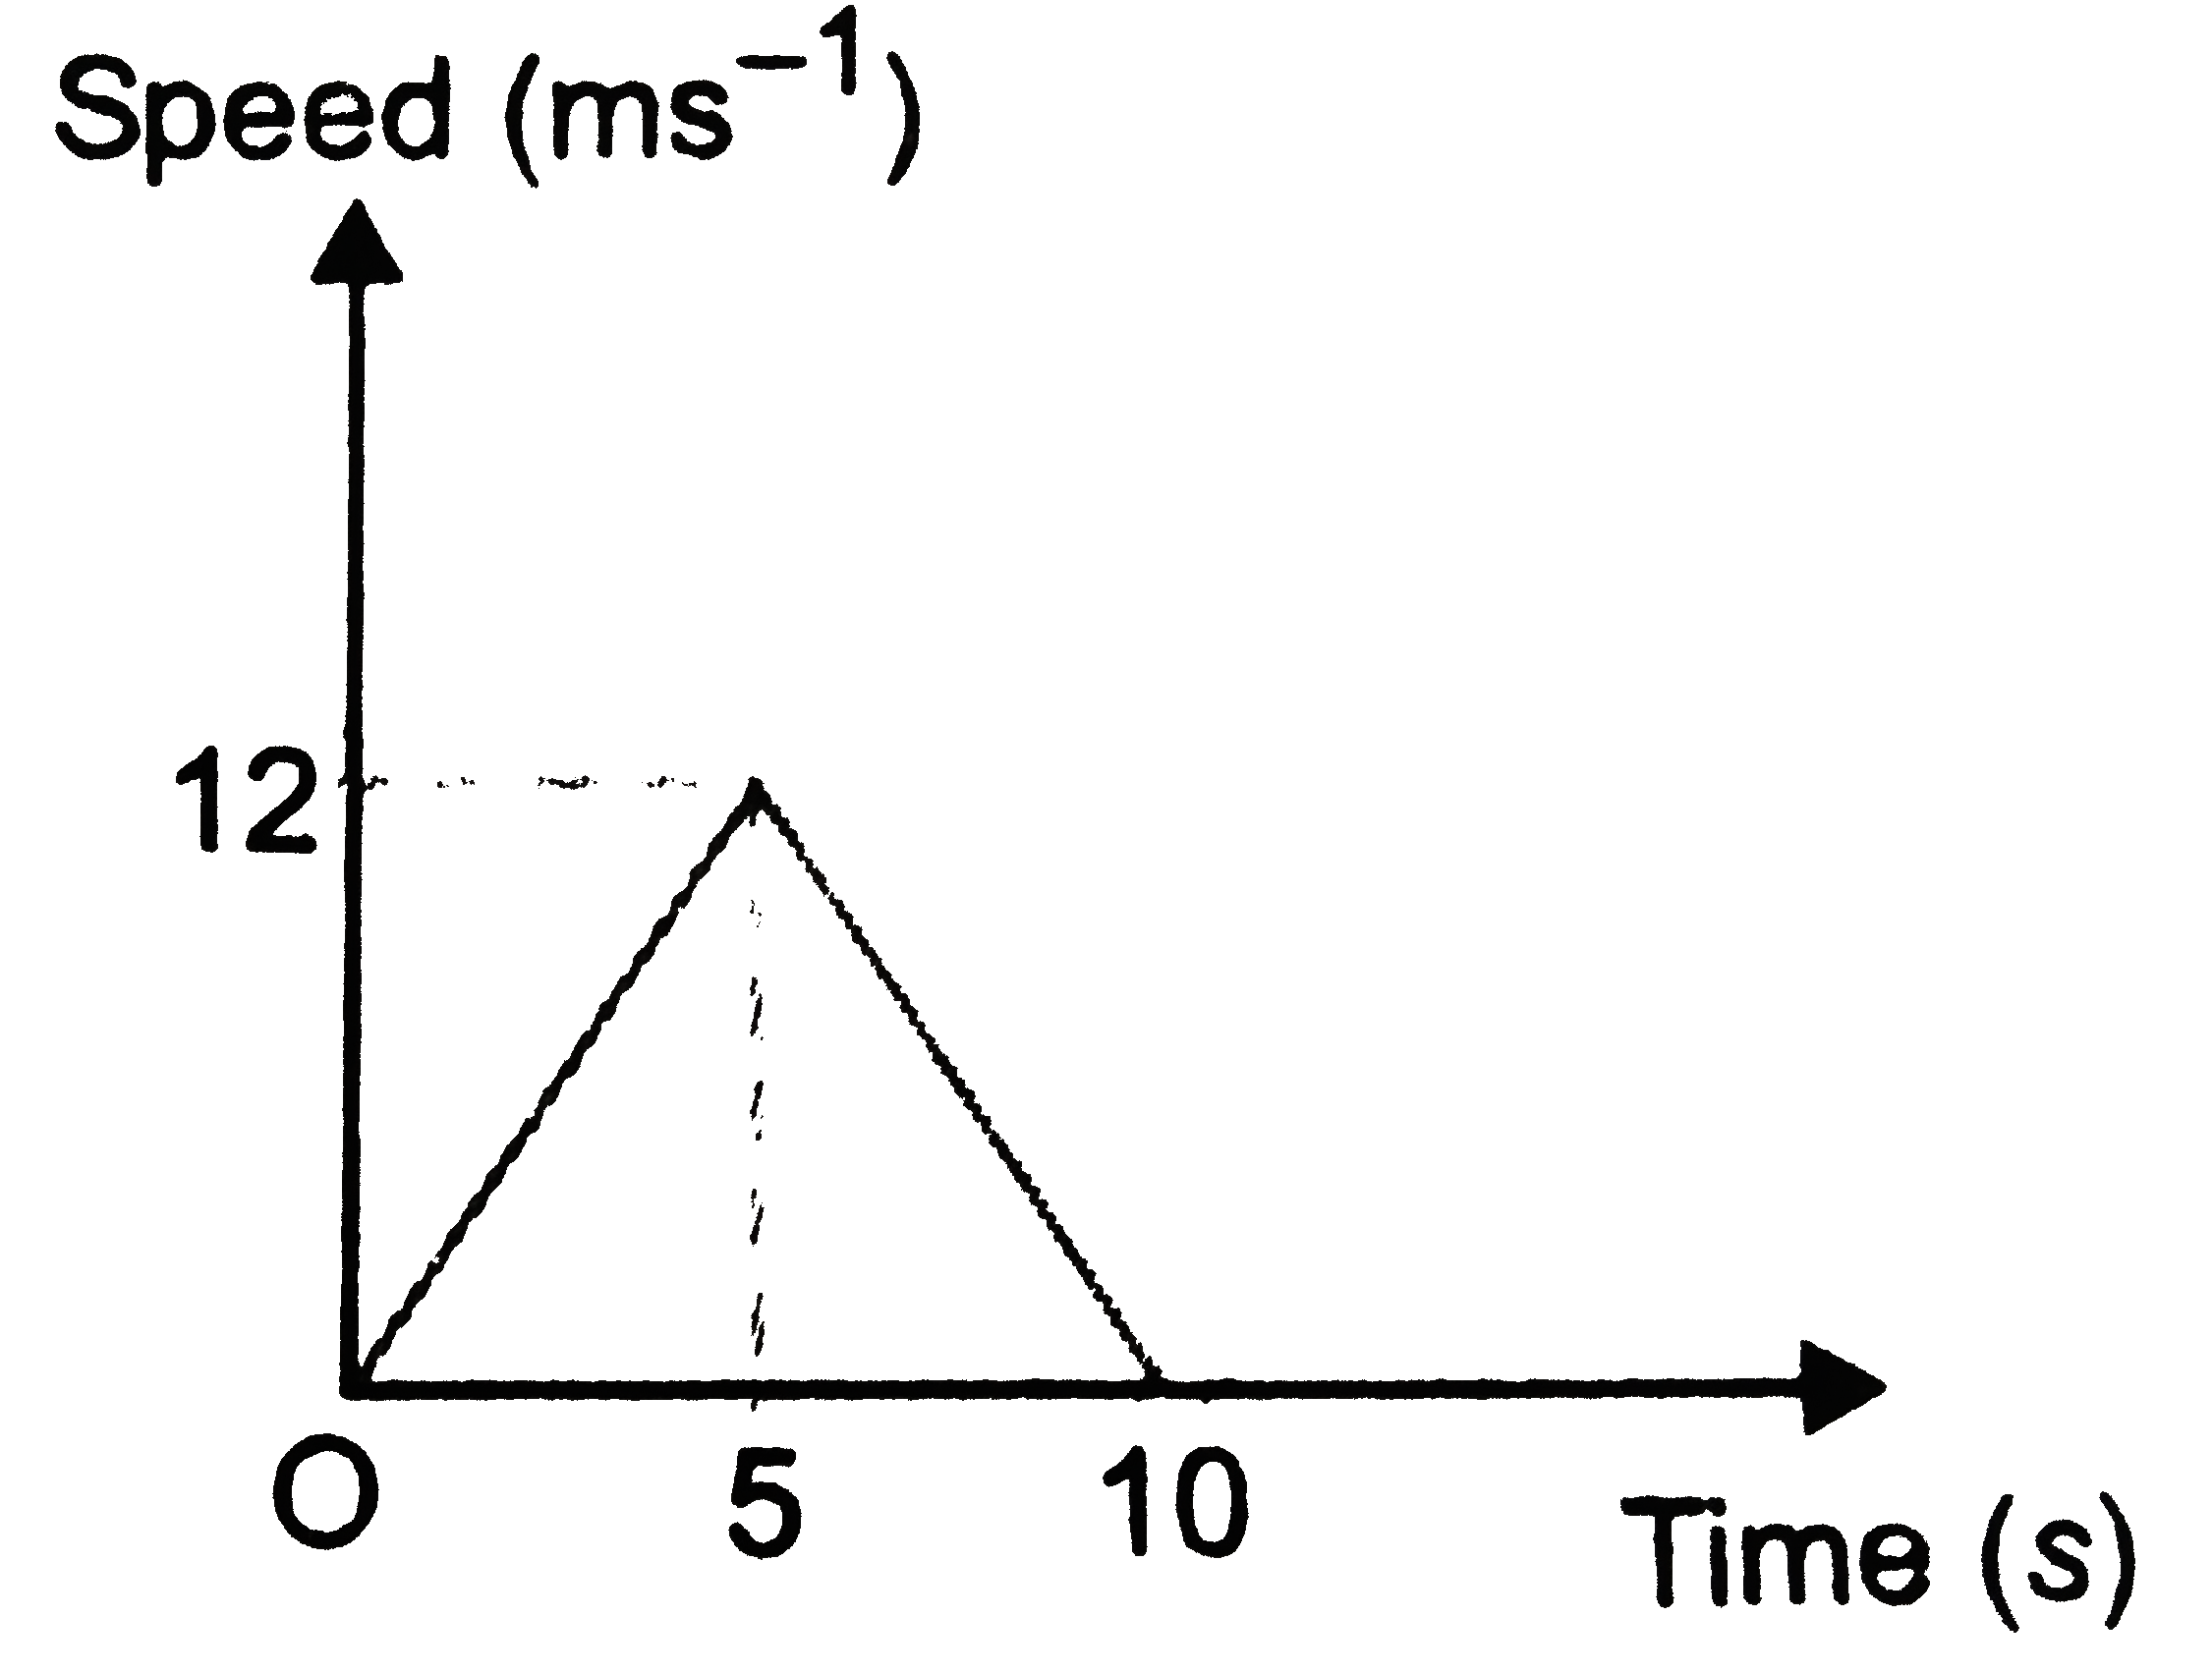 .A1. 26 mB2. 36 mC3. 46 mD4. 56 m
The current I through a conductor varies with time t as shown in figure. The average electric current during t=0 to t=10 s will be
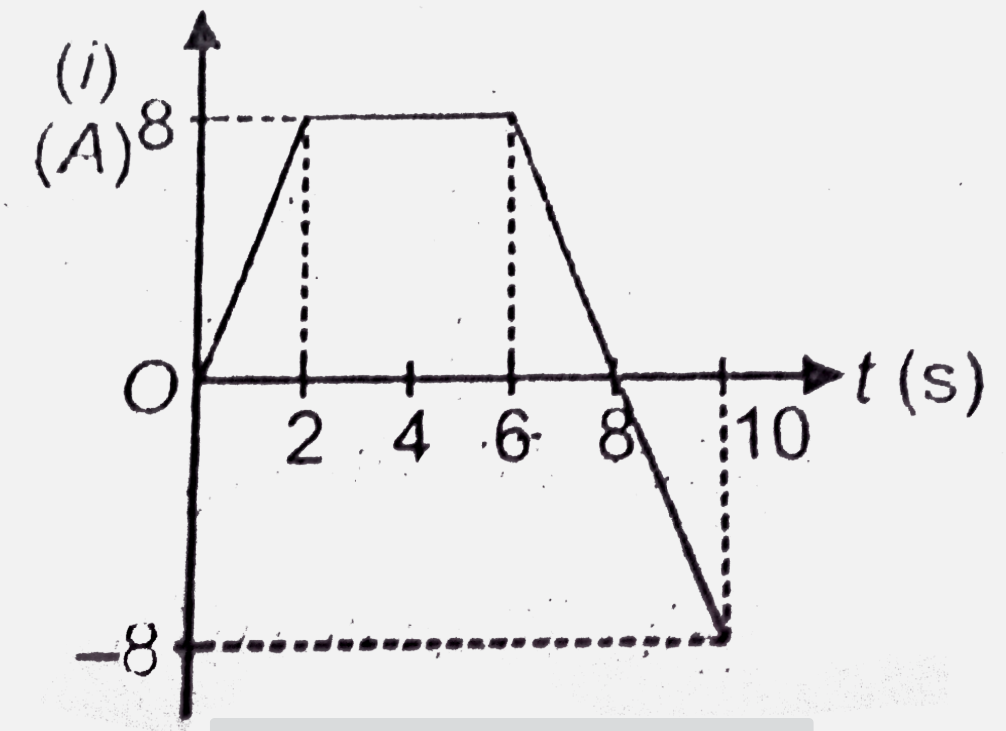
View SolutionDisplacement-time graph of a particle moving in a straight line is as shown in figure. Mass of the particle is 2 kg. The total impulse imparted to the particle in a time interval from t=0 to t=6 s in N-s will be
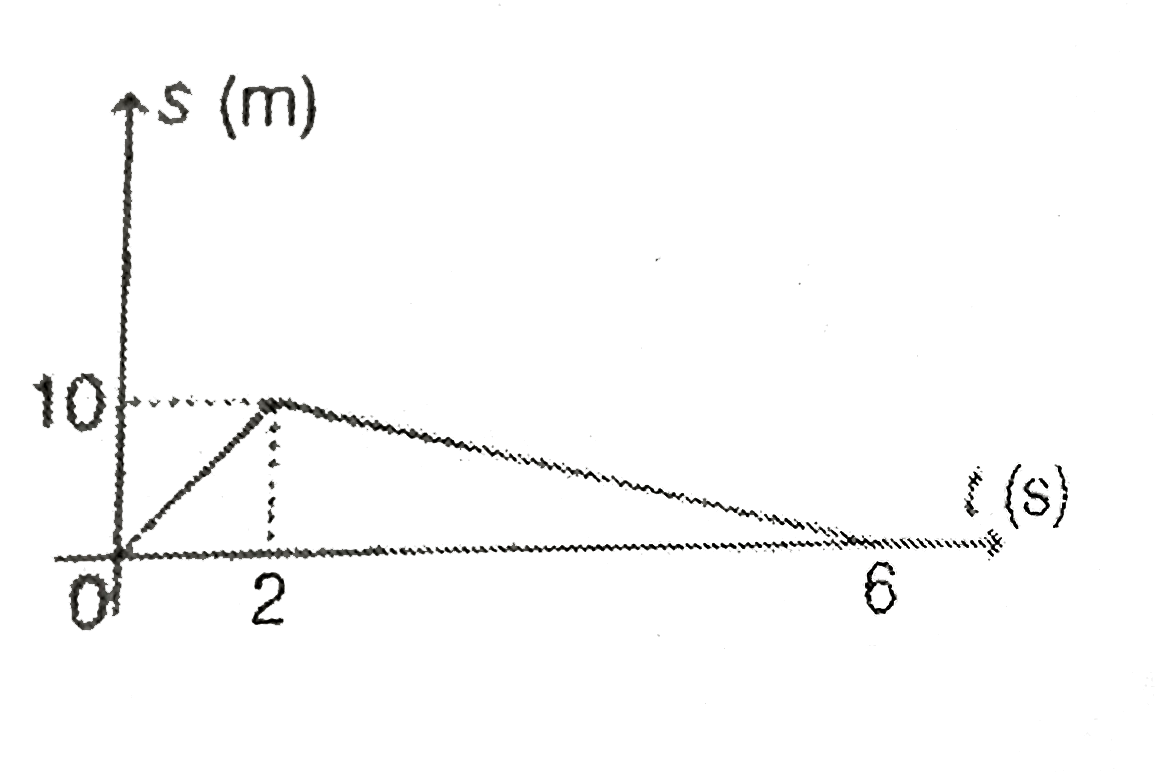
View SolutionThe velocity-time graph of a particle moving in a straight line is shown in figure. The mass of the particle is 2kg. Work done by all the forces acting on the particle in time interval between t=0 to t=10s is
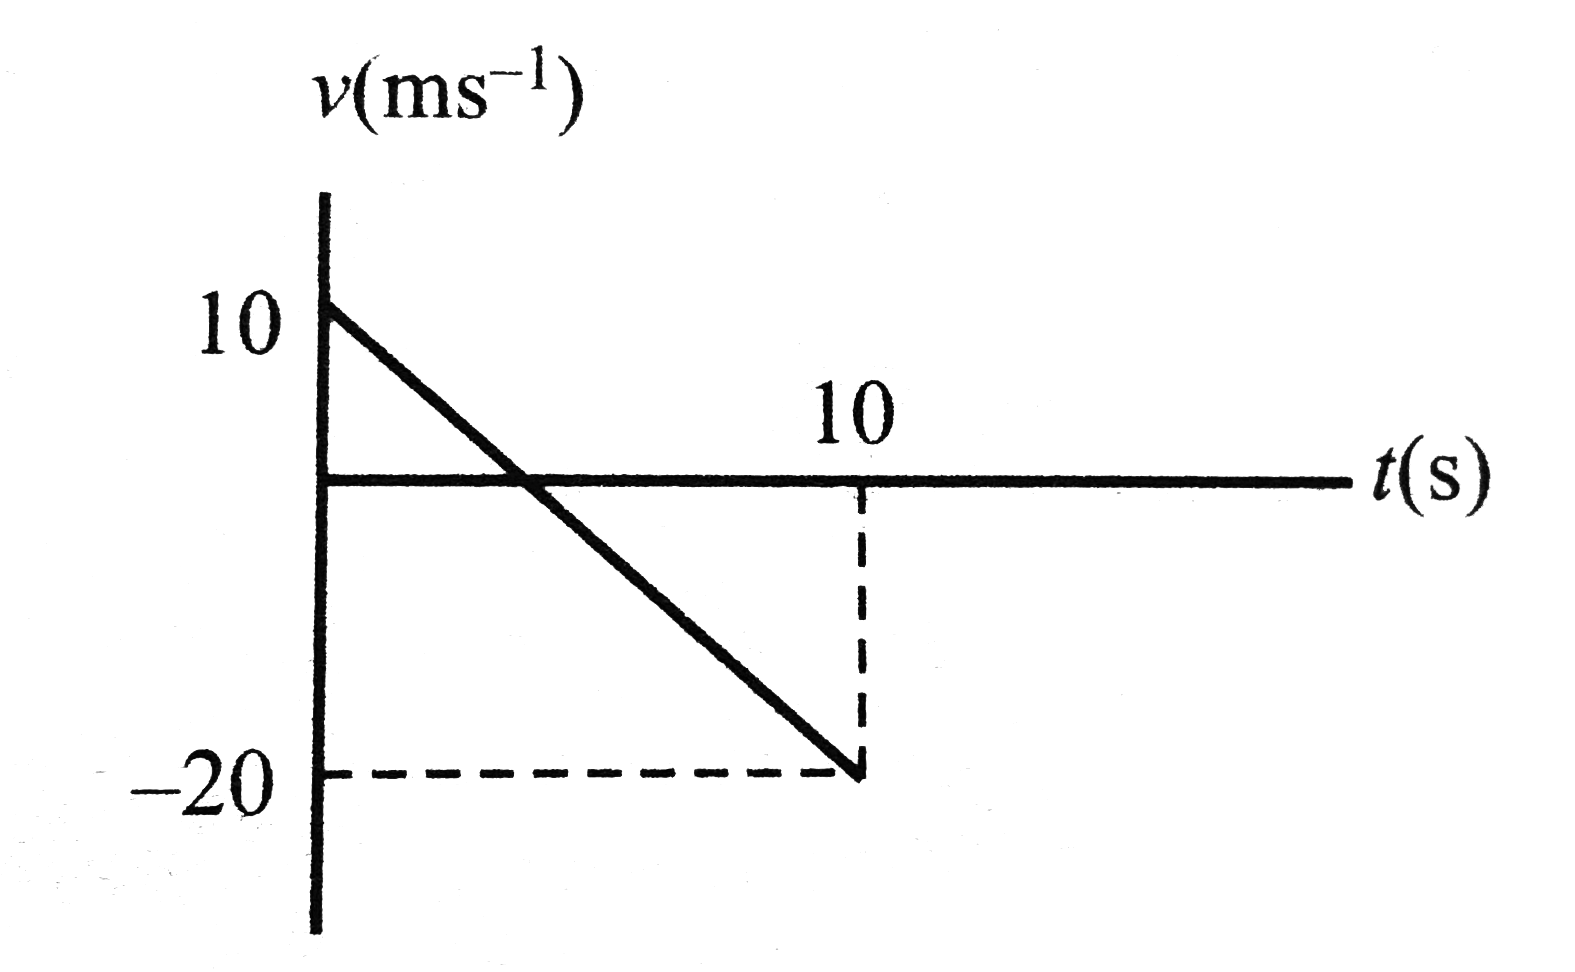
View SolutionThe velovity-time graph of a particle moving in a straitht line is shown in . The acceleration of the particle at t=9s is.
 .
.
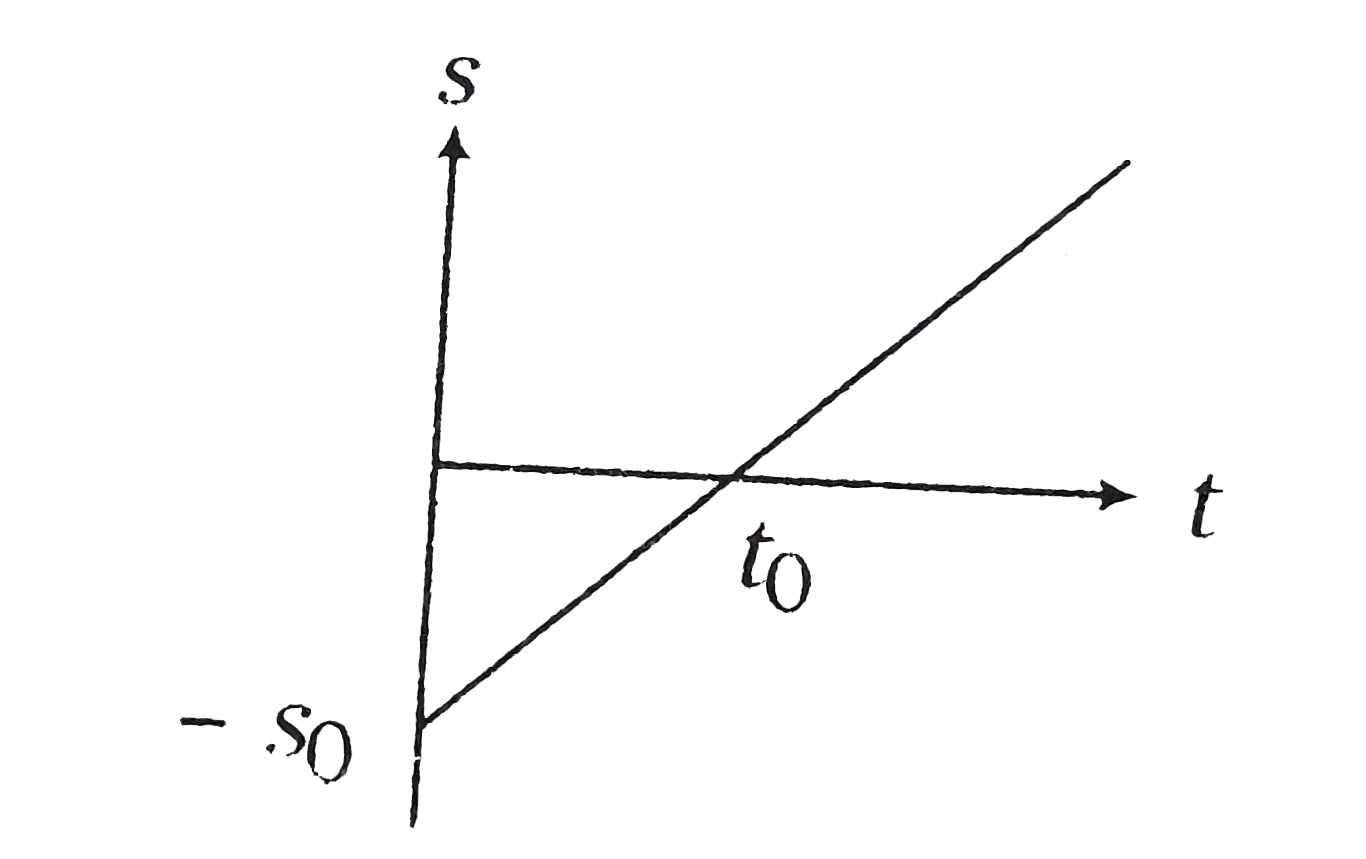
View SolutionDisplacement - time graph of particle moving in a straight line is as shown in figure. State whether the motion is accelerated or not. Describe the motion in detail. Given,
s0=20m and t0=4s.
View SolutionIn the circuit shown in figure switch S is closed at time t=0
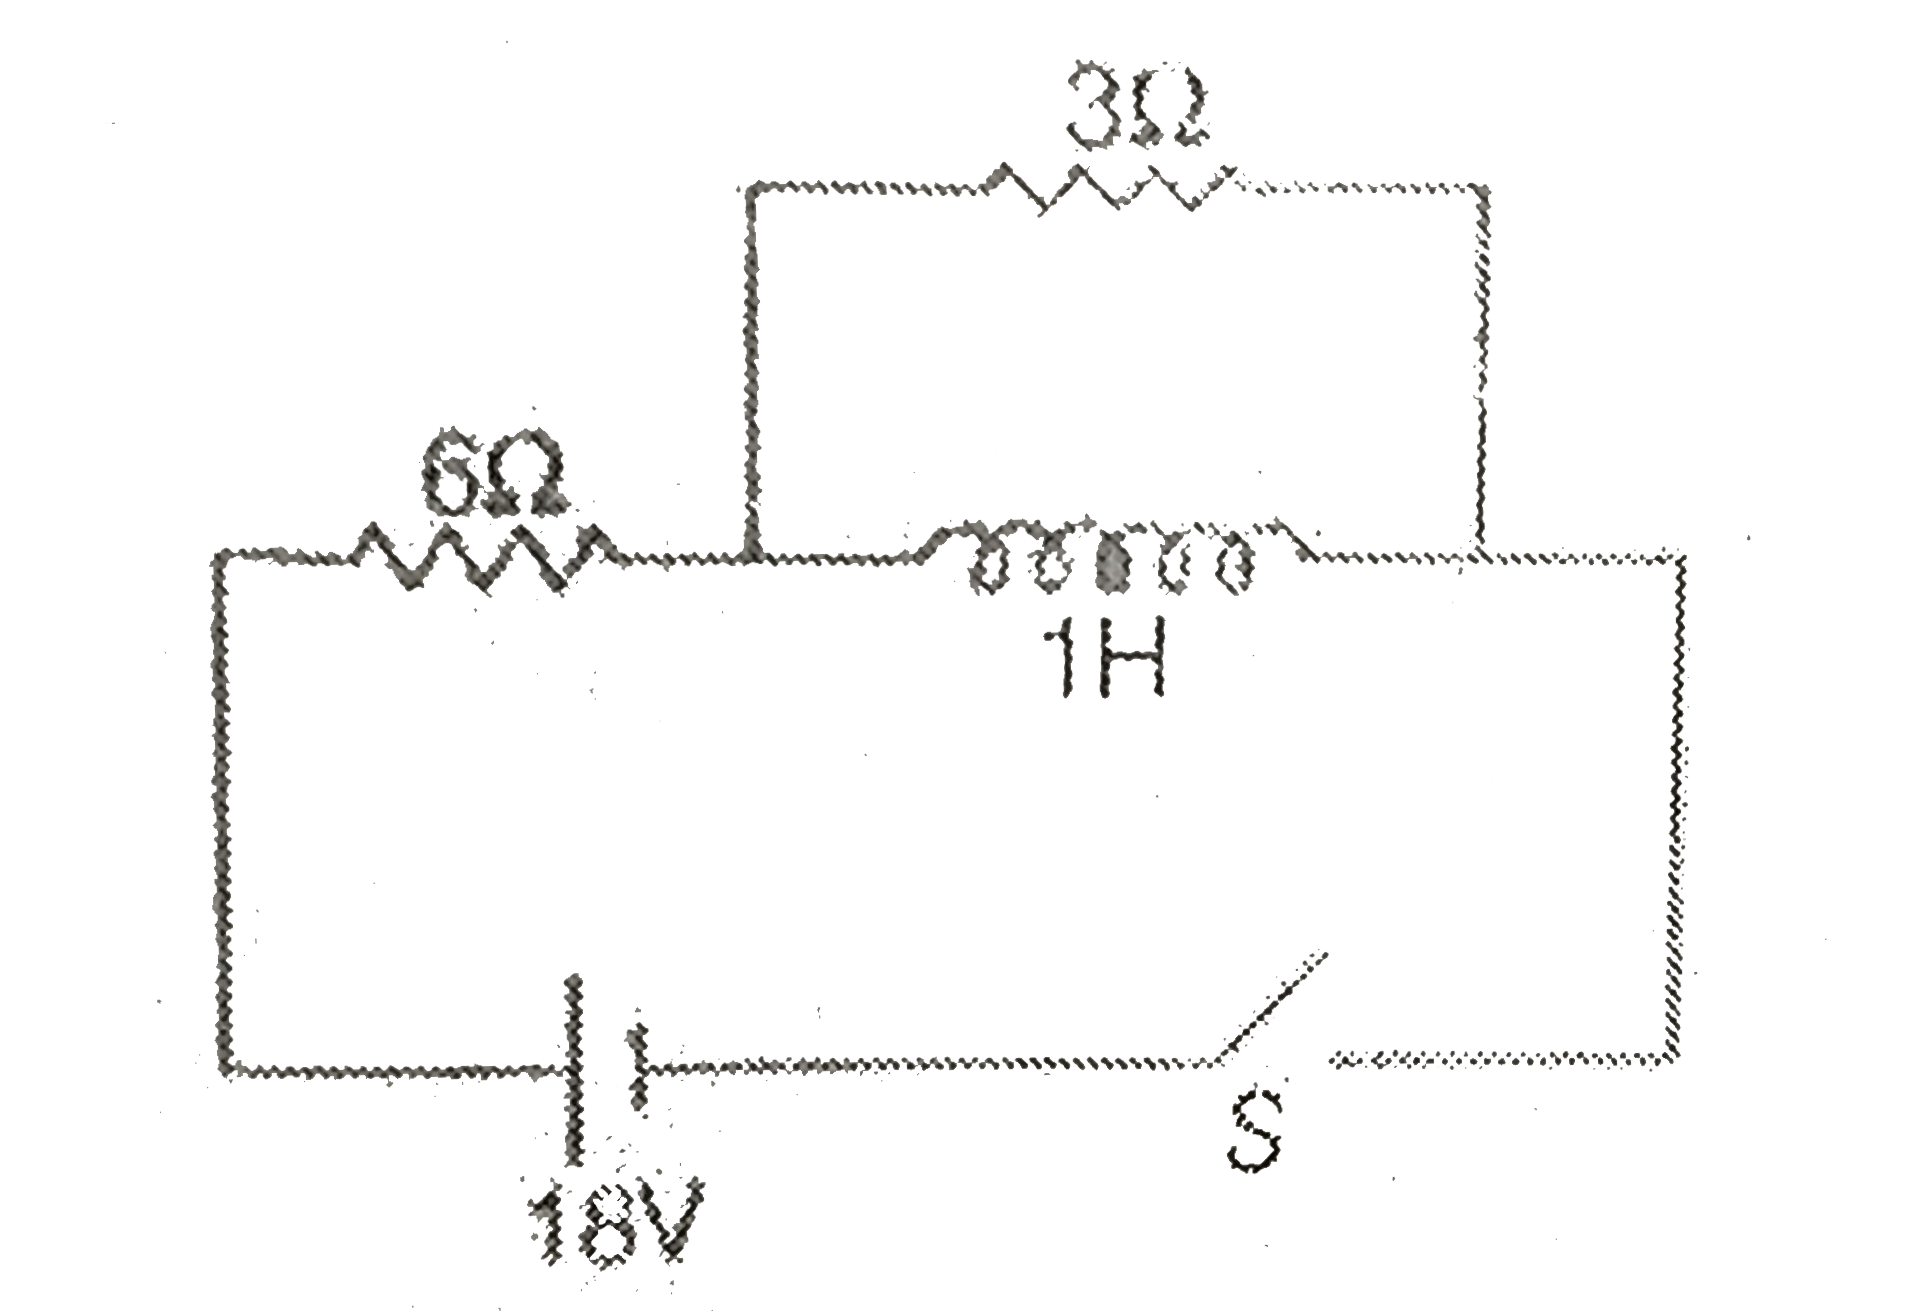
Current I from the battery at time t is given by
View SolutionVelocity-time graph of a particle moving in a straight line is shown in figure. In the time interval from t=0 to t=14s, find
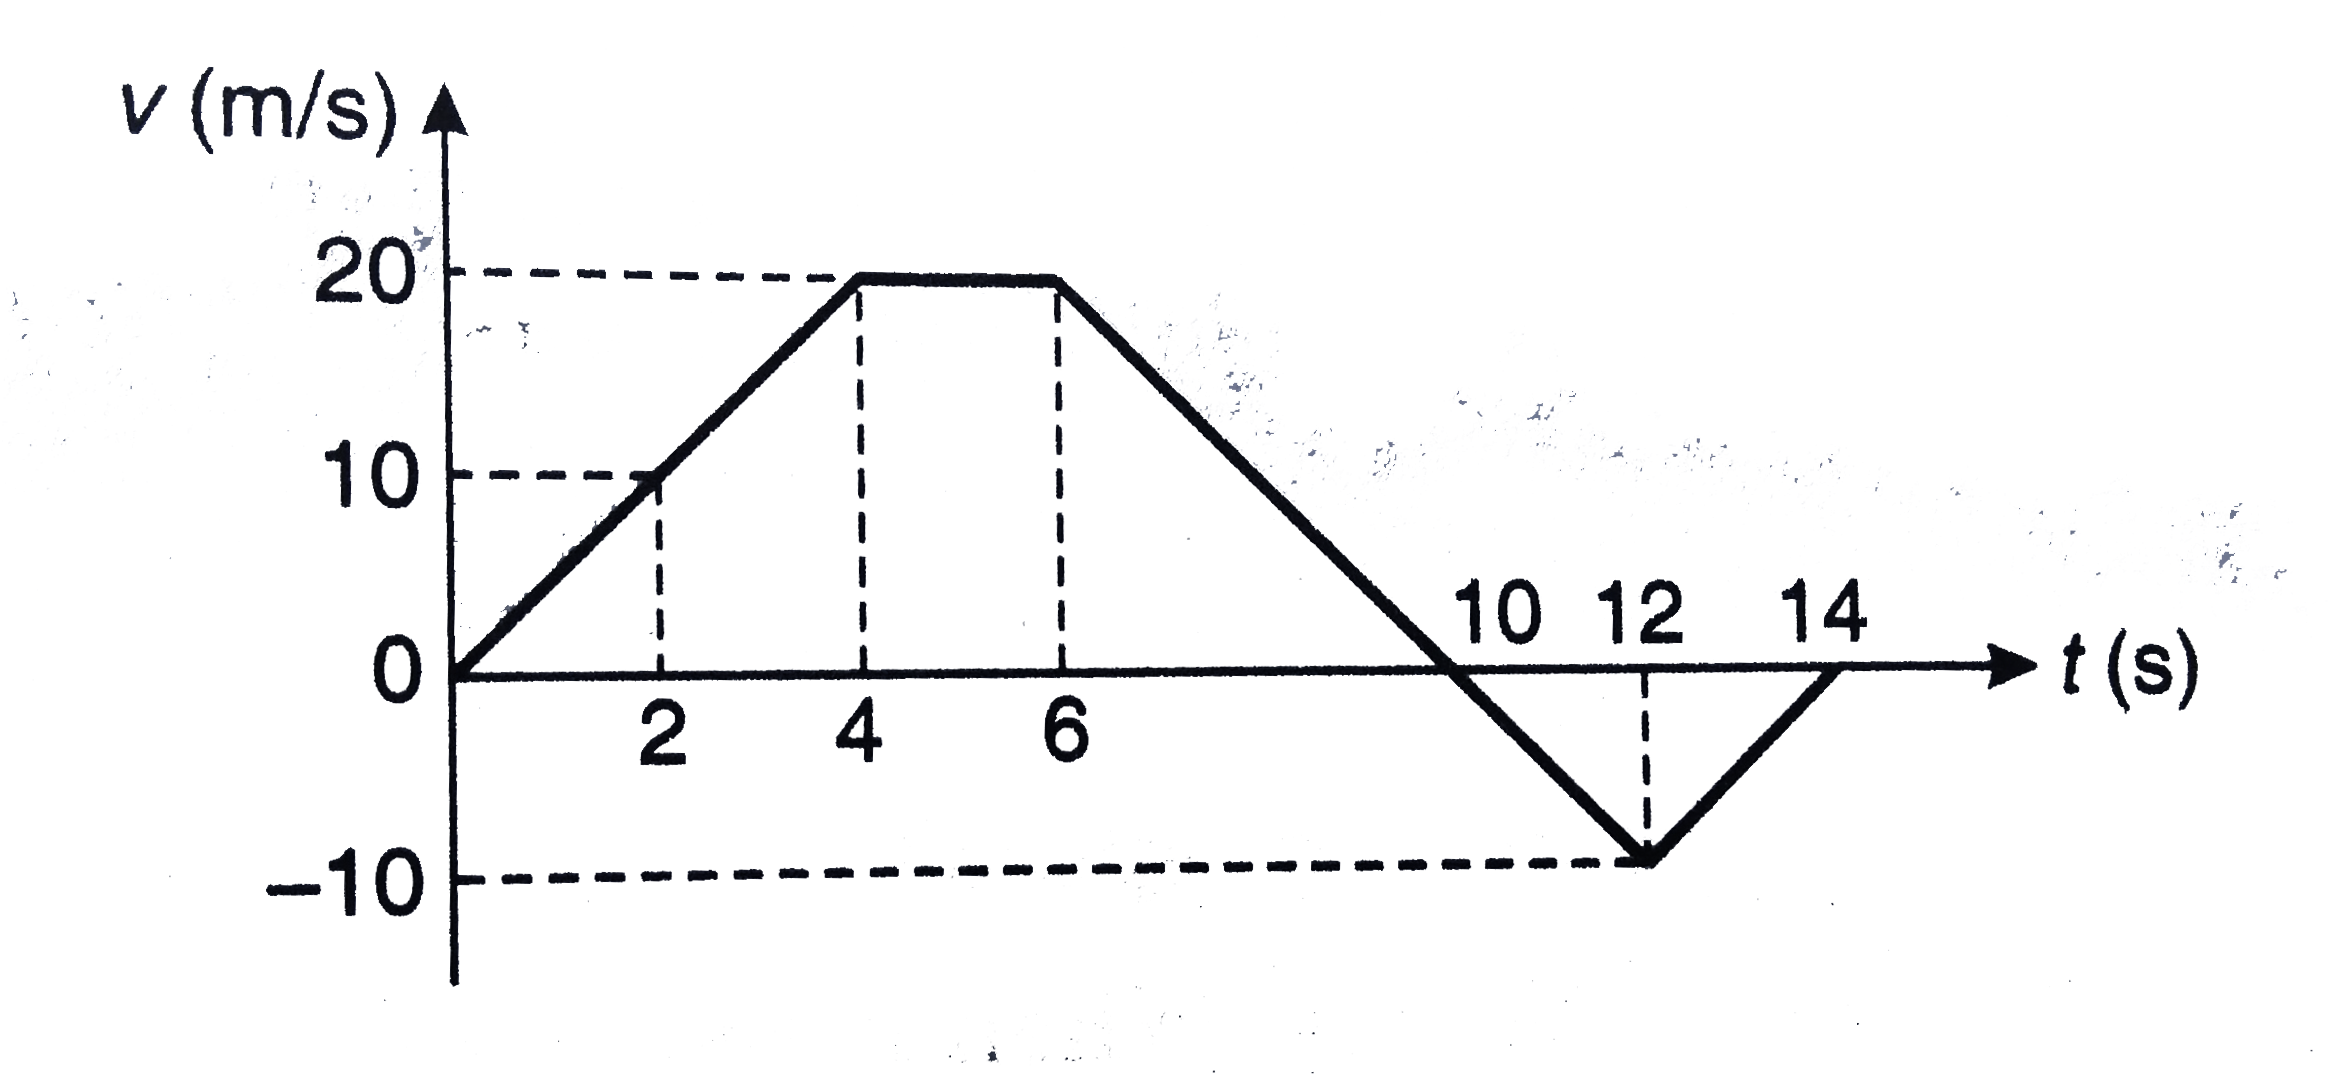
(a) average velocity and
(b) average speed of the particle.
View Solution

