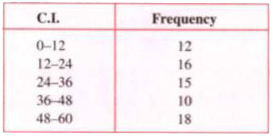
The following is the distribution of weights (in kg) of 40 persons.

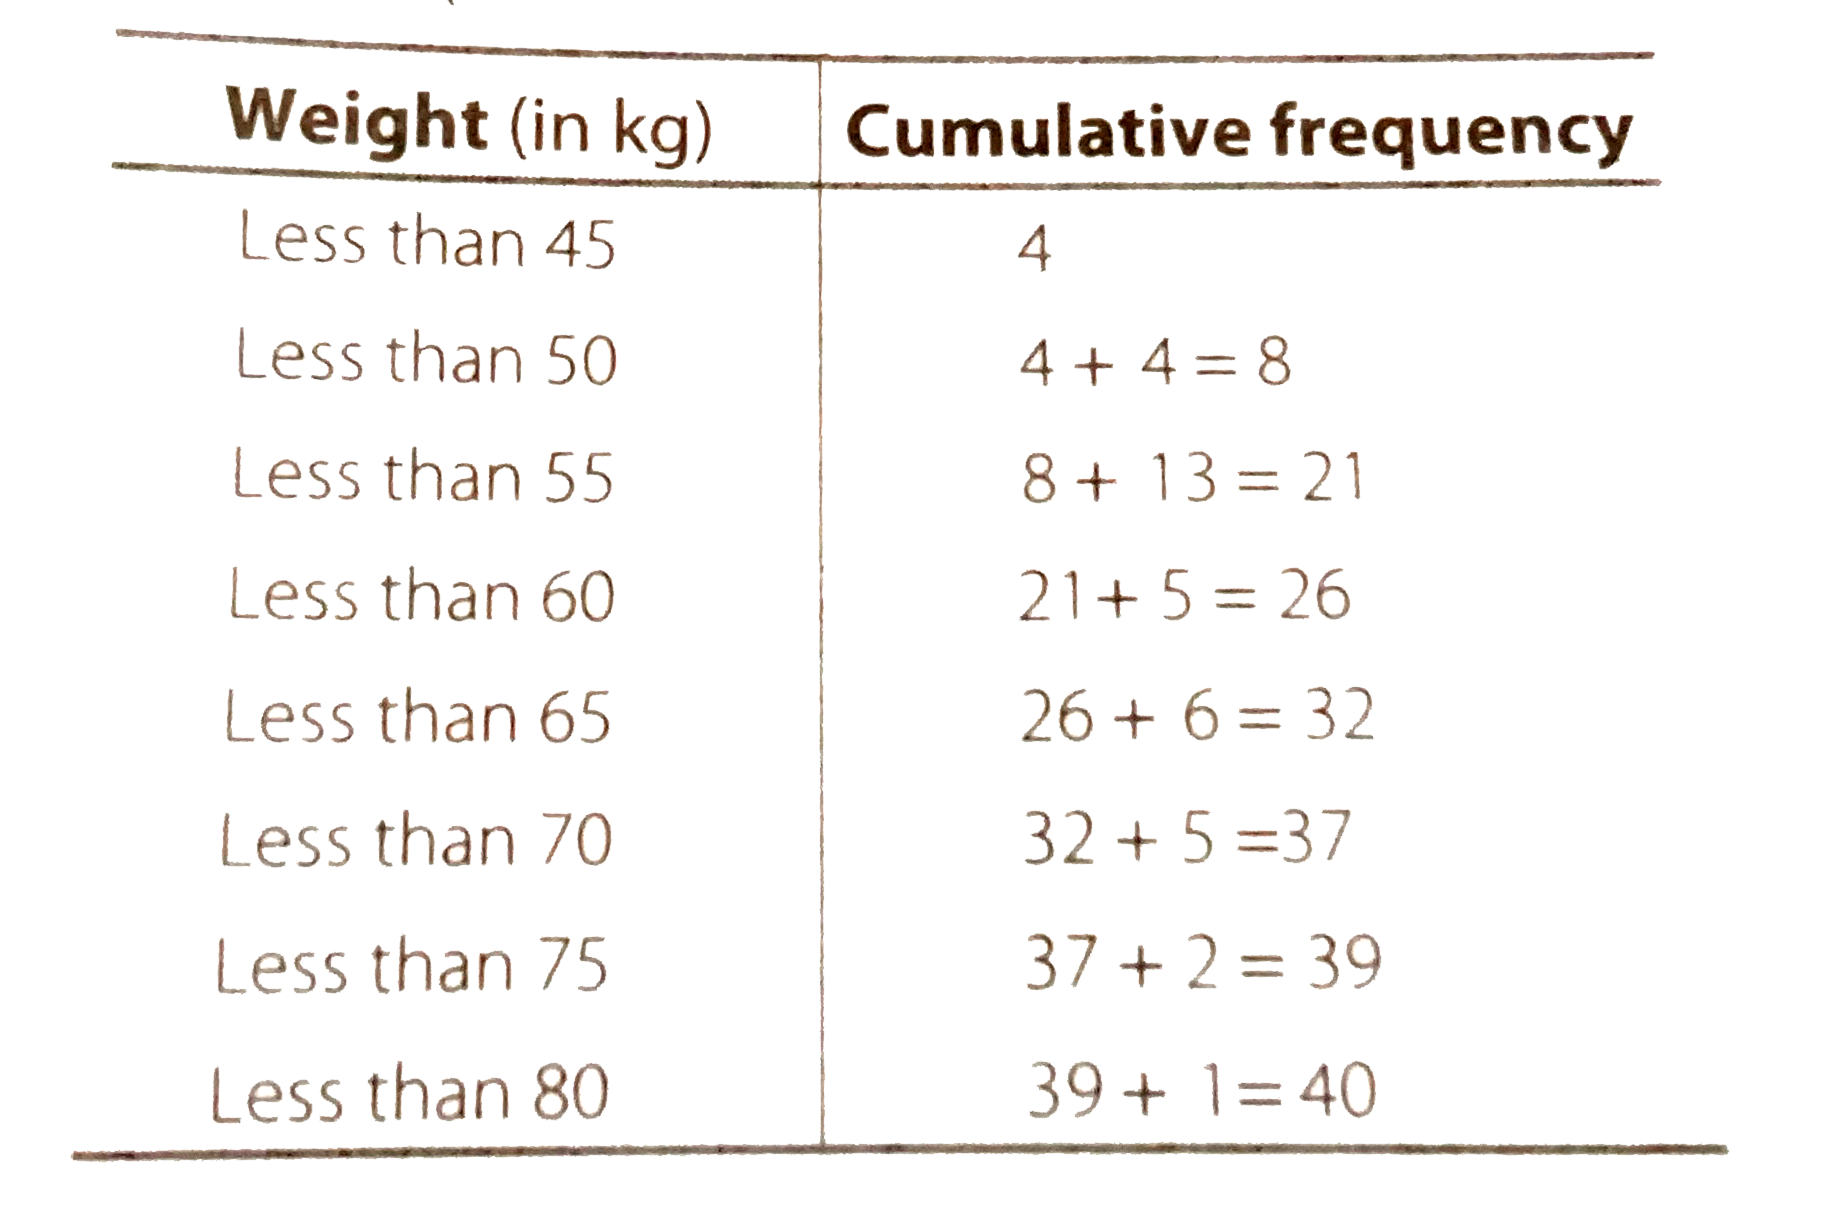
Construct a cumulative frequency distribution (of the less than type) table for the data above.
The cumulative distribution (less than type) table is shown below
Topper's Solved these Questions
- STATISTICS AND PROBABILITYBOOK - NCERT EXEMPLAR ENGLISHCHAPTER - STATISTICS AND PROBABILITYEXERCISE - LONG ASWERS QUESTIONS
14 Videos
- STATISTICS AND PROBABILITYBOOK - NCERT EXEMPLAR ENGLISHCHAPTER - STATISTICS AND PROBABILITYEXERCISE - VERY SHORT ANSWERS QUESTIONS
14 Videos
- REAL NUMBERSBOOK - NCERT EXEMPLAR ENGLISHCHAPTER - REAL NUMBERSEXERCISE - LONG ANSWER TYPE QUESTIONS
5 Videos
- SURFACE AREAS AND VOLUMESBOOK - NCERT EXEMPLAR ENGLISHCHAPTER - SURFACE AREAS AND VOLUMESEXERCISE - LONG ANSWER TYPE QUESTIONS
20 Videos
Similar Questions
Knowledge Check
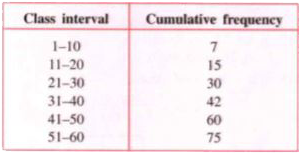
The cumulative frequency proceeding to the median class for the following data is
 A71B88C38D40
The following table show tha cumulative frequency distribution of marks of 800 students in an examination.
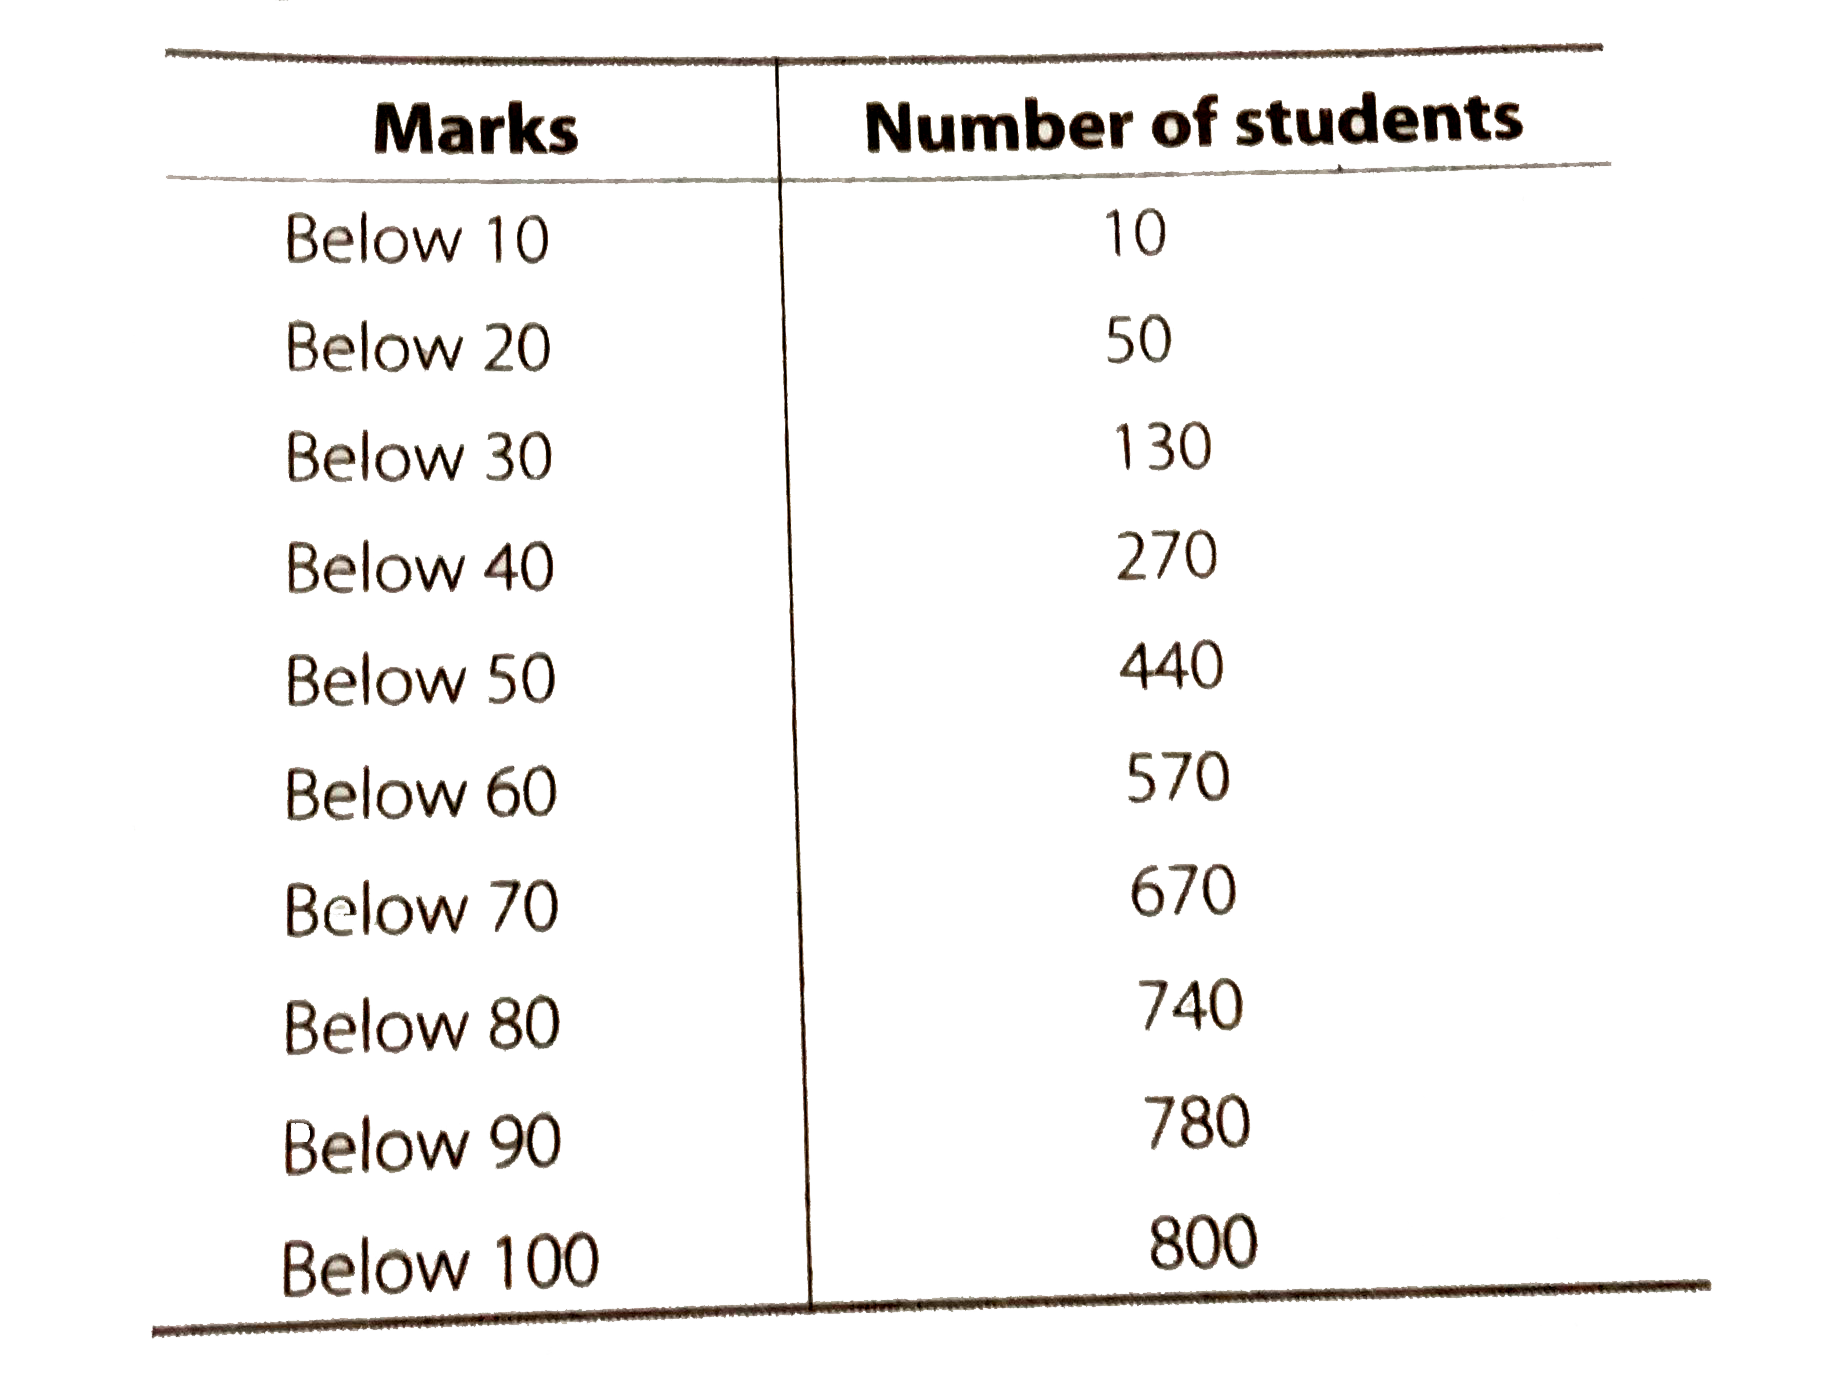
Construct a frequency distribution table for the data above.
View SolutionThe following table shows the distribution of heights of a group of factory workers.

Determine the cumulative frequencies.
View SolutionThe mode for the following frequency distribution :

View SolutionFrom the frequency distribution table from the following data
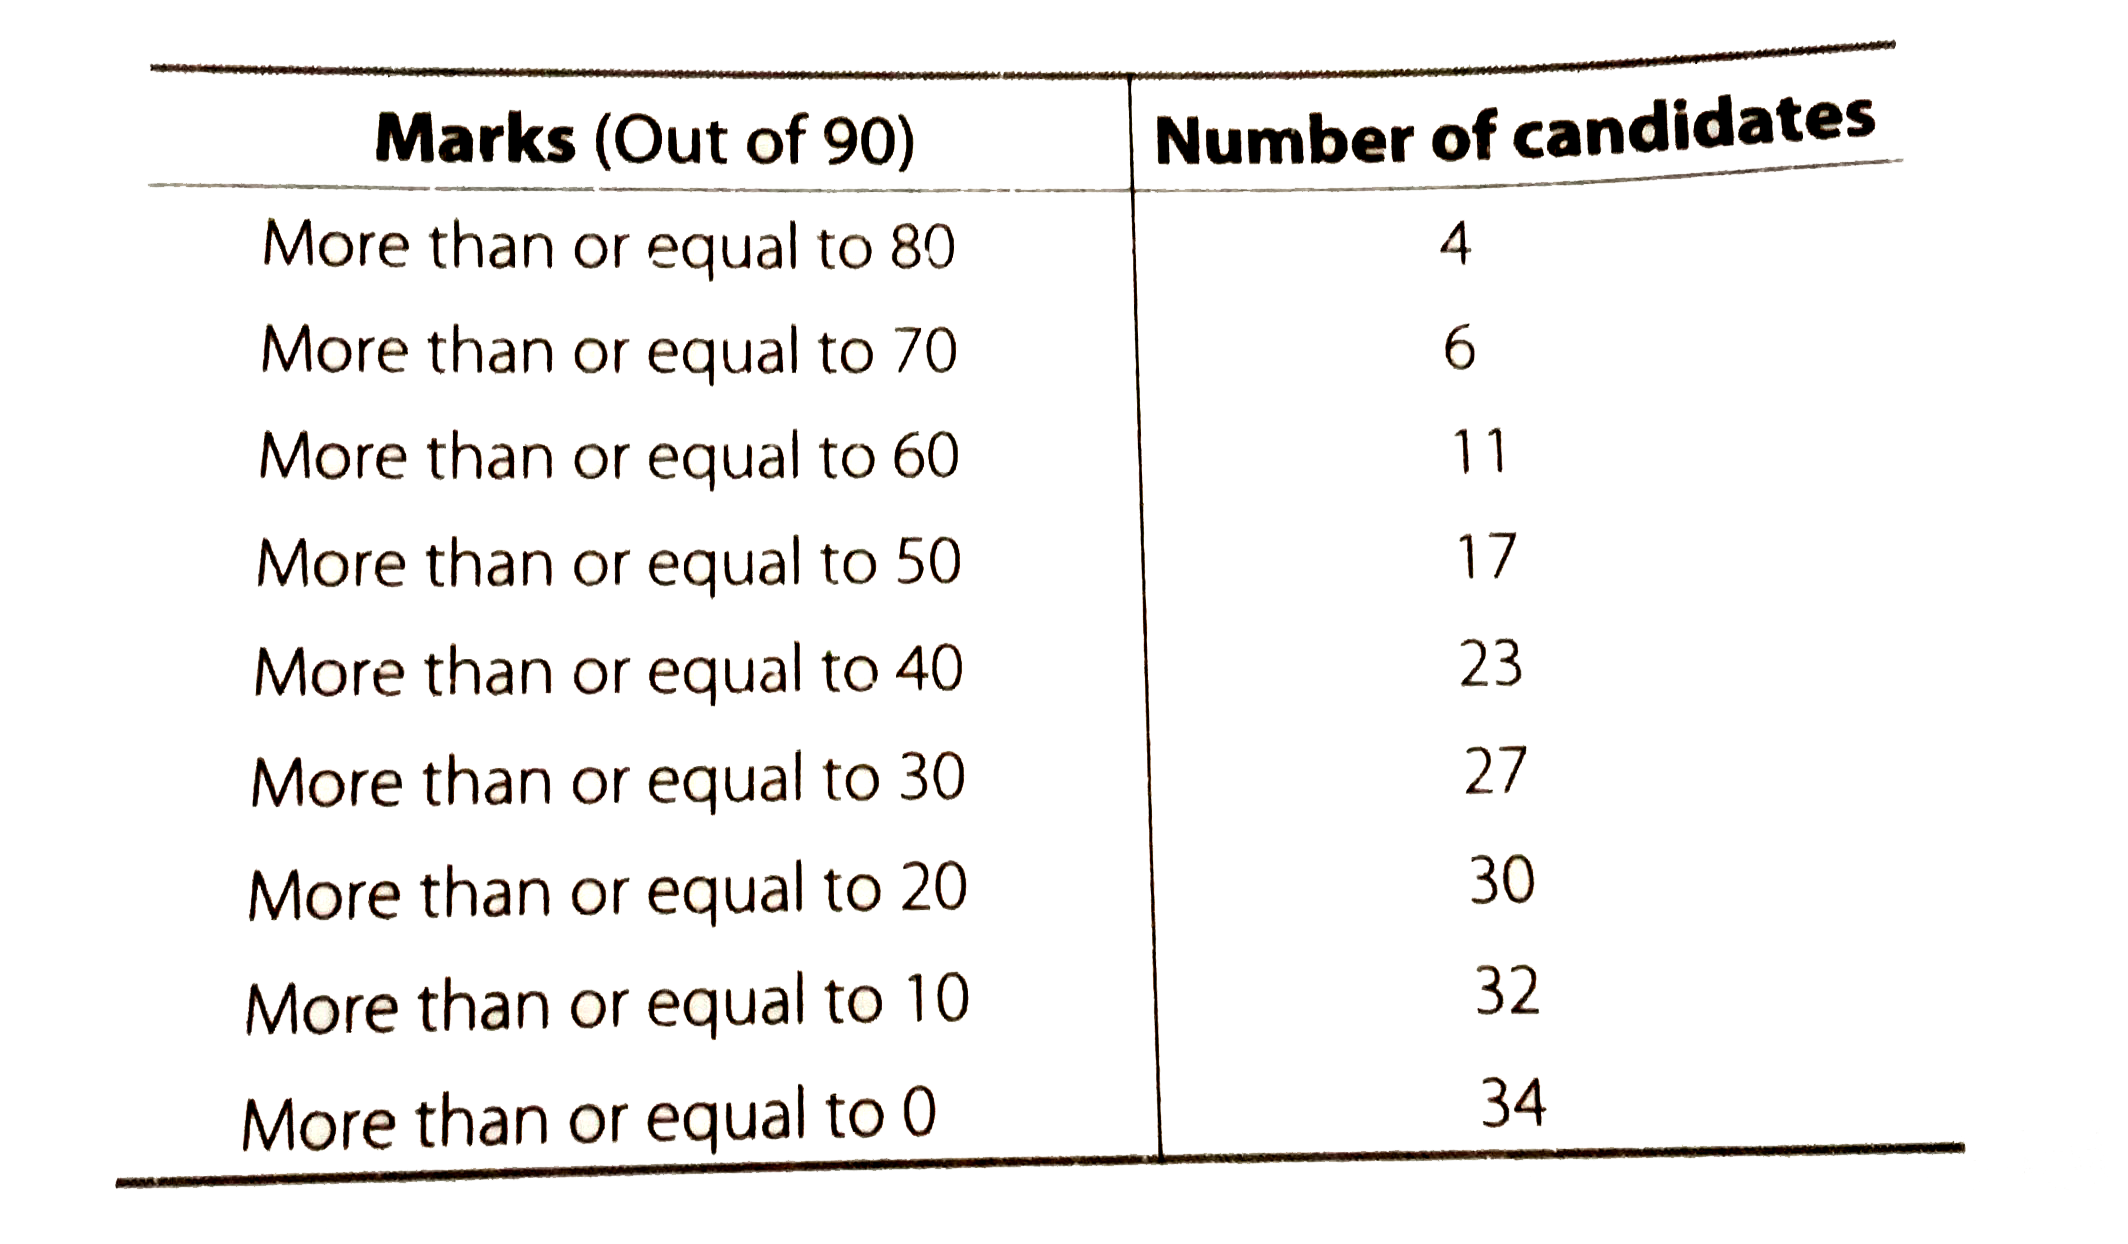
View SolutionFollowing is the age distribution of a group of students. Draw the cumulative frequency polygon, cumulative frequency curve (less than type) and hence obtain the median value.
View SolutionFind the mean for the following frequency distribution :

View SolutionThe following table shows the distribution of the heights of a group of students:

Use a graph sheet to draw an Ogive for the distribution. Use the Ogive to find:
the number of students whose height is less than 148 cm.
View Solution

