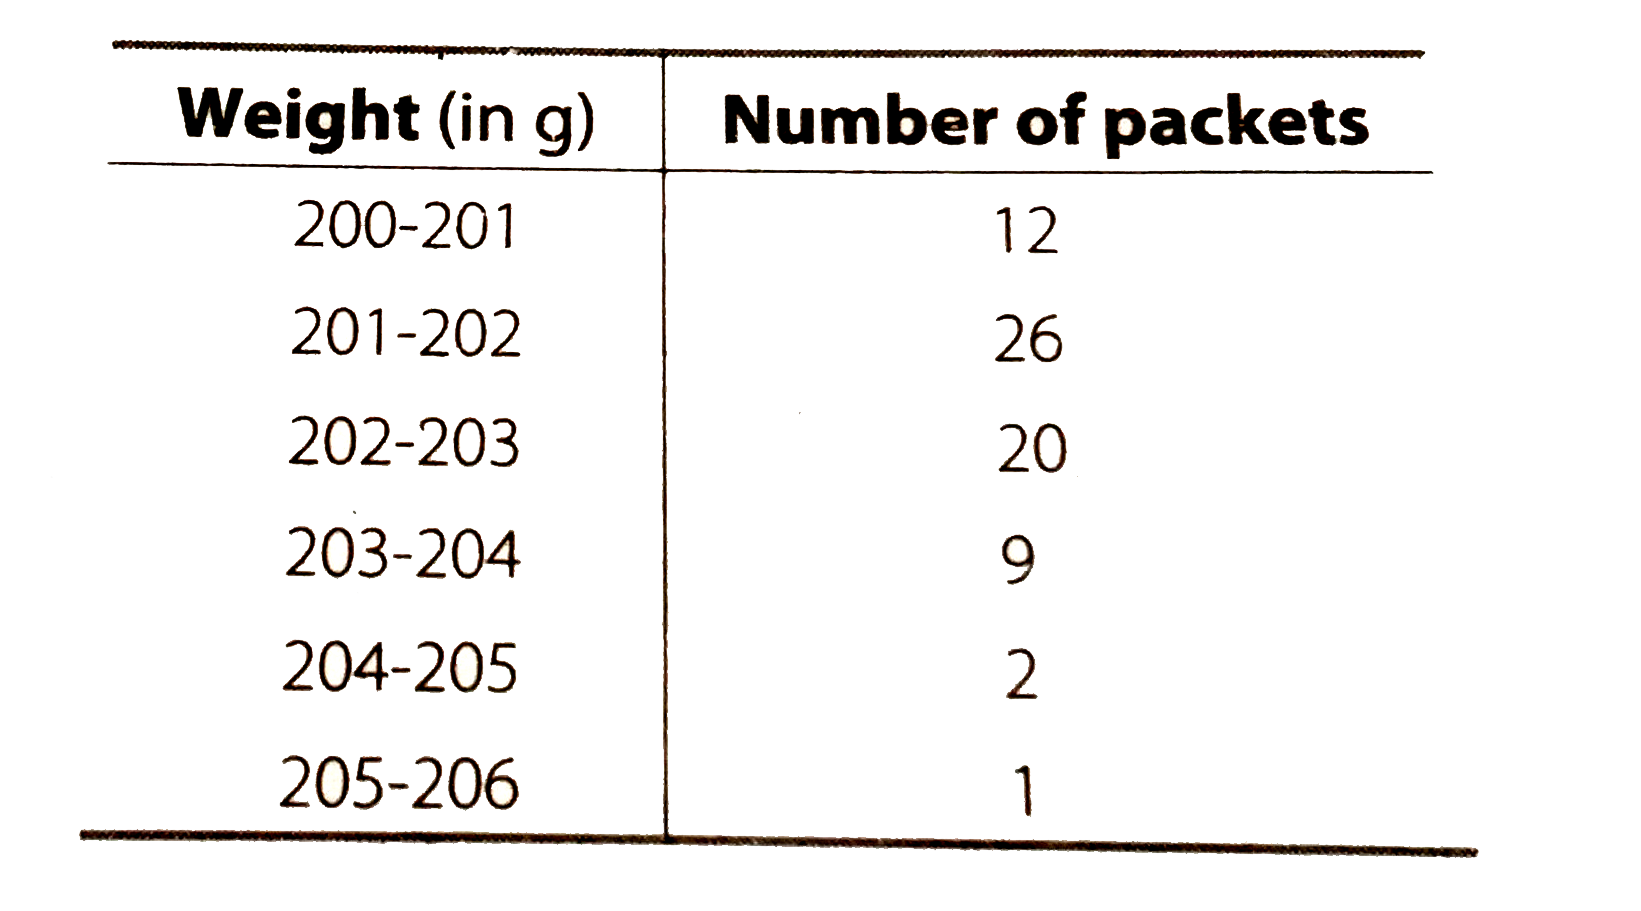
The weights of coffee im 70 packets are shown in the following table

Determine the modal weight.
In the given data, the highest frequency is 26, which is lies in the interval 201-202
Here, l=201,fm=26,f1=12,f2=20and(class width)h=1
∴Model+(fm−t12fm−t1−f2)×h=201+(26−122×26−12−20)×1
=201+(1452−32)=201+1420=201+0.7=201.7g
Hence the modal weight is 201.7g
Topper's Solved these Questions
- STATISTICS AND PROBABILITYBOOK - NCERT EXEMPLAR ENGLISHCHAPTER - STATISTICS AND PROBABILITYEXERCISE - LONG ASWERS QUESTIONS
14 Videos
- STATISTICS AND PROBABILITYBOOK - NCERT EXEMPLAR ENGLISHCHAPTER - STATISTICS AND PROBABILITYEXERCISE - VERY SHORT ANSWERS QUESTIONS
14 Videos
- REAL NUMBERSBOOK - NCERT EXEMPLAR ENGLISHCHAPTER - REAL NUMBERSEXERCISE - LONG ANSWER TYPE QUESTIONS
5 Videos
- SURFACE AREAS AND VOLUMESBOOK - NCERT EXEMPLAR ENGLISHCHAPTER - SURFACE AREAS AND VOLUMESEXERCISE - LONG ANSWER TYPE QUESTIONS
20 Videos
Similar Questions
Knowledge Check

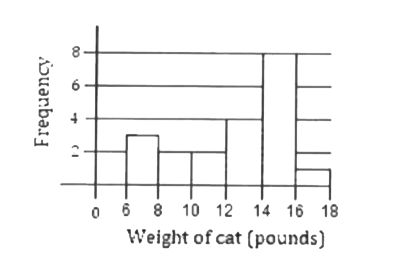
The histogram above shows the distribution of the weights, in pounds, of 18 cats in a shelter. Which of the following could be the median weight of the 18 cats represents in the histogram?A10 poundsB11 poundsC13.5 poundsD16 pounds
The weights (in kg) of 50 wrestlers are recorded in the following table.

Find the mean weight of the wrestlers.
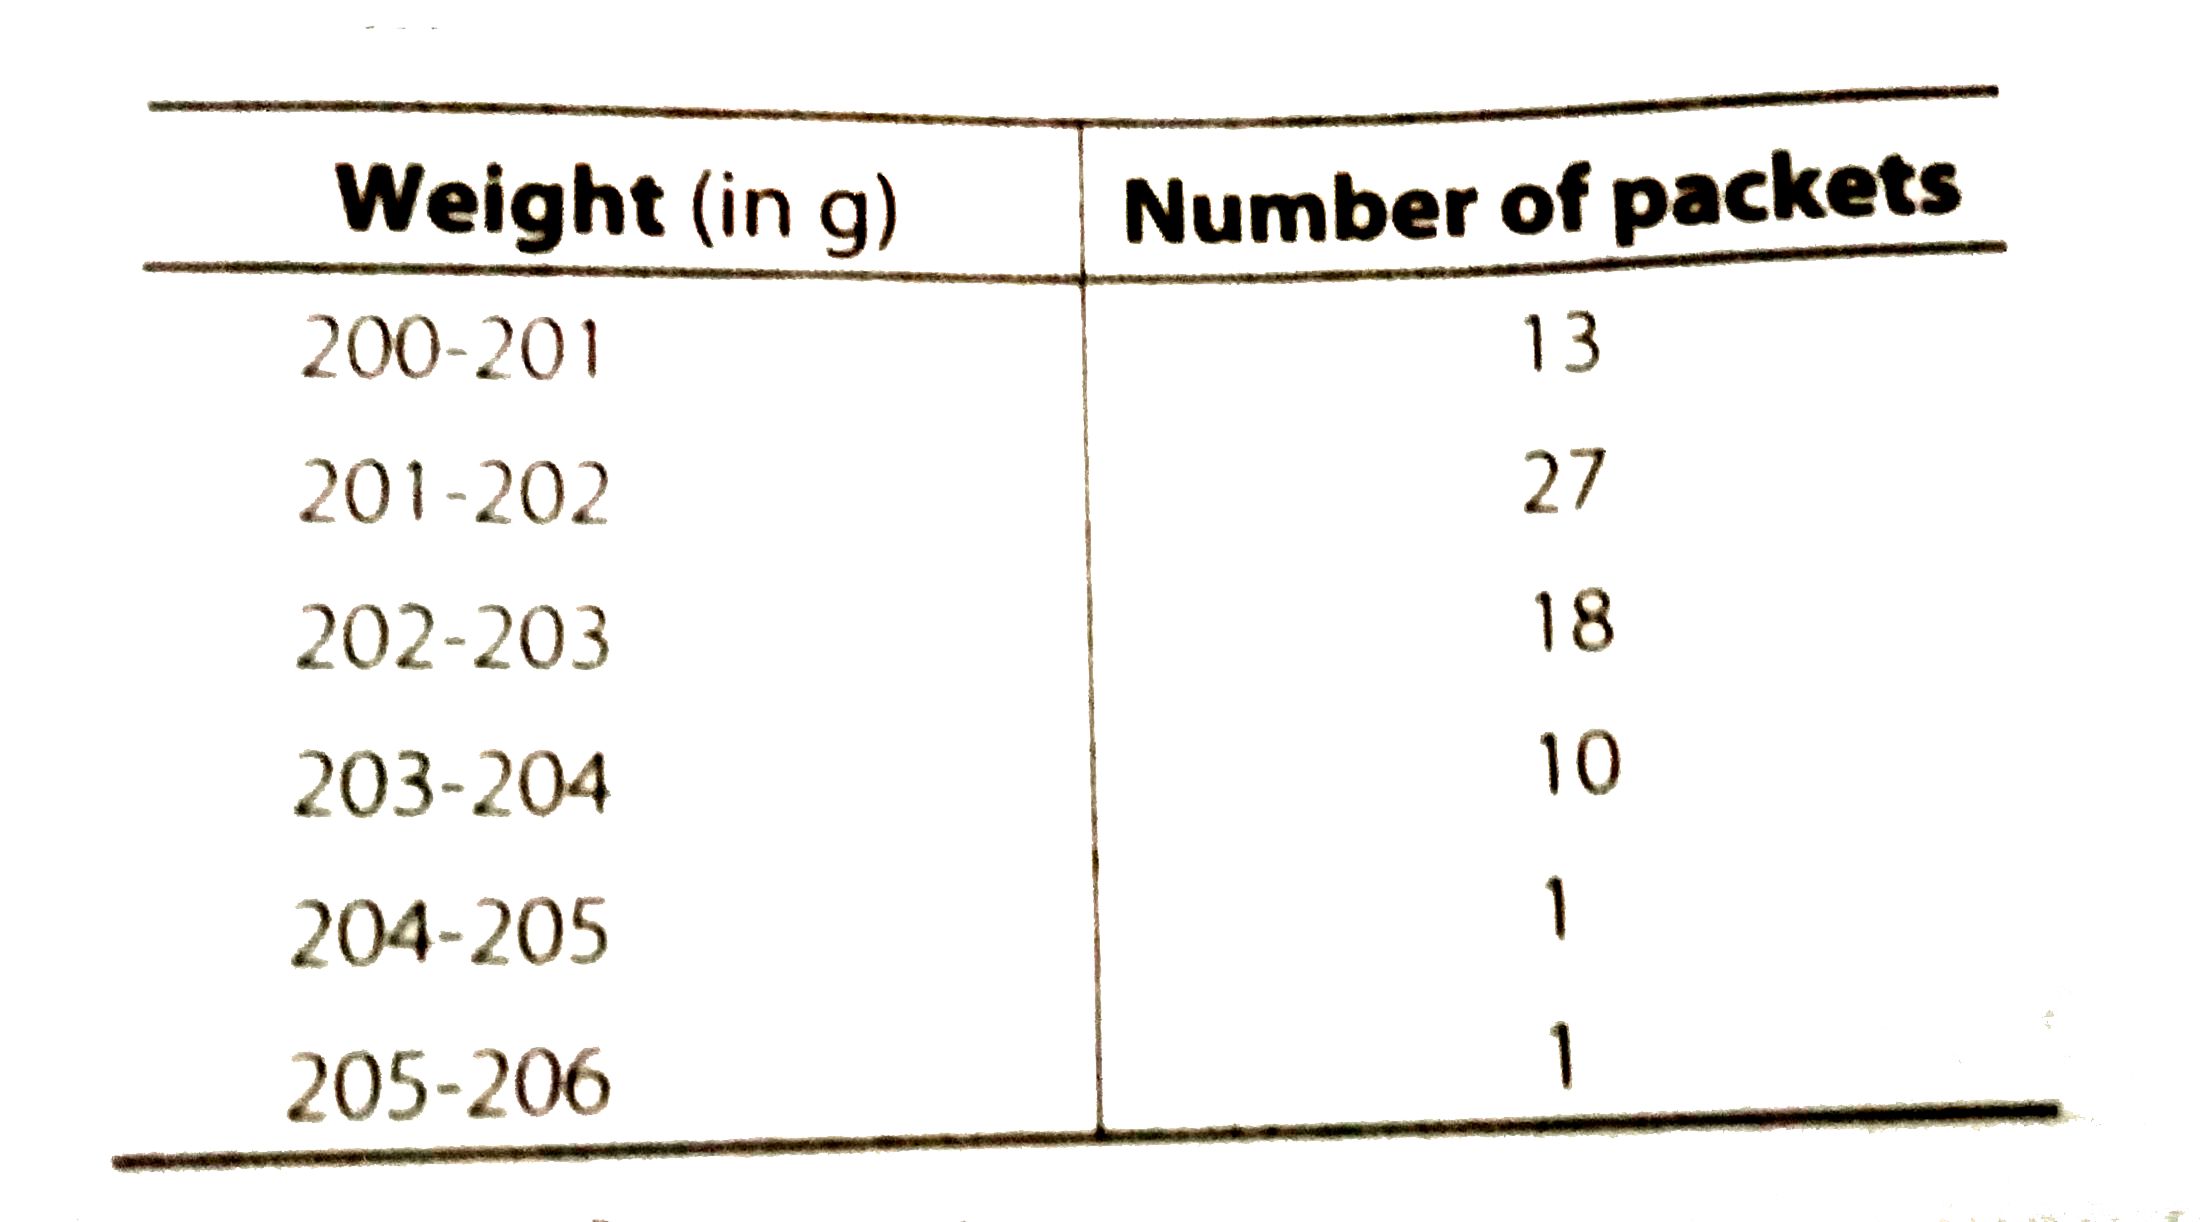
View SolutionThe weight of coffee in 70 jars is shown in the following table: Weight (in grams):, 200−201 , 201−202 , 202−203 , 203−204 , 204-205, 205-206 Frequency , 13, 27, 18, 10, 1, 1 Determine the variance and standard deviation of the above distribution.
View SolutionThe weight of coffee in 70 jars is shown in the following table: Weight (in grams): 200−201 201−202 202−203 203−204 204-205 205-206 Frequency 13 27 18 10 1 1 Determine the variance and standard deviation of the above distribution.
View SolutionDetermine the equivalent weight of Nacl
View SolutionThe weights of 25 students of a class are given in the following table:

Using short-cut method, find the mean weight.
View SolutionThe Price relative and weight of a set of commoditities are given in the following table

If the index for the set is 135 and the sum of the weight is 26, find w1+w2
View SolutionThe weights in kilograms of 60 workers in a factory are given in the following frequency table. Find the mean weight of a worker. Weight (in kg) x: 60 61 62 63 64 65 No. of workers f: 5 8 14 16 10 7
View Solution


 .Determine variance and standard deviation of the above distribution.