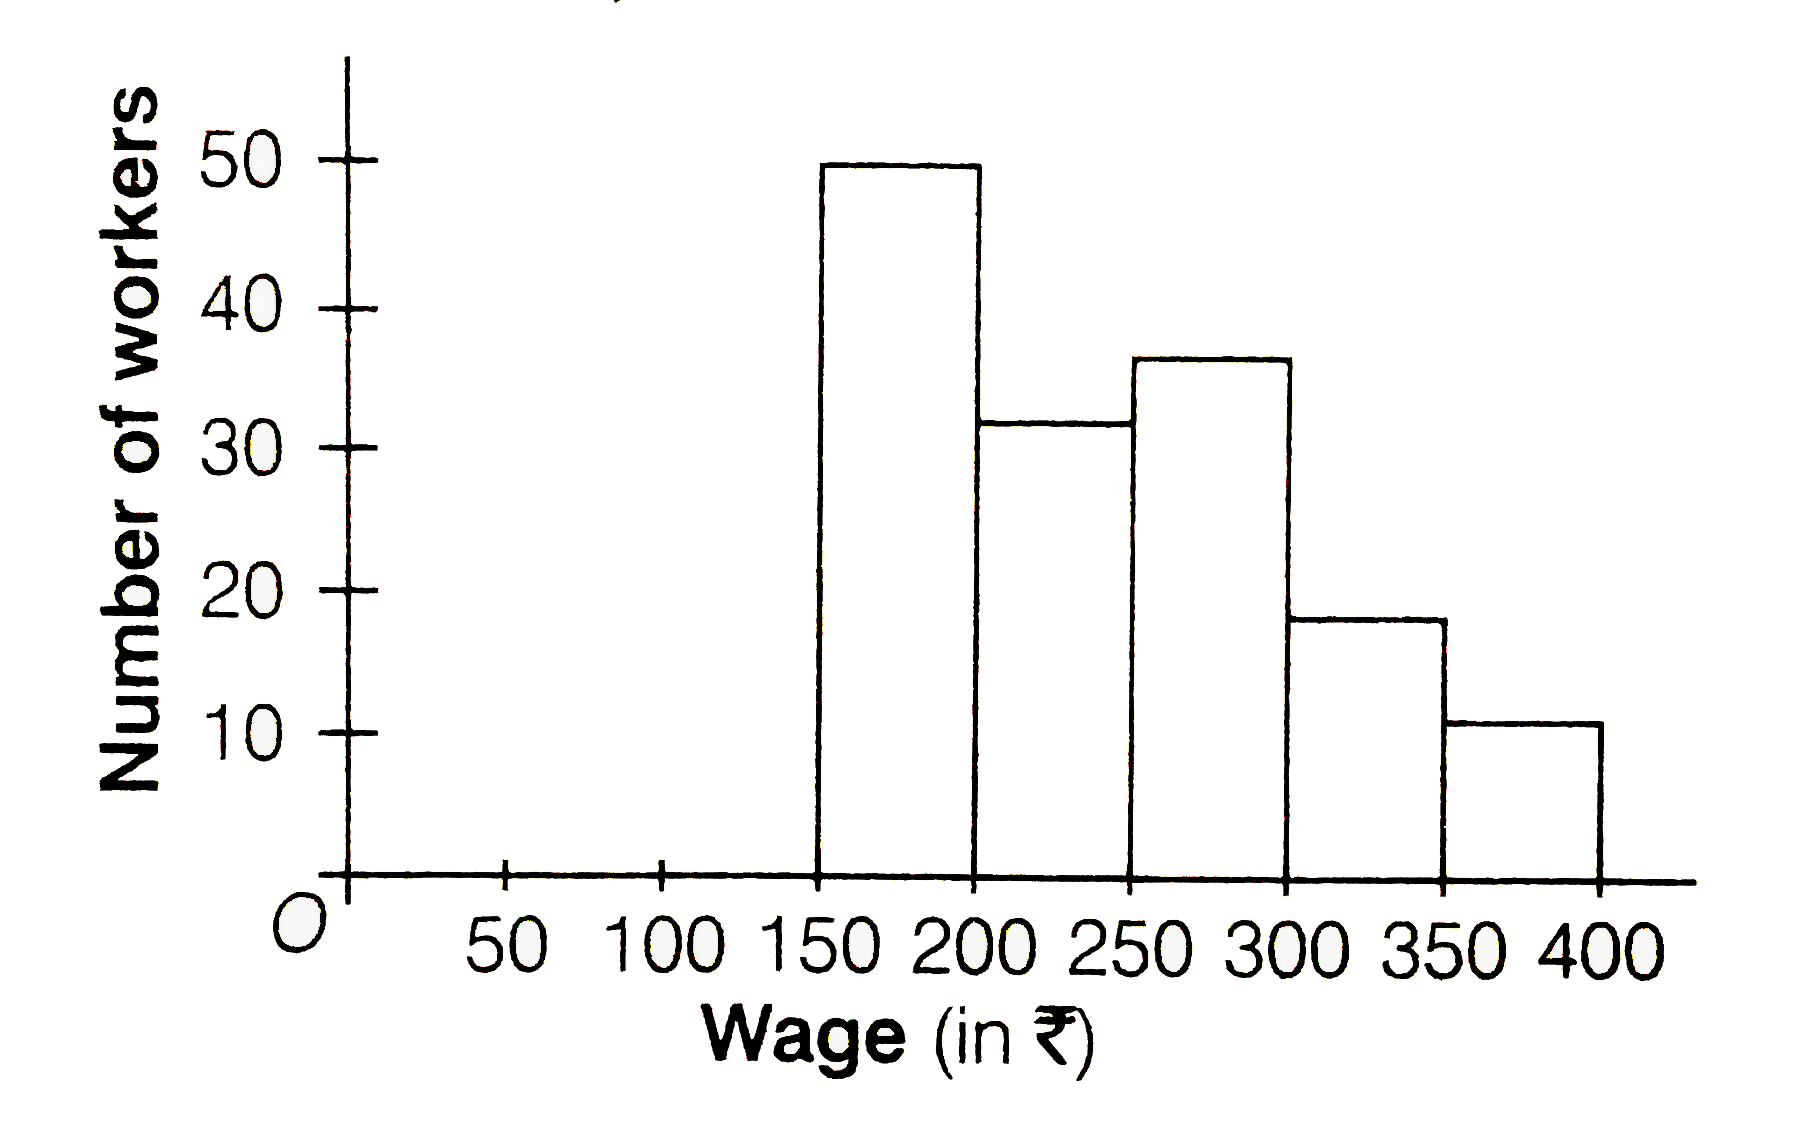
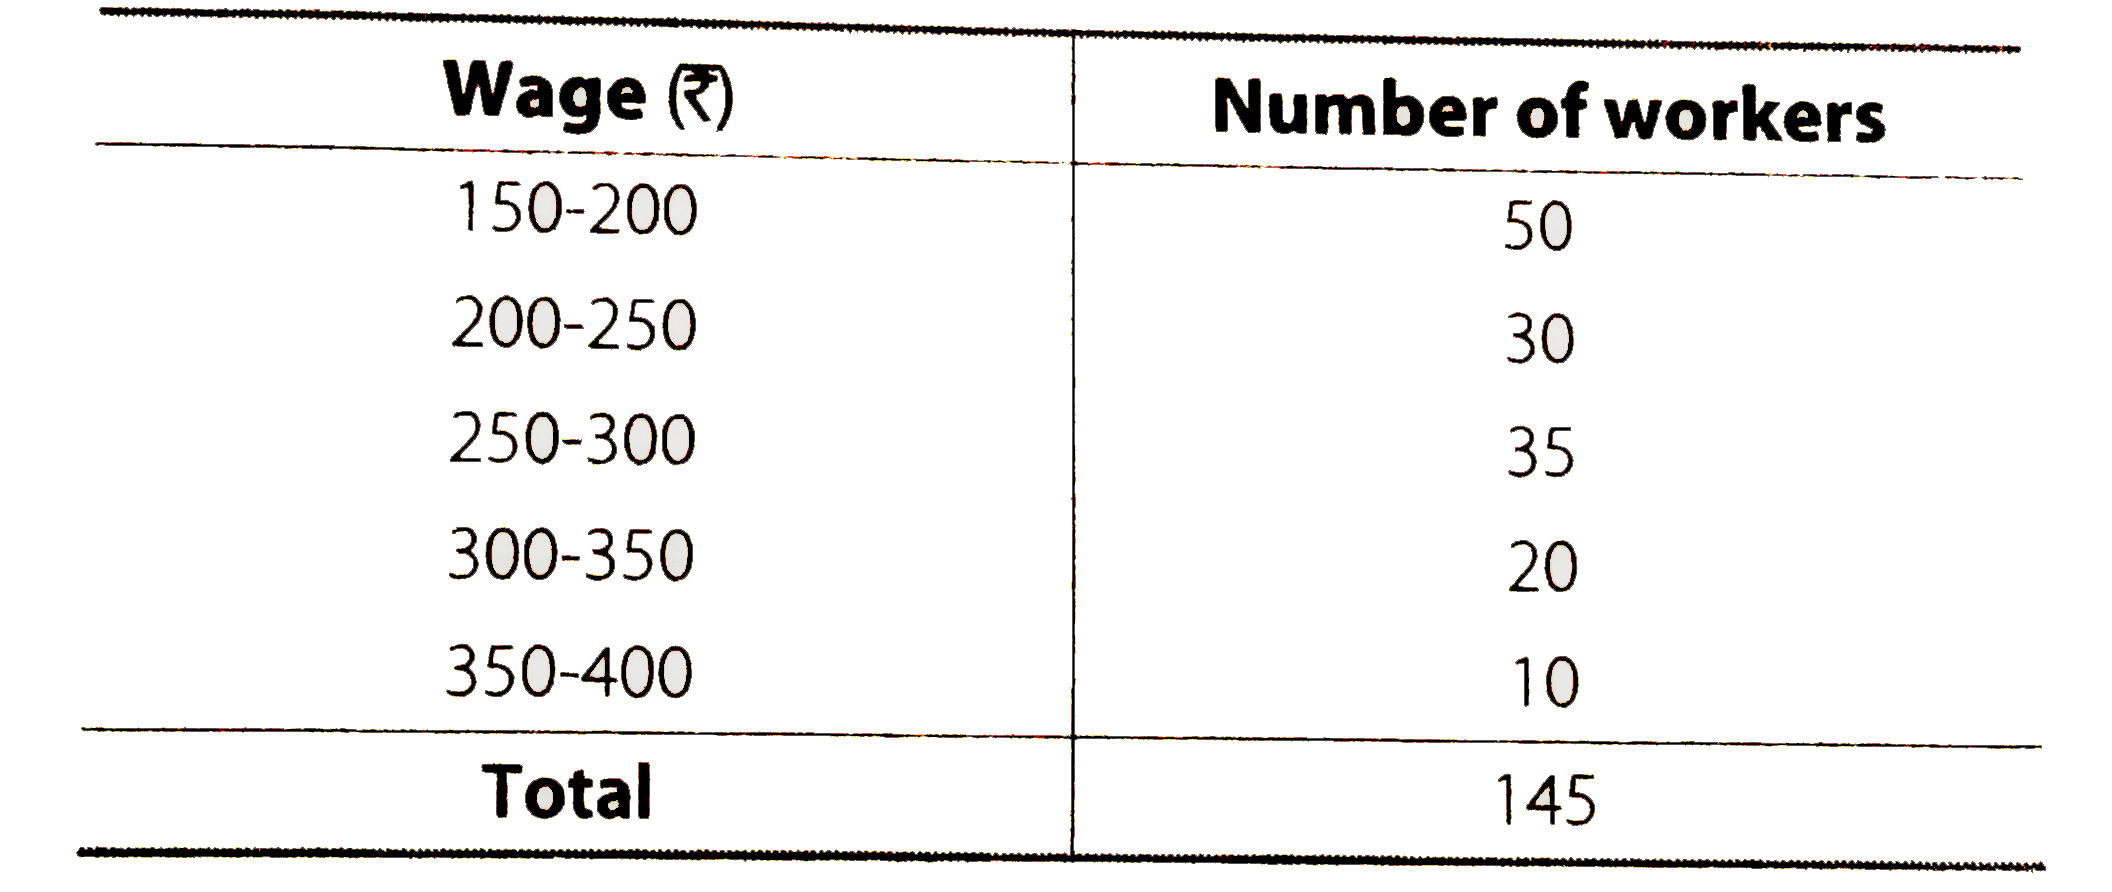
In the figure, there is histrogram depicting daily wages of workers in a factory. Construct the frequency distribution table.

It is clear from the histogram that class interval start from 150-200, 200-250, having width
The frequency distribution table is given below.

Topper's Solved these Questions
- STATISTICS AND PROBABILITYBook:NCERT EXEMPLAR ENGLISHChapter:STATISTICS AND PROBABILITYExercise:LONG ANSWER TYPE QUESTIONS
Explore 12 Videos
- STATISTICS AND PROBABILITYBook:NCERT EXEMPLAR ENGLISHChapter:STATISTICS AND PROBABILITYExercise:VERY SHORT ANSWER TYPES QUESTIONS
Explore 10 Videos
- QUADRILATERALS Book:NCERT EXEMPLAR ENGLISHChapter:QUADRILATERALS Exercise:LONG ANSWER TYPE QUESTIONS
Explore 18 Videos
- TRIANGLESBook:NCERT EXEMPLAR ENGLISHChapter:TRIANGLESExercise:LONG ANSWER TYPE QUESTIONS
Explore 21 Videos
Similar Questions
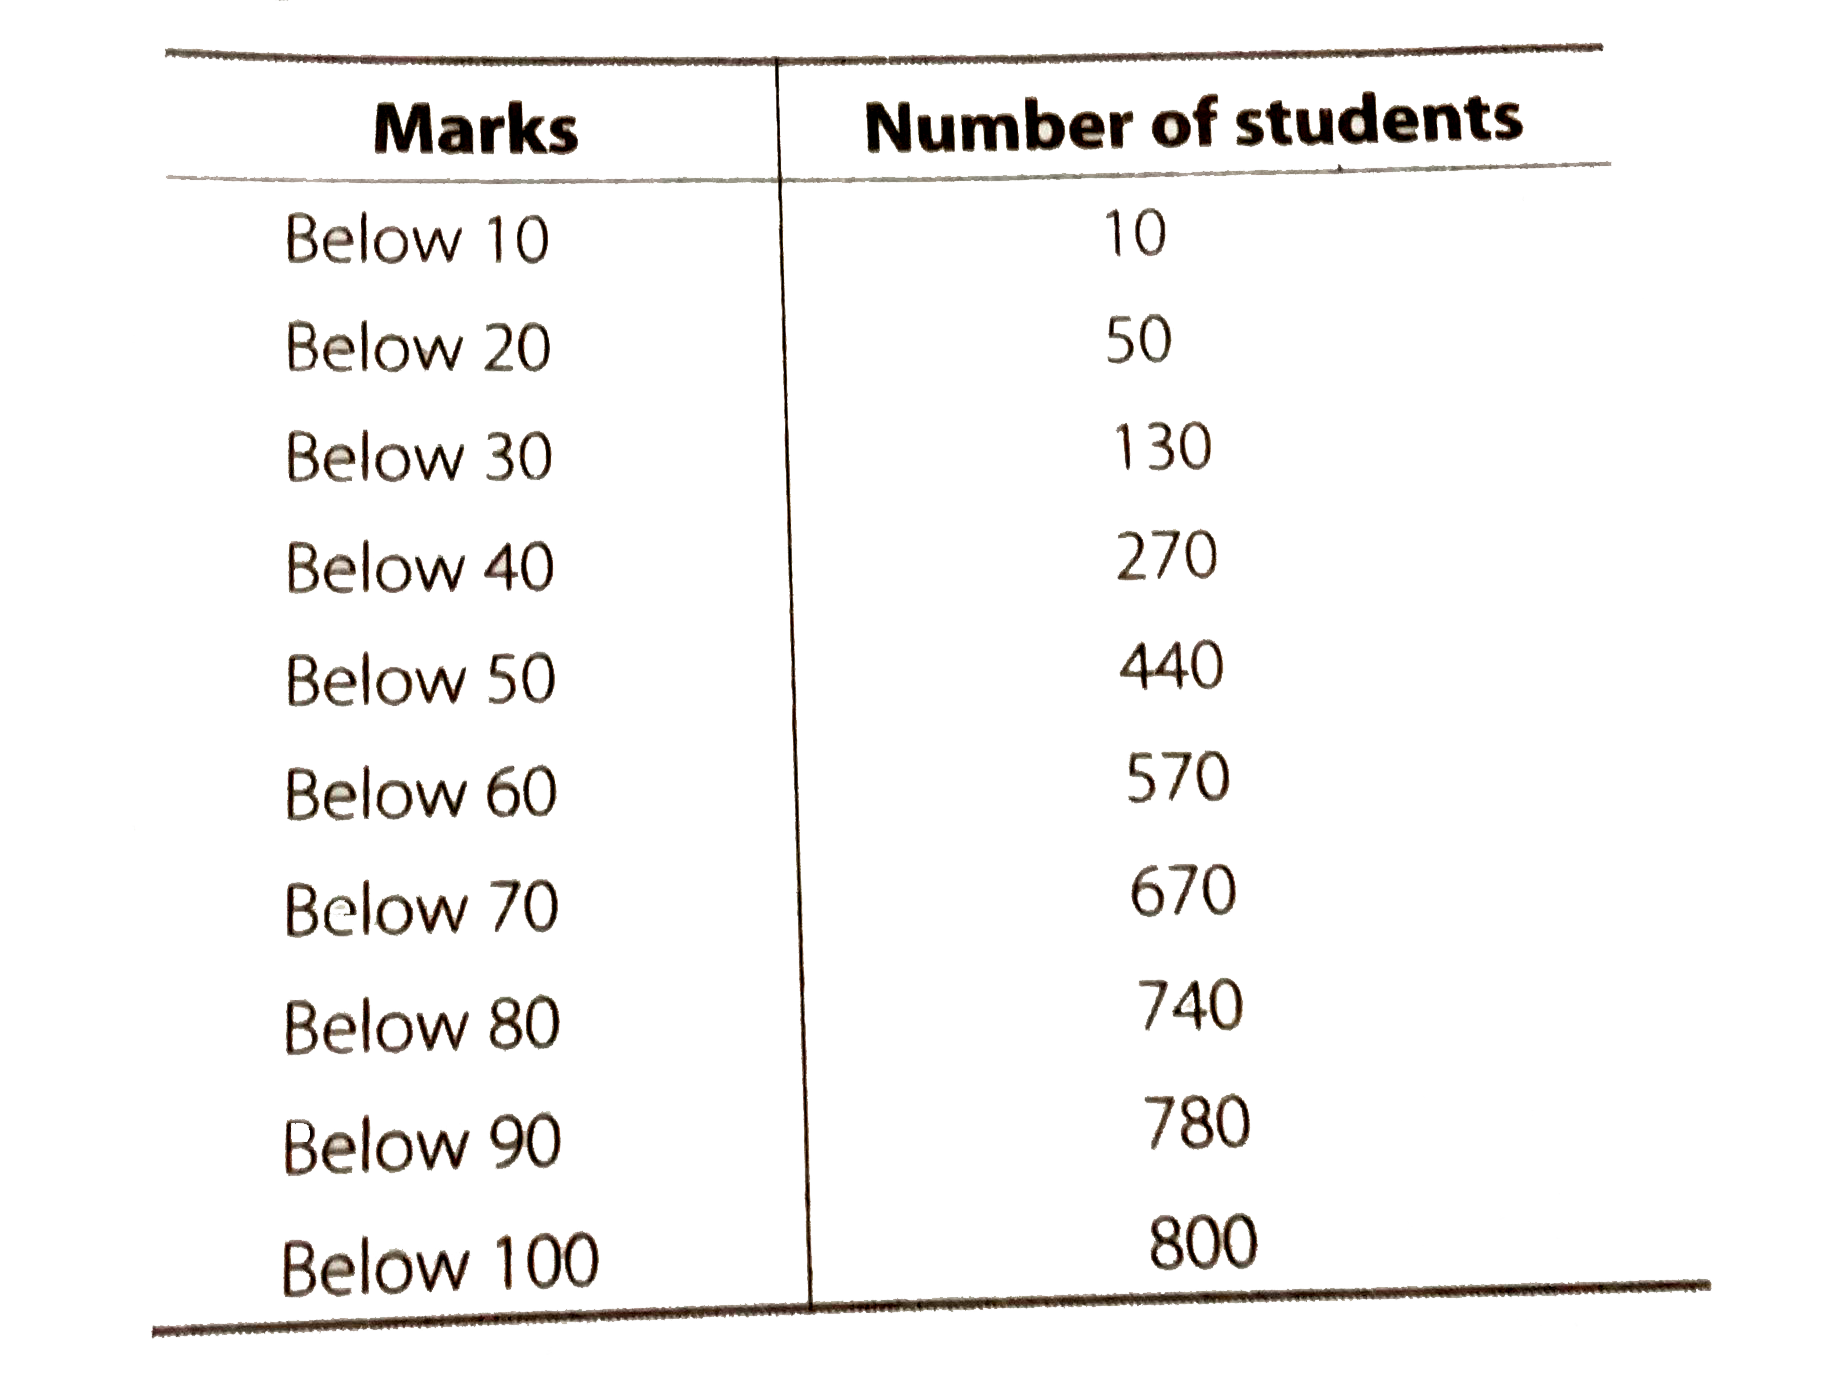
The following table show tha cumulative frequency distribution of marks of 800 students in an examination.

Construct a frequency distribution table for the data above.
View SolutionGiven below is distribution of daily earnings of 60 workers in a factory

Find 45th percentile.
View SolutionFrom the frequency distribution table from the following data

View SolutionFor the following data of daily wages (in rupees0 received by 30 labourers in a certain factory, construct a grouped frequency distribution table by dividing the range into class intervals of equal width, each corresponding to 2 rupees, in such a way that the mid-value of the first class interval corresponds to 12 rupees. 14,16,16,14,22,13,15,24,12,23,14,20,17,21,22,18,18,19,20,17,16,15,11,12,21,20,17,18,19,23
View SolutionFor the following data of daily wages (in rupees0 received by 30 labourers in a certain factory, construct a grouped frequency distribution table by dividing the range into class intervals of equal width, each corresponding to 2 rupees, in such a way that the mid-value of the first class interval corresponds to 12 rupees. 14,16,16,14,22,13,15,24,12,23,14,20,17,21,22,18,18,19,20,17,16,15,11,12,21,20,17,18,19,23
View SolutionThe following table gives the weekly wage of workers in a factory:

Find the mean
View SolutionThe following is the distribution of weights (in kg) of 40 persons.

Construct a cumulative frequency distribution (of the less than type) table for the data above.
View SolutionConsider the following distribution of daily wages of 50 workers of a factory.Find the mean daily wages of the workers of the factor}- by using an appropriate method.
View Solutionfind the mean salary of 60 workers of a factory from the given table
View SolutionThe daily wages in a factory are distributed as follows

Draw a frequency polygon for this distribution.
View Solution
