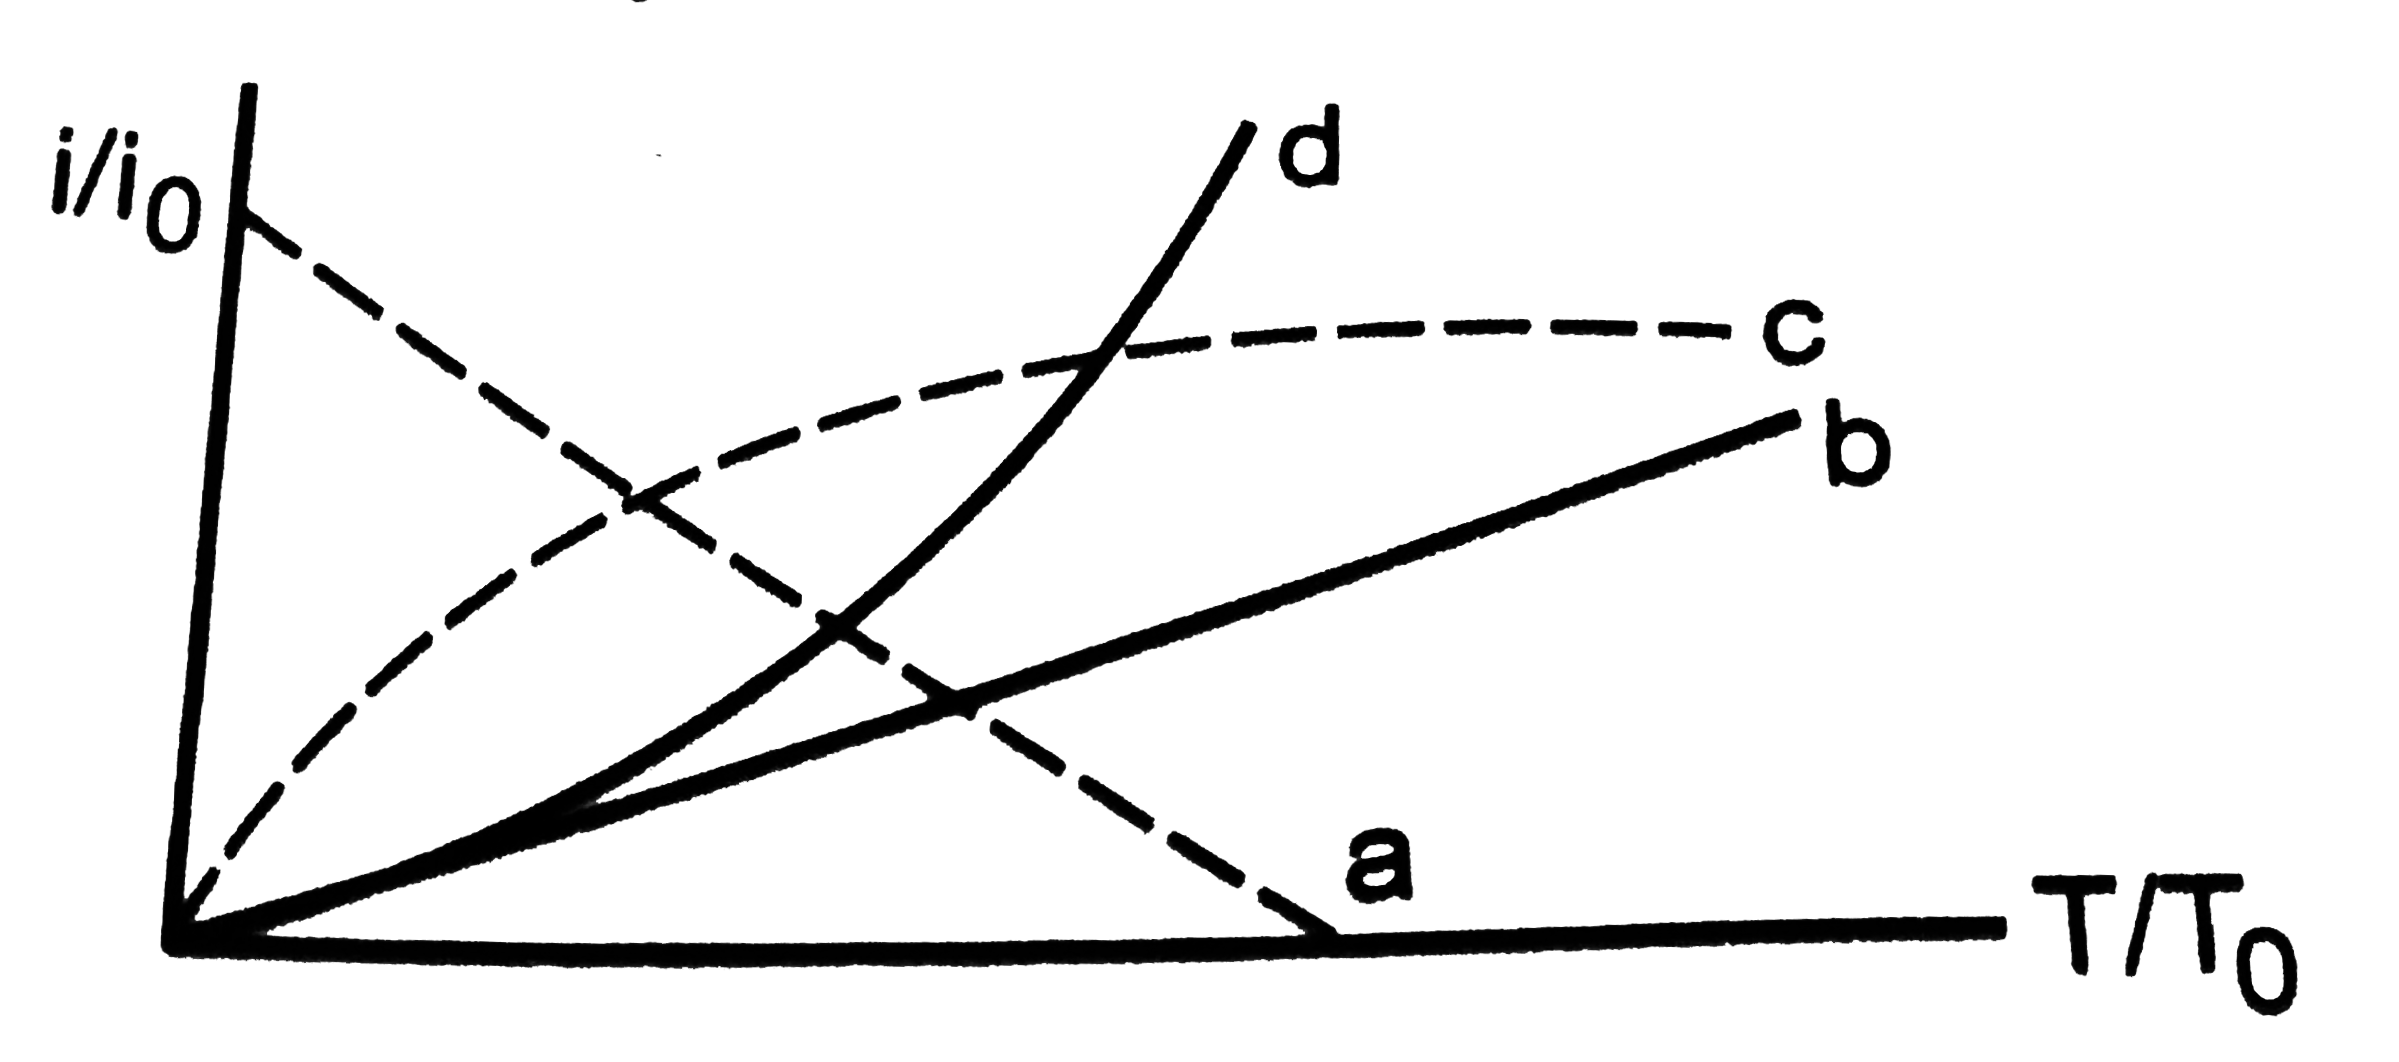
A student heats a beaker containing ice and water. He measures the temperature of the content of the beaker as a function of lime. Which of the following would correctly represent the result ? Justify your choice .

Figure (b) would correctly represent the result. Because when heat is provided to the mixture of water and ice at 0∘C , the ice absorbs this heat and converts it into a water at 0∘C . During this period, there is no rise in temperature. On further heating, the temperature starts rising.
This is because , in ice (solid), the particles attract one another with strong forces. The heat which we supply to ice during melting is all used up to overcome the forces of attraction between ice particles, so that they become loose and form liquid water.
This heat does not increase the kinetic energy of particles and hence no rise in temperature takes place during the melting of ice. When all the ice has melted forming water, further heating increases the kinetic enregy of water, due to which the temperature of water starts rising sharply.
Similar Questions
A glass tumbler containing hot water is kept in the freezer compartment of a refrigerator (temperature <0∘C). If you could measure the temperature of the content of the tumbler , which of the following graphs would correctly represent the change in its temperature as a function of time.
View SolutionLet i0 be the thermionic current from a metal surface when the absolute temperature of the surface is T0. The temperature is slowly increased and the thermionic current is measured as a function of temperature. Which of the following plots may represent the variation in (ii0) against (TT0) ?

View Solution
Knowledge Check

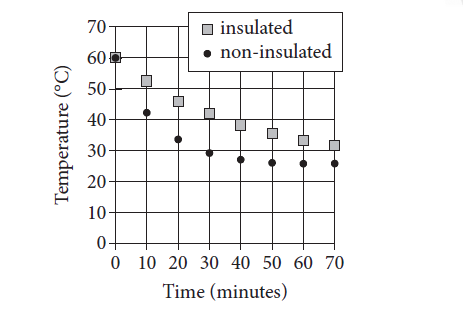
Two samples of water of equal mass are heated to 60 degrees Celsius (°C). One sample is poured into an insulated container, and the other sample is poured into a non-insulated container. The samples are then left for 70 minutes to cool in a room having a temperature of 25°C. The graph above shows the temperature of each sample at 10-minute intervals. Which of the following statements correctly compares the average rates at which the temperatures of the two samples change?AIn every 10-minute interval, the magnitude of the rate of change of temperature of the insulated sample is greater than that of the non-insulated sample.BIn every 10-minute interval, the magnitude of the rate of change of temperature of the non-insulated sample is greater than that of the insulated sample.CIn the intervals from 0 to 10 minutes and from 10 to 20 minutes, the rates of change of temperature of the insulated sample are of greater magnitude, whereas in the intervals from 40 to 50 minutes and from 50 to 60 minutes, the rates of change of temperature of the non-insulated sample are of greater magnitude.DIn the intervals from 0 to 10 minutes and from 10 to 20 minutes, the rates of change of temperature of the non-insulated sample are of greater magnitude, whereas in the intervals from 40 to 50 minutes and from 50 to 60 minutes, the rates of change of temperature of the insulated sample are of greater magnitude.Luciano measured the amount of water that evaporated over a period of time from a container holding w ounces of water, where w is greater than 12. By the end of the first day, the cub had lost 2 ounces of water. By the end of the 7th day, the cup had lost an additional 8 ounces of water. By the end of the 11th day, the cup had lost half of the water that remained after the 7th day. Which of the following represents the remaining amount of water, in ounces, in Luciano's container at the end of the 11th day?
Aw−28Bw−22−10C12w−10Dw−102
A block of metal is heated to a temperature much higher than the room temperature and allowed to cool in a room free from air currents. Which of the following curves correctly represents the rate of cooling
View SolutionA piece of ice is floating in a beaker containing thick sugar solution of water. As the ice melts, the total level of he liquid
View SolutionThree beakers labelled as A, B and C each containing 25 mL of water were taken. A small amount of NaOH, anhydrous CuSO4 and NaCl were added to the beakers A, B and C respectively. It was observed that there was an increase in the temperature of the solutions contained in beakers A and B, whereas in case of beaker C, the temperature of the solution falls. Which one of the followig statement (s) is (are) correct?
1. In beakers A and B, exothermic process has occurred.
2. In beakers A and B, endothermic process has occurred.
3. In beaker C, exothermic process has occurred.
4. In beaker C, endothermic process has occurred.
View Solution100 mL of 0.1 HCl is taken in a beaker and to it 100 mL of 0.1 M NaOH is added in steps of 2ml and the pH is continuously measured . Which of the following graphs correctly depicts the change in pH
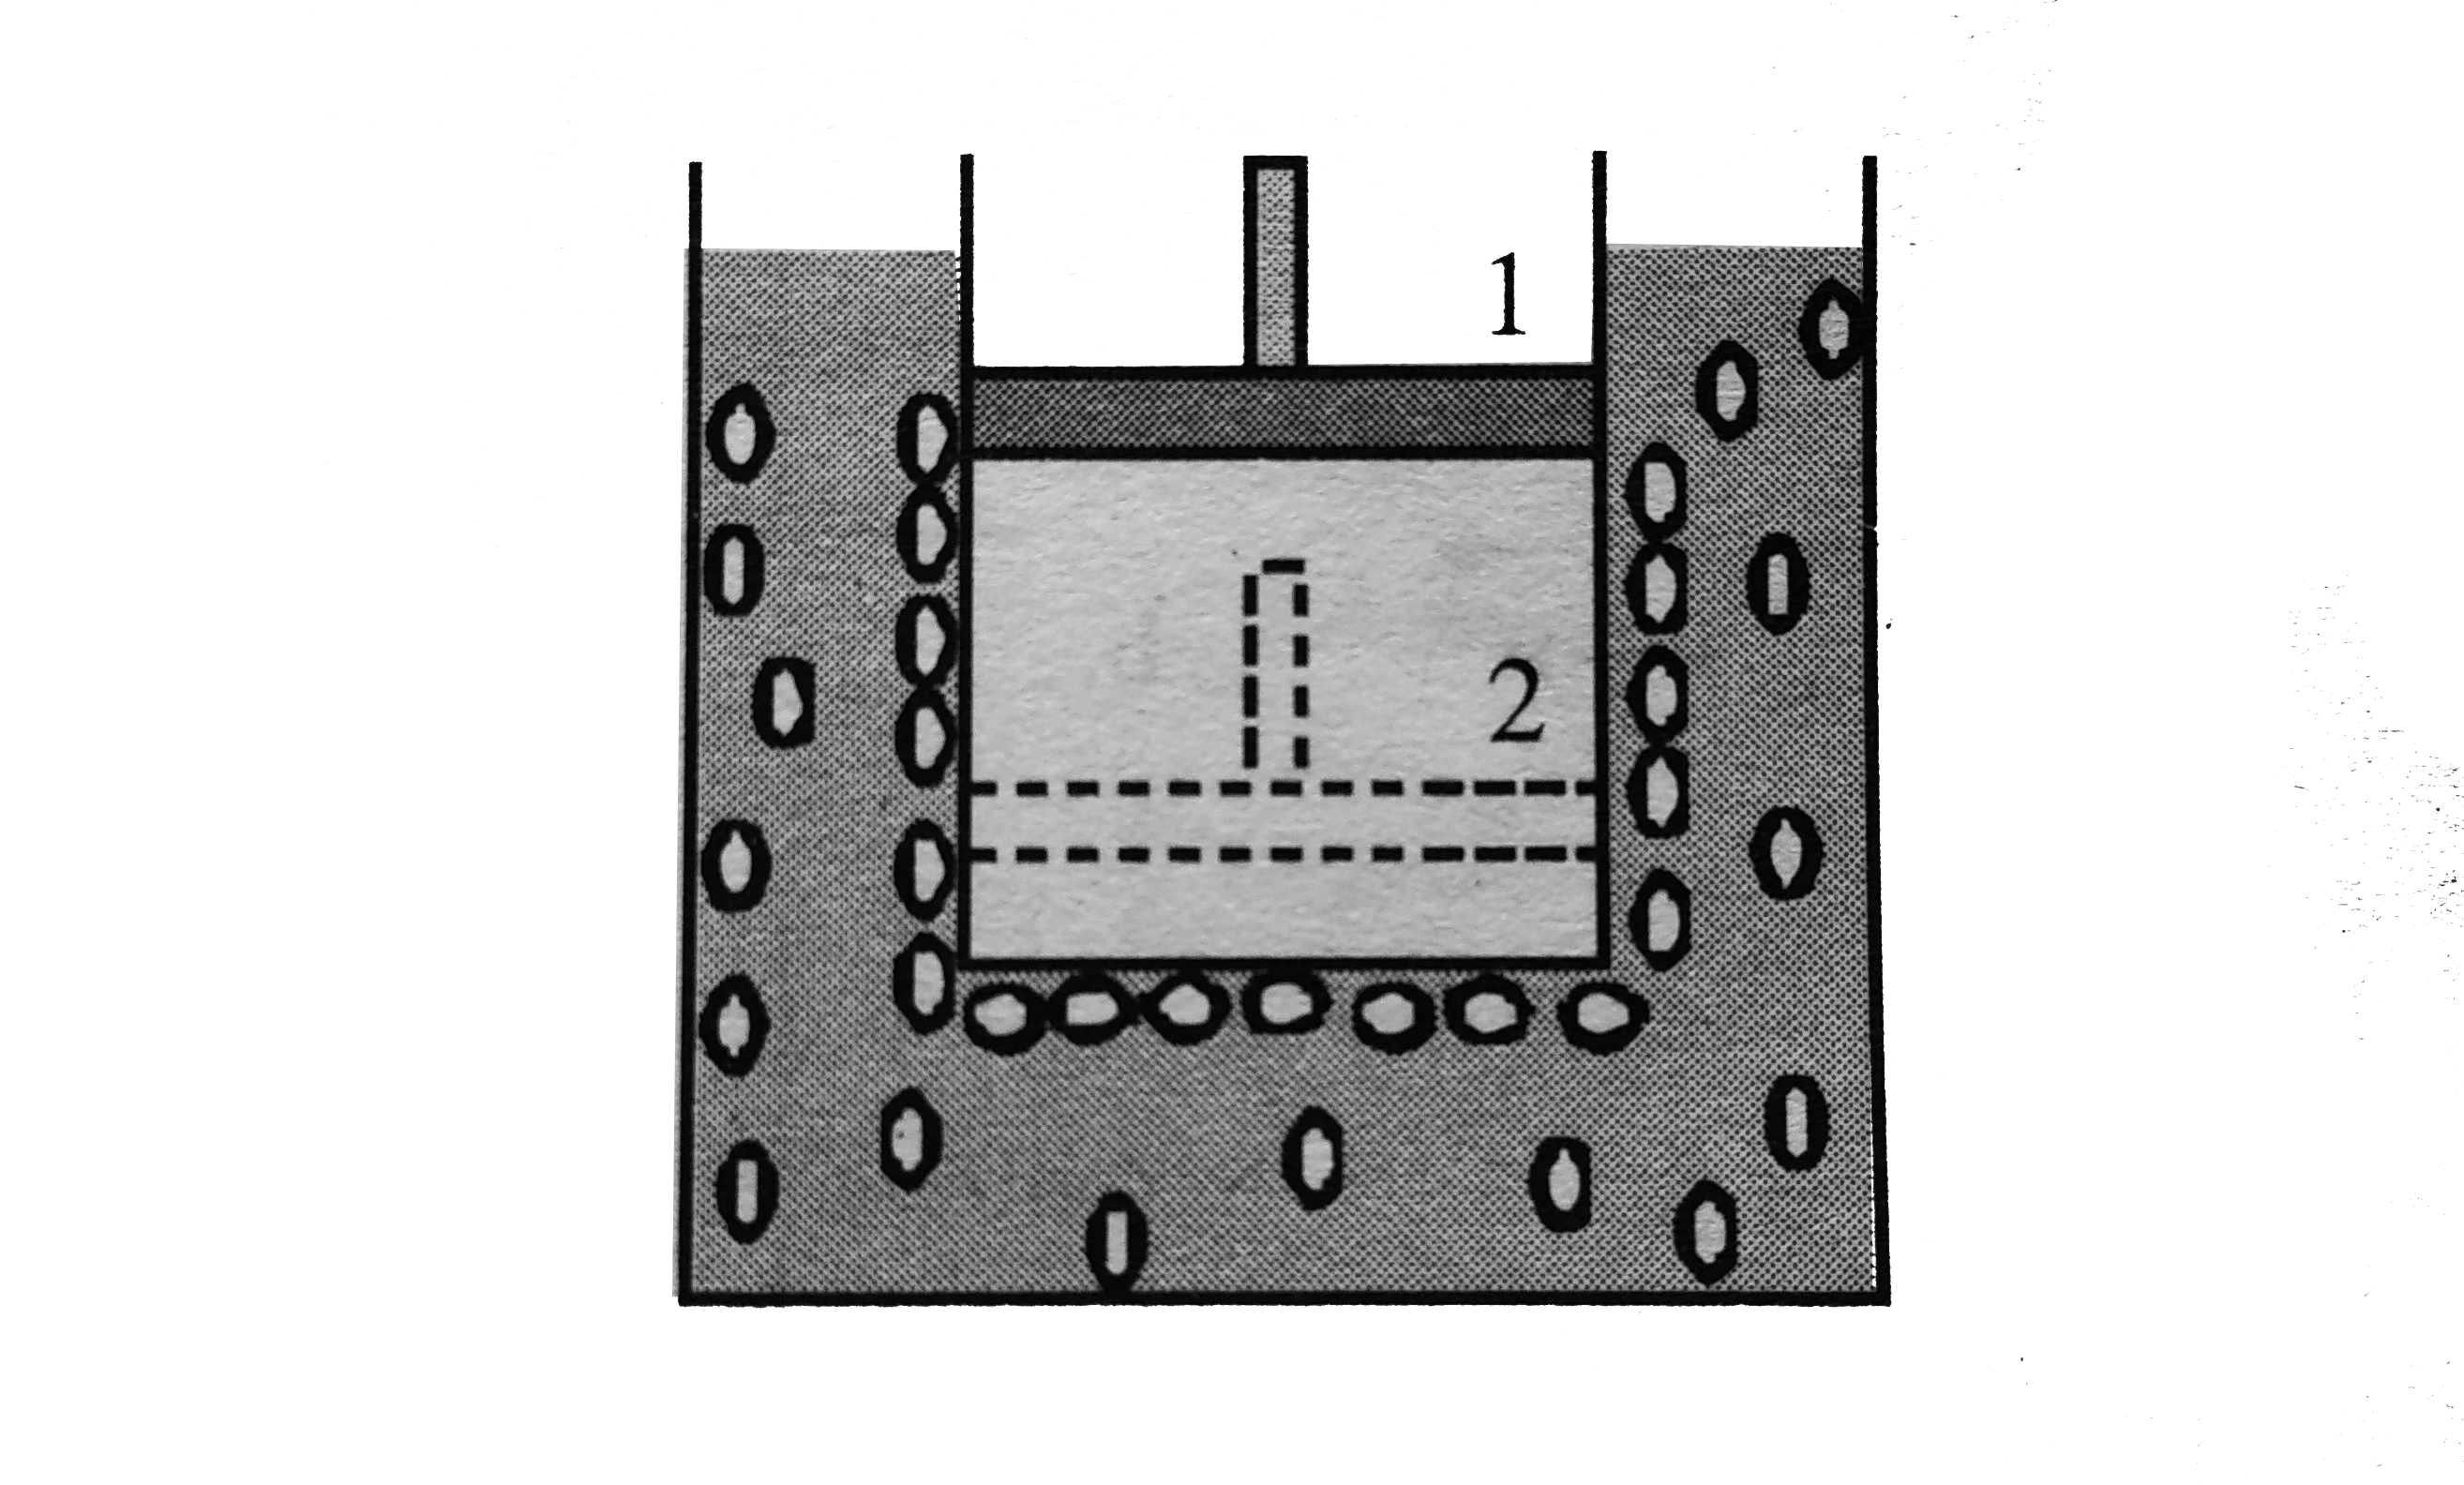
View SolutionA cylinder containing an ideal gas ( see figure ) and closed by a movable pistong is submerged in an ice- water mixture. The pistone is quickly pushed down from position (1) to position (2)( process AB). The piston is held at position (2) until the gas is again at 0∘C ( processs BC). Then the pistone is slowly raised back to position (1) ( process CA)

Which of the following P−V diagram will correctly represent the processes AB,BC and CA and the cycle ABCA?
View SolutionA cylinder containing an ideal gas ( see figure ) and closed by a movable pistong is submerged in an ice- water mixture. The pistone is quickly pushed down from position (1) to position (2)( process AB). The piston is held at position (2) until the gas is again at 0∘C ( processs BC). Then the pistone is slowly raised back to position (1) ( process CA)

Which of the following P−V diagram will correctly represent the processes AB,BC and CA and the cycle ABCA?
View Solution

