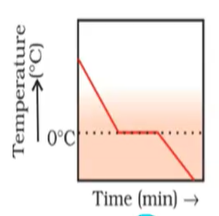
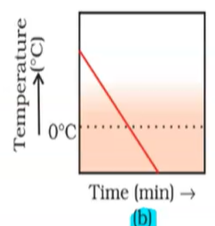
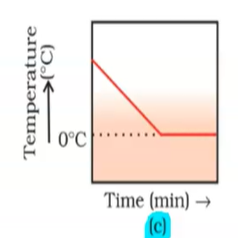
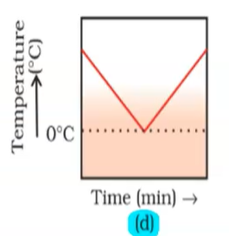
A student heats a beaker containing ice and water. He measures the temperature of the content of the beaker as a function of lime. Which of the following would correctly represent the result ? Justify your choice .

Figure (b) would correctly represent the result. Because when heat is provided to the mixture of water and ice at 0∘C , the ice absorbs this heat and converts it into a water at 0∘C . During this period, there is no rise in temperature. On further heating, the temperature starts rising.
This is because , in ice (solid), the particles attract one another with strong forces. The heat which we supply to ice during melting is all used up to overcome the forces of attraction between ice particles, so that they become loose and form liquid water.
This heat does not increase the kinetic energy of particles and hence no rise in temperature takes place during the melting of ice. When all the ice has melted forming water, further heating increases the kinetic enregy of water, due to which the temperature of water starts rising sharply.
Topper's Solved these Questions
Similar Questions
A glass tumbler containing hot water is kept in the freezer compartment of a refrigerator (temperature <0∘C). If you could measure the temperature of the content of the tumbler , which of the following graphs would correctly represent the change in its temperature as a function of time.
View Solution100 g of ice at −15∘C was heated. The rise in temperature of ice was plotted against the heat given to ice. Which of the following graphs (Fig. 6.2) correctly depicts this behaviour?
View Solution
Knowledge Check
When water in a beaker freezes to form ice, then which of the following will be correct statement:
ASsystemdecreases whereasSsurroundingincreasesBSsystemandSsurrounding both increasesCSsystemincreases whereas Ssurrounding decreasesDSsystemandSsurrounding both increasesA piece of ice is heated and the temperature is monitored as a function of time .Which of the following figures will justify the observation ?
A B
B C
C D
D
A glass tumbler containing hot water is kept in the freezer compartment of a refrigerator (temperature <0∘C). If you could measure the temperature of the content of the tumbler , which of the following graphs would correctly represent the change in its temperature as a function of time.
A B
B C
C D
D
A beaker containing 2 kg of ice at 0∘ C is floating in a bucket that contains 5 kg of water at 0∘ C. Which of the following statements is correct regarding this?
View SolutionA block of metal is heated to a temperature much higher than the room temperature and allowed to cool in a room free from air currents. Which of the following curves correctly represents the rate of cooling
View SolutionWater in a lake starts freezing if temperature of surrounding is −20∘C. The graph between thickness of ice y and time is plotted. Which of the following graph correctly represents this situation?
View SolutionA student mixed some soil with water in a beaker and allowed it to settle. He filtered the contents of the beaker and obtained a clear filtrate. When he put a few drops of the filtrate on the pH paper, the pH paper turned yellowish orange. Which of the following should the student put on this pH paper so that it may change its colour to greenish blue?
View SolutionA student takes 1 g of sodium hydroxide. He adds it to 50 mL of water taken in a plastic bottle and shakes the content well. Which of the following observation is correct?
View Solution