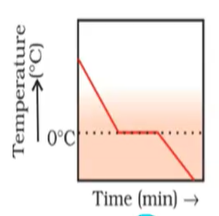
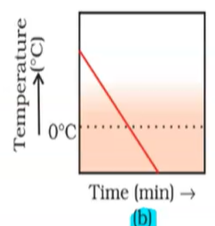
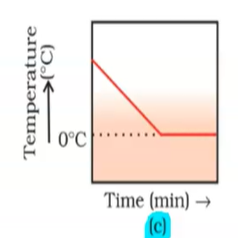
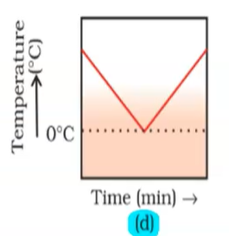
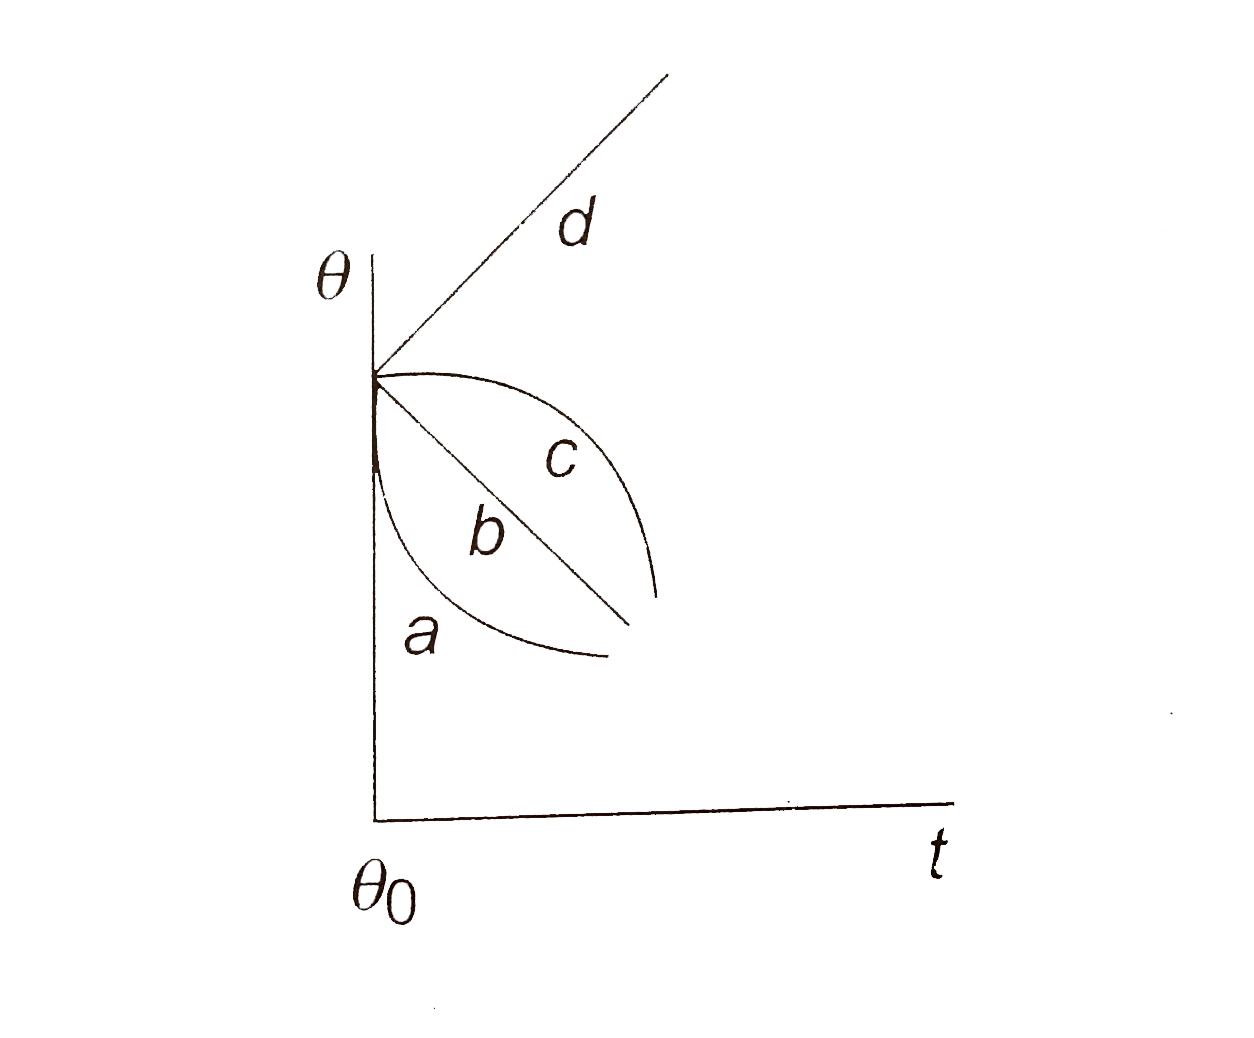
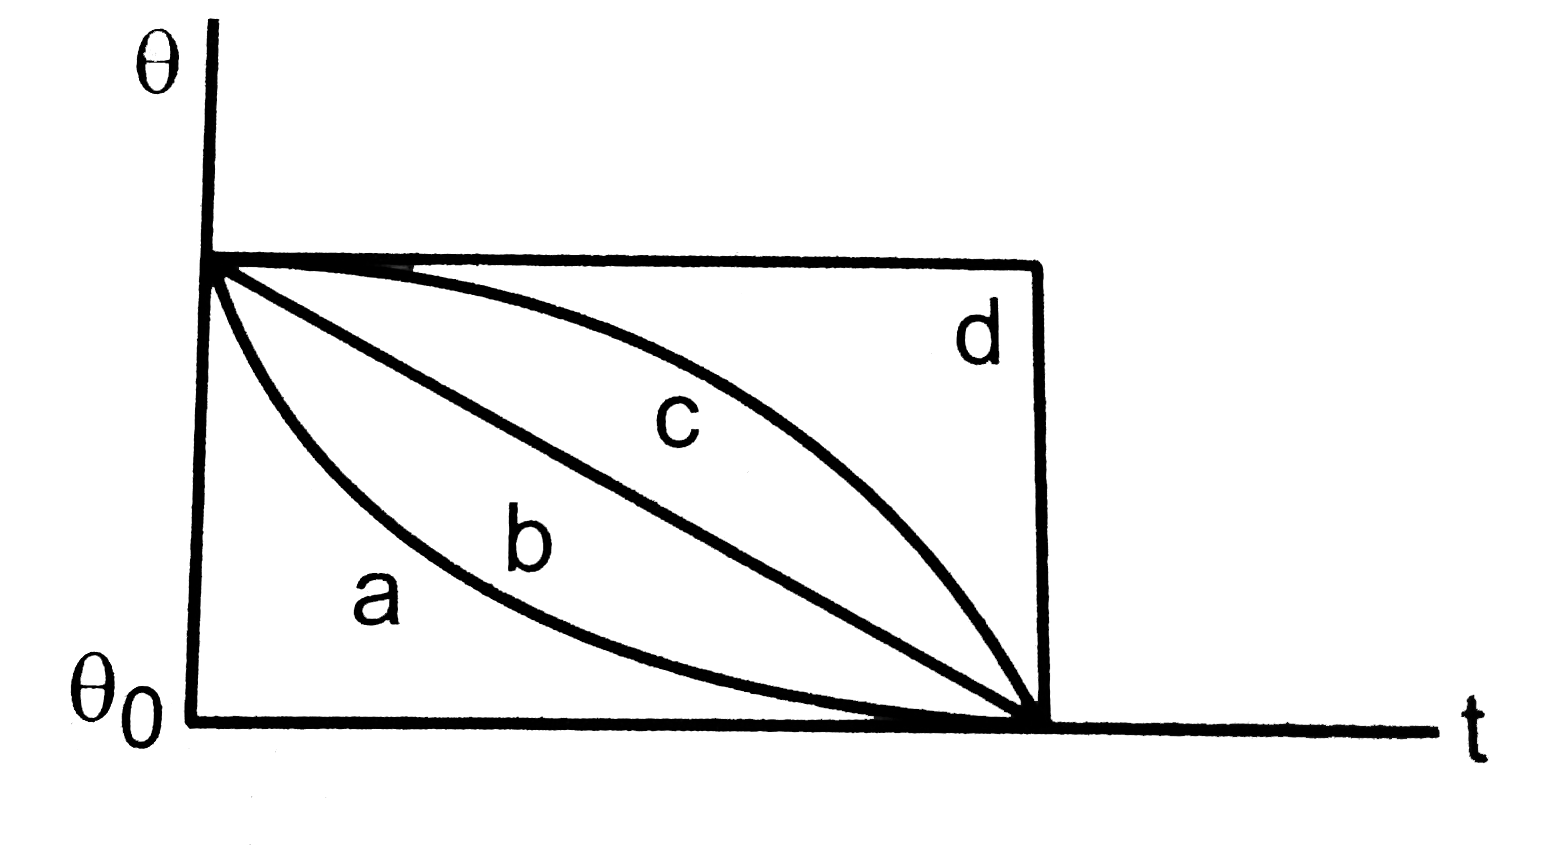
A glass tumbler containing hot water is kept in the freezer compartment of a refrigerator (temperature <0∘C). If you could measure the temperature of the content of the tumbler , which of the following graphs would correctly represent the change in its temperature as a function of time.
The correct Answer is:A
Figure (a) represents the change of temperature with time correctly. The temperature of water first decreases up to zero degree celcius, then remains constant for some time (till the ice is formed), then again starts decreasing.
Topper's Solved these Questions
Similar Questions
A student heats a beaker containing ice and water. He measures the temperature of the content of the beaker as a function of lime. Which of the following would correctly represent the result ? Justify your choice .

View SolutionA student heats a beaker containing ice and water. He measures the temperature of the content of the beaker as a function of lime. Which of the following would correctly represent the result ? Justify your choice .

View Solution
Knowledge Check
A hot liquid is kept in a big room. Its temperature is plotted as a function of time. Which of the following curves may present the plot ?
 AaBbCcDd
Water in a lake starts freezing if temperature of surrounding is −20∘C. The graph between thickness of ice y and time is plotted. Which of the following graph correctly represents this situation?
A B
B C
C D
D
Which of the following graphs most probably represents the temperature changes on a hot and clear day in Delhi between 6 am and 6 pm?
A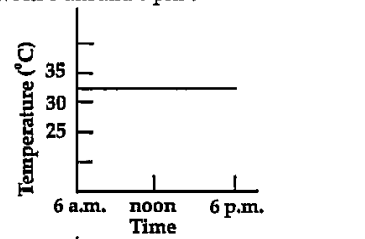 B
B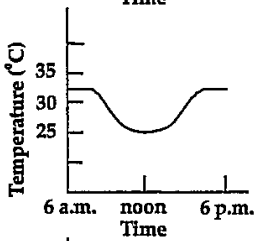 C
C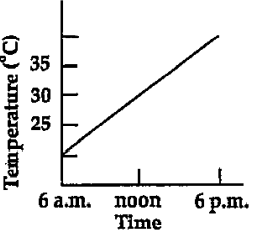 D
D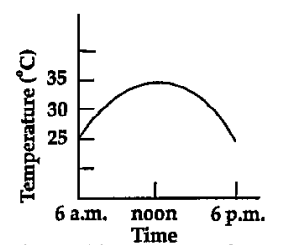
A hot liquid is kept in a big room. Its temperature is plotted as a function of time. Which of the following curves may represent the plot?
View SolutionVinod took a beaker of ice from a freezer and measured its temperature immediately. Then he measured the temperature of the ice in the beaker every 2 minutes. His results are shown in the graph. Vinod noticed during his experiment that the temperature of the ice did not change for a period of time.
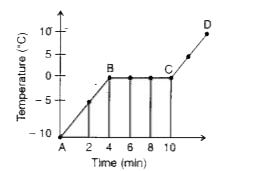
Which part of the graph corresponds to this period of time?
View SolutionVinod took a beaker of ice from a freezer and measured its temperature immediately. Then he measured the temperature of the ice in the beaker every 2 minutes. His results are shown in the graph. Vinod noticed during his experiment that the temperature of the ice did not change for a period of time.
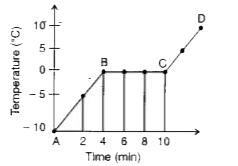
How long was this period of time?
View SolutionVinod took a beaker of ice from a freezer and measured its temperature immediately. Then he measured the temperature of the ice in the beaker every 2 minutes. His results are shown in the graph. Vinod noticed during his experiment that the temperature of the ice did not change for a period of time.
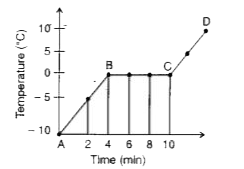
What change did the ice undergo during this period of time?
View SolutionWhich one of the following graphs shows the rate at which heat is emitted from a hot body as a function of its Kelvin temperature T' ?
View Solution
