According to Boyle's law, PV = constant, at constant temperature. Which of the following graphs is correct?
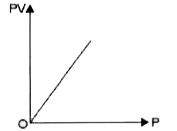
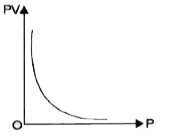
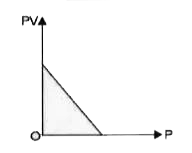
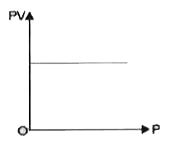
The correct Answer is:D
To solve the question regarding Boyle's law and identify the correct graph, we can follow these steps:
1. Understand Boyle's Law: Boyle's law states that for a given mass of gas at constant temperature, the product of pressure (P) and volume (V) is constant. Mathematically, this can be expressed as:
PV=k
where k is a constant.
2. Identify the Relationship: Since PV is constant, if we increase the pressure (P), the volume (V) must decrease to keep the product PV constant, and vice versa.
3. Analyze the Graphs: We need to evaluate the provided graphs to see which one correctly represents the relationship described by Boyle's law.
- Graph 1: If PV is on the Y-axis and pressure (P) is on the X-axis, as pressure increases, PV should remain constant. This graph would show an increasing trend, which is incorrect.
- Graph 2: If PV is on both axes, as pressure increases, PV should not change. This graph would show a changing trend, which is also incorrect.
- Graph 3: If PV is on the Y-axis and pressure (P) is on the X-axis, and the graph shows a decreasing trend as pressure increases, this indicates that PV is not constant, which is again incorrect.
- Graph 4: This graph shows a horizontal line, indicating that PV remains constant regardless of changes in pressure. This is the correct representation of Boyle's law.
4. Conclusion: Based on the analysis of the graphs, the correct graph that represents Boyle's law is the one that shows PV as a constant value, which is option number 4.
Final Answer:
The correct graph according to Boyle's law is Option 4.
---
PV=k
where k is a constant.
- Graph 2: If PV is on both axes, as pressure increases, PV should not change. This graph would show a changing trend, which is also incorrect.
- Graph 3: If PV is on the Y-axis and pressure (P) is on the X-axis, and the graph shows a decreasing trend as pressure increases, this indicates that PV is not constant, which is again incorrect.
- Graph 4: This graph shows a horizontal line, indicating that PV remains constant regardless of changes in pressure. This is the correct representation of Boyle's law.
The correct graph according to Boyle's law is Option 4.
Topper's Solved these Questions
- MISCELLANEOUS QUESTIONSBOOK - MCGROW HILL PUBLICATIONCHAPTER - MISCELLANEOUS QUESTIONSEXERCISE - PART-B
99 Videos
- MEASUREMENTBOOK - MCGROW HILL PUBLICATIONCHAPTER - MEASUREMENTEXERCISE - ELEMENTARY QUESTIONS (HIGHER ORDER THINKING QUESTIONS)
13 Videos
- MOTIONBOOK - MCGROW HILL PUBLICATIONCHAPTER - MOTIONEXERCISE - HIGHER ORDER THINKING QUESTIONS
48 Videos
Similar Questions
Knowledge Check
Which of the following graph represents Boyle's law ?
A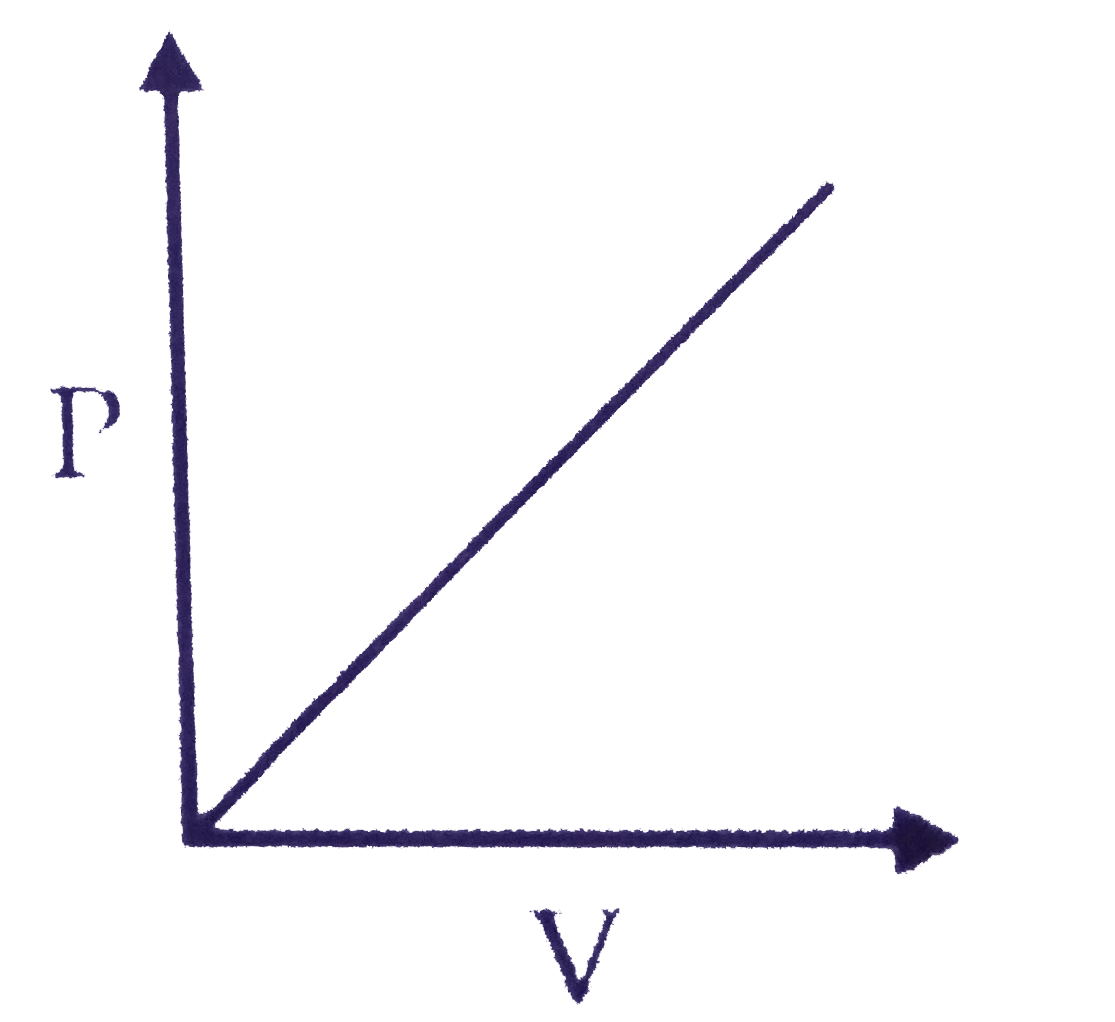 B
B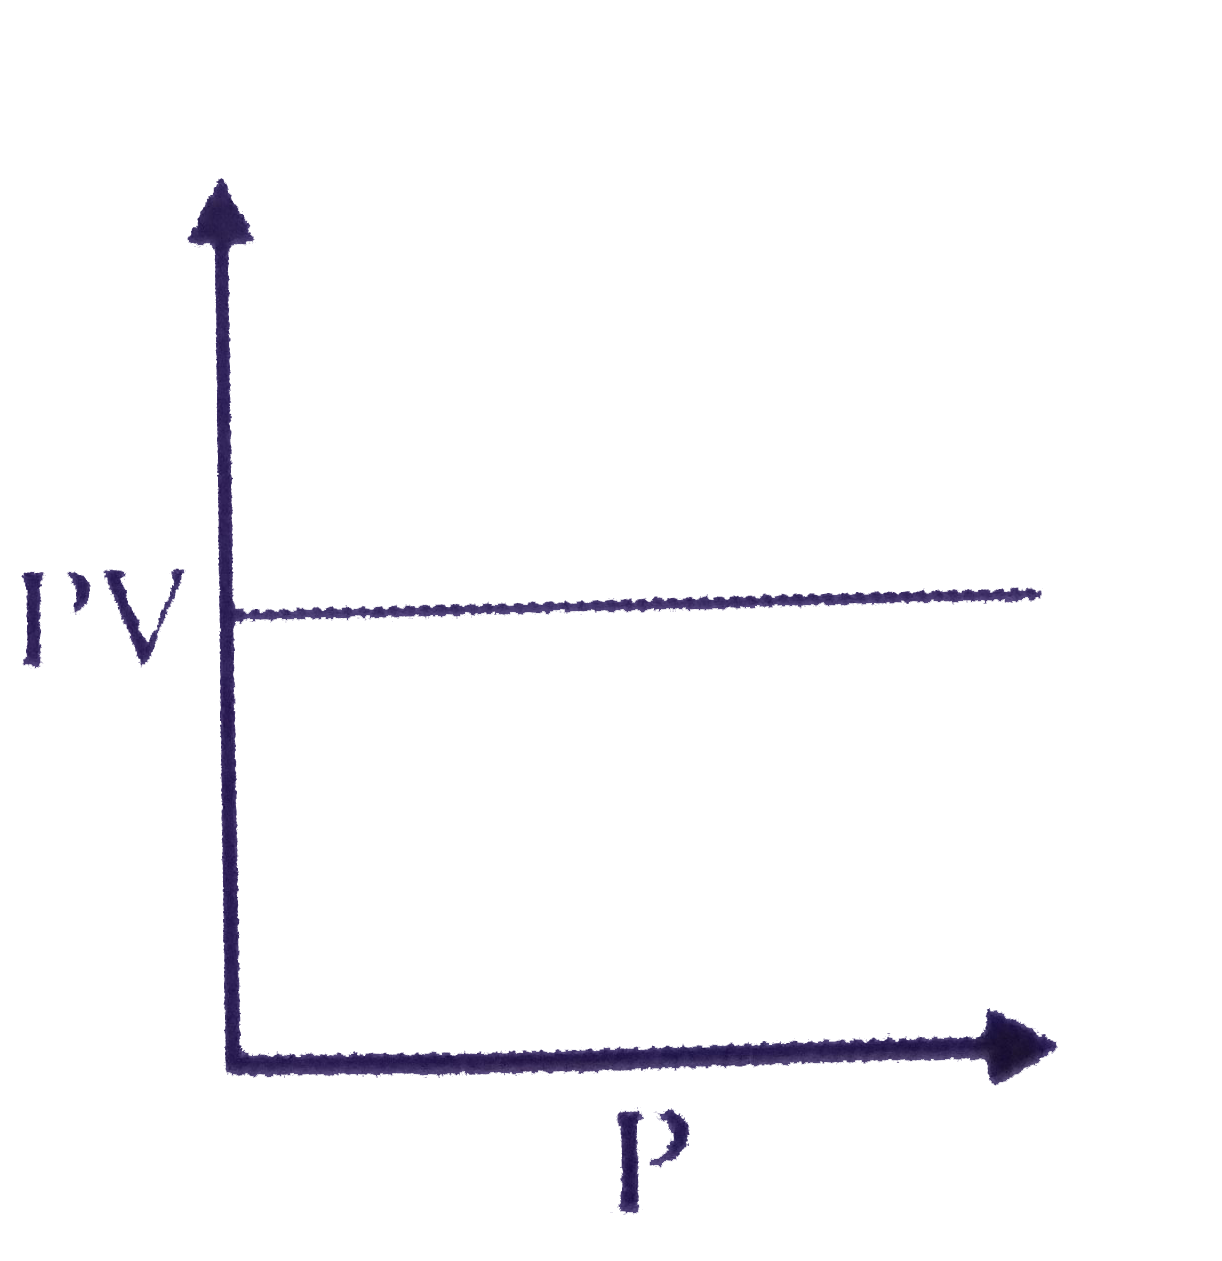 C
C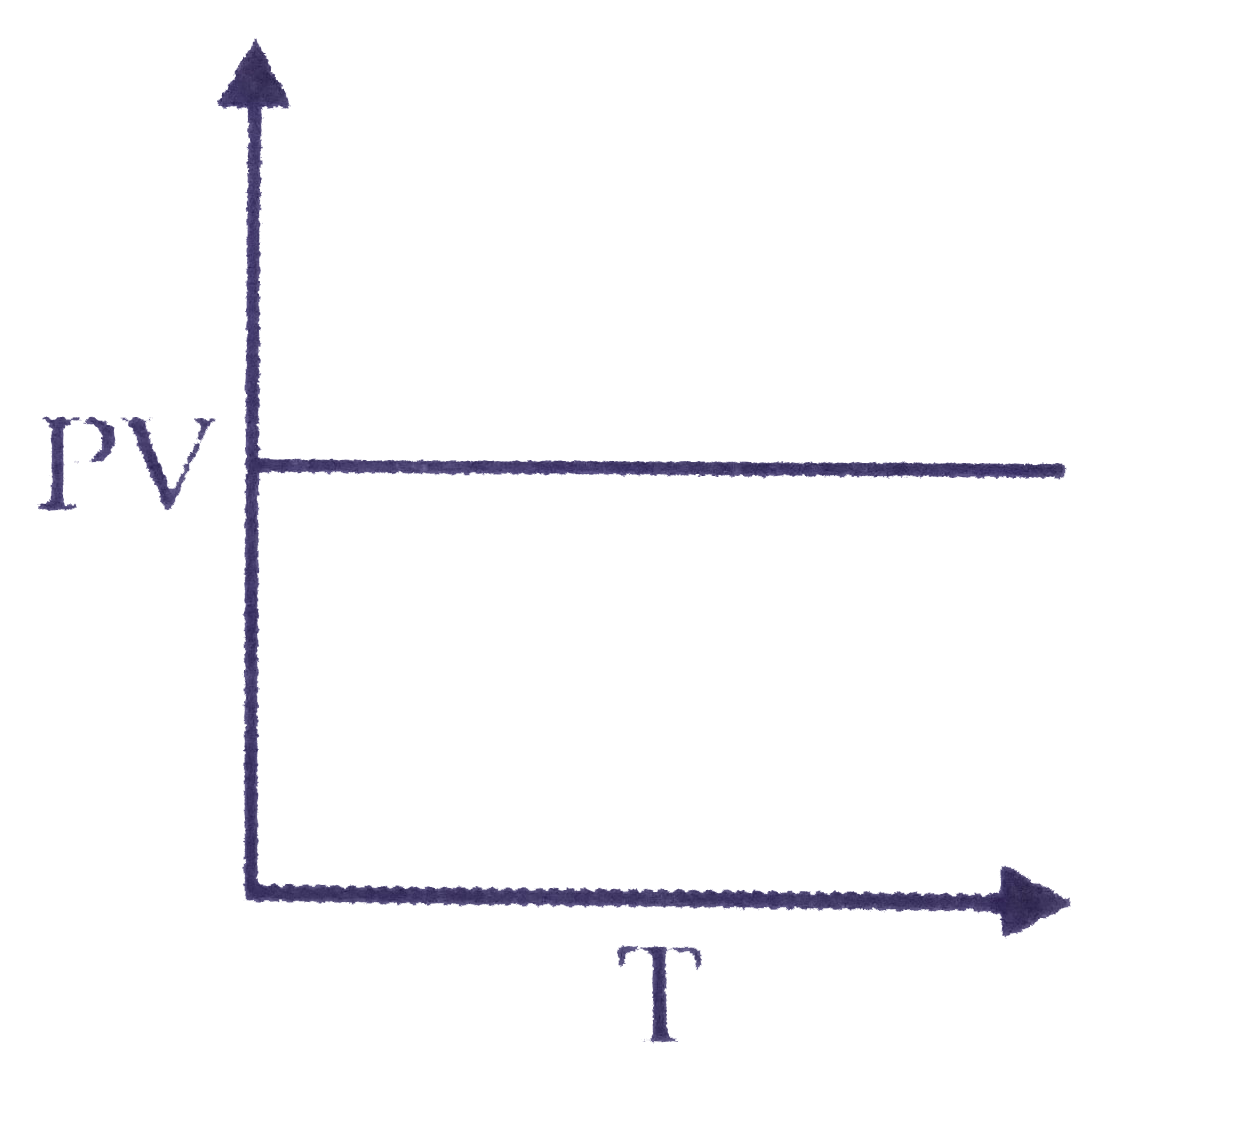 D
D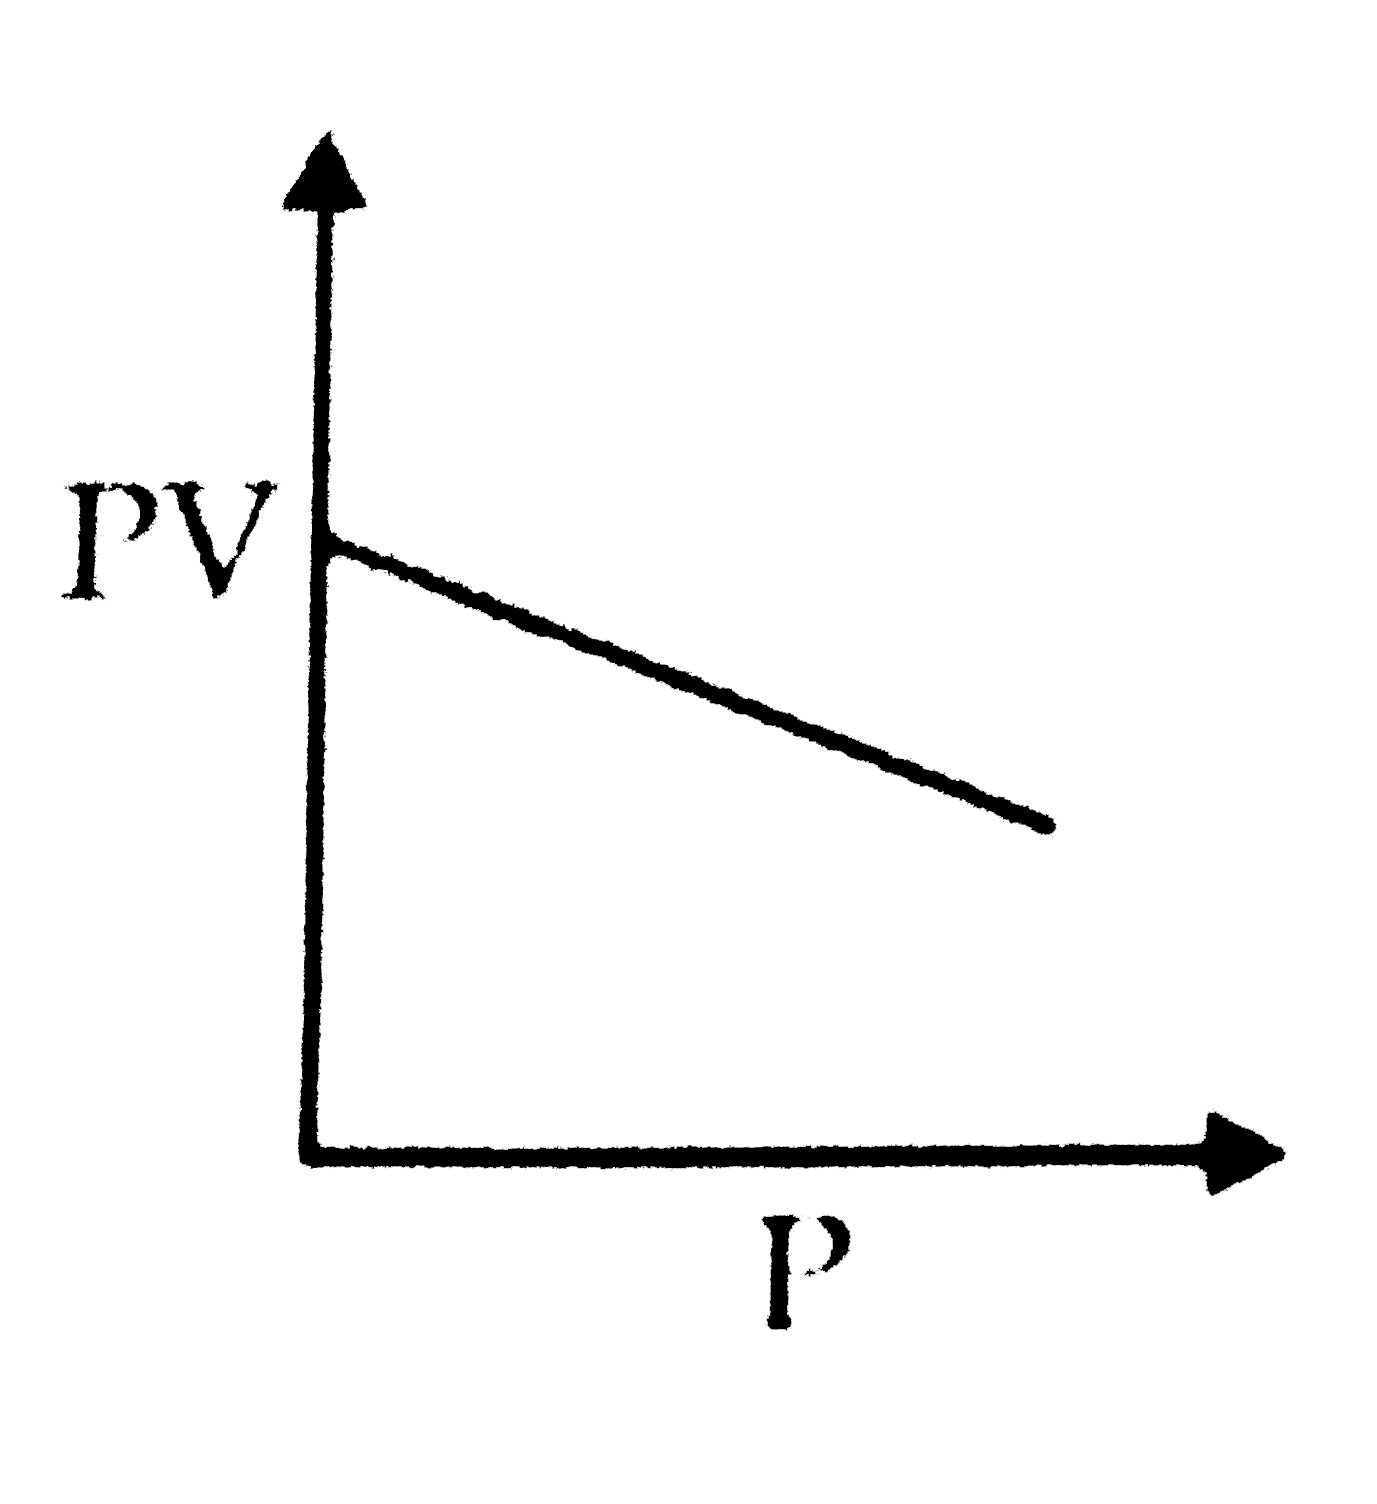
Which of the following graph represent Boyle's law ?
A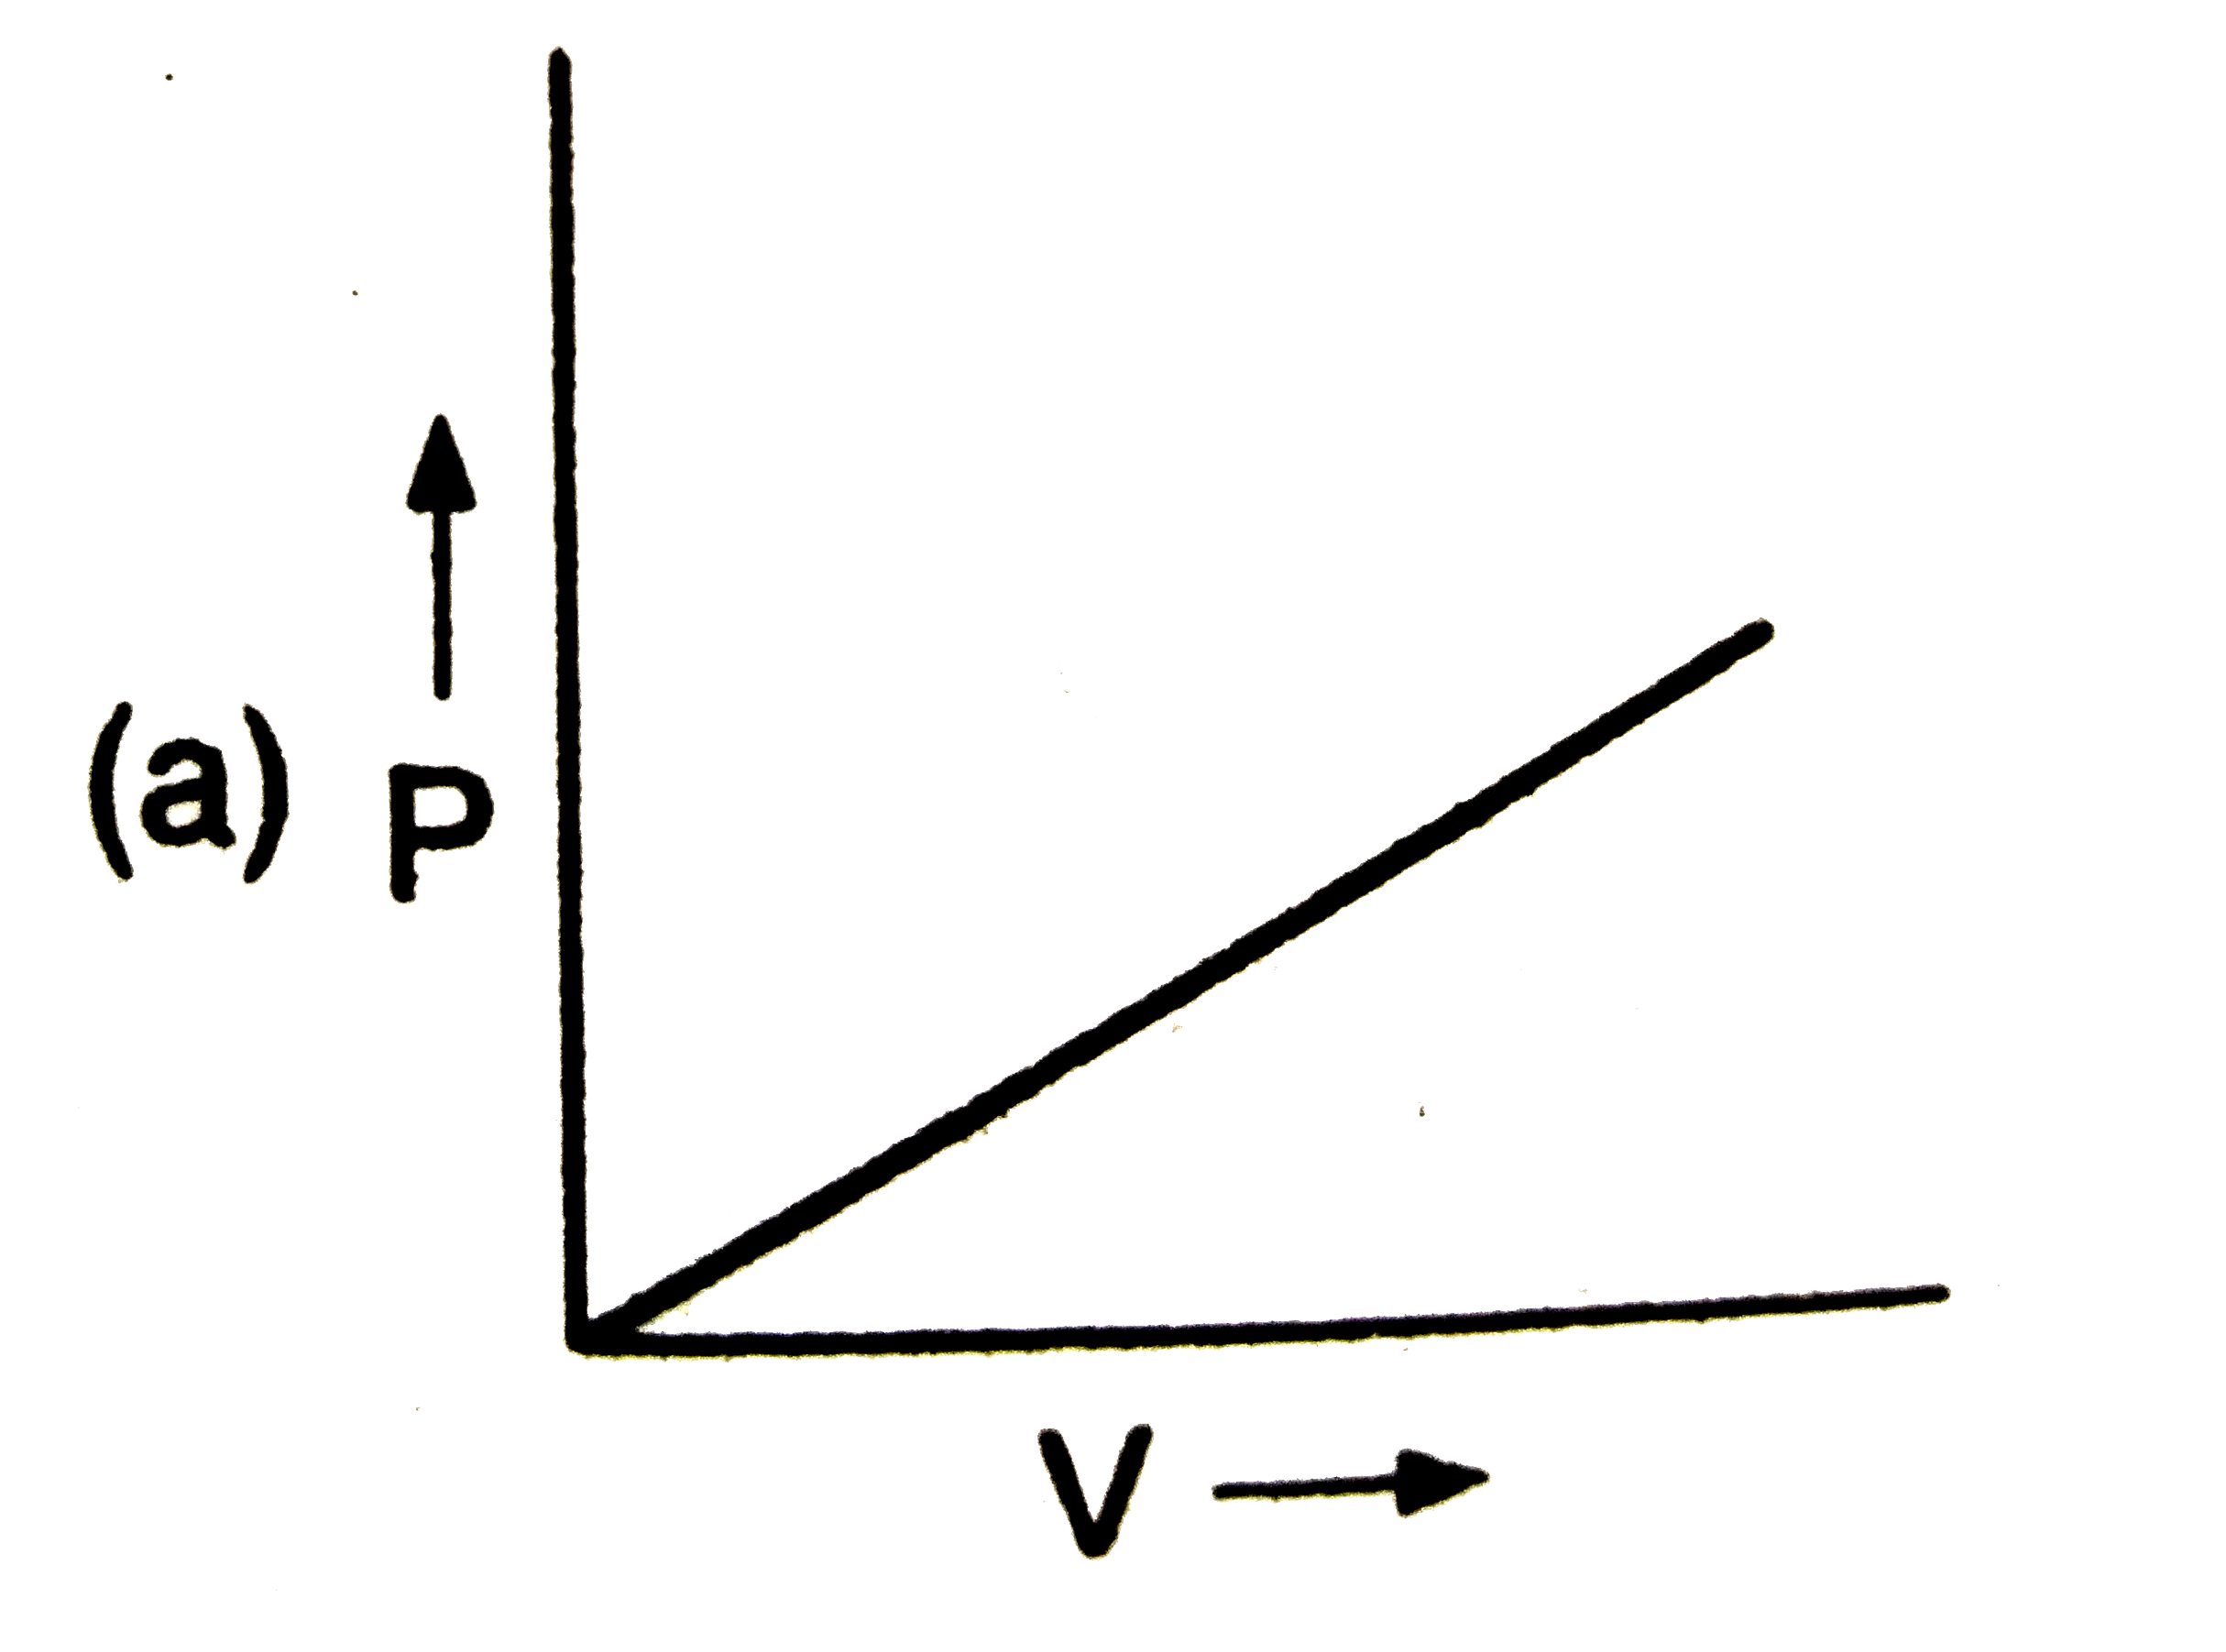 B
B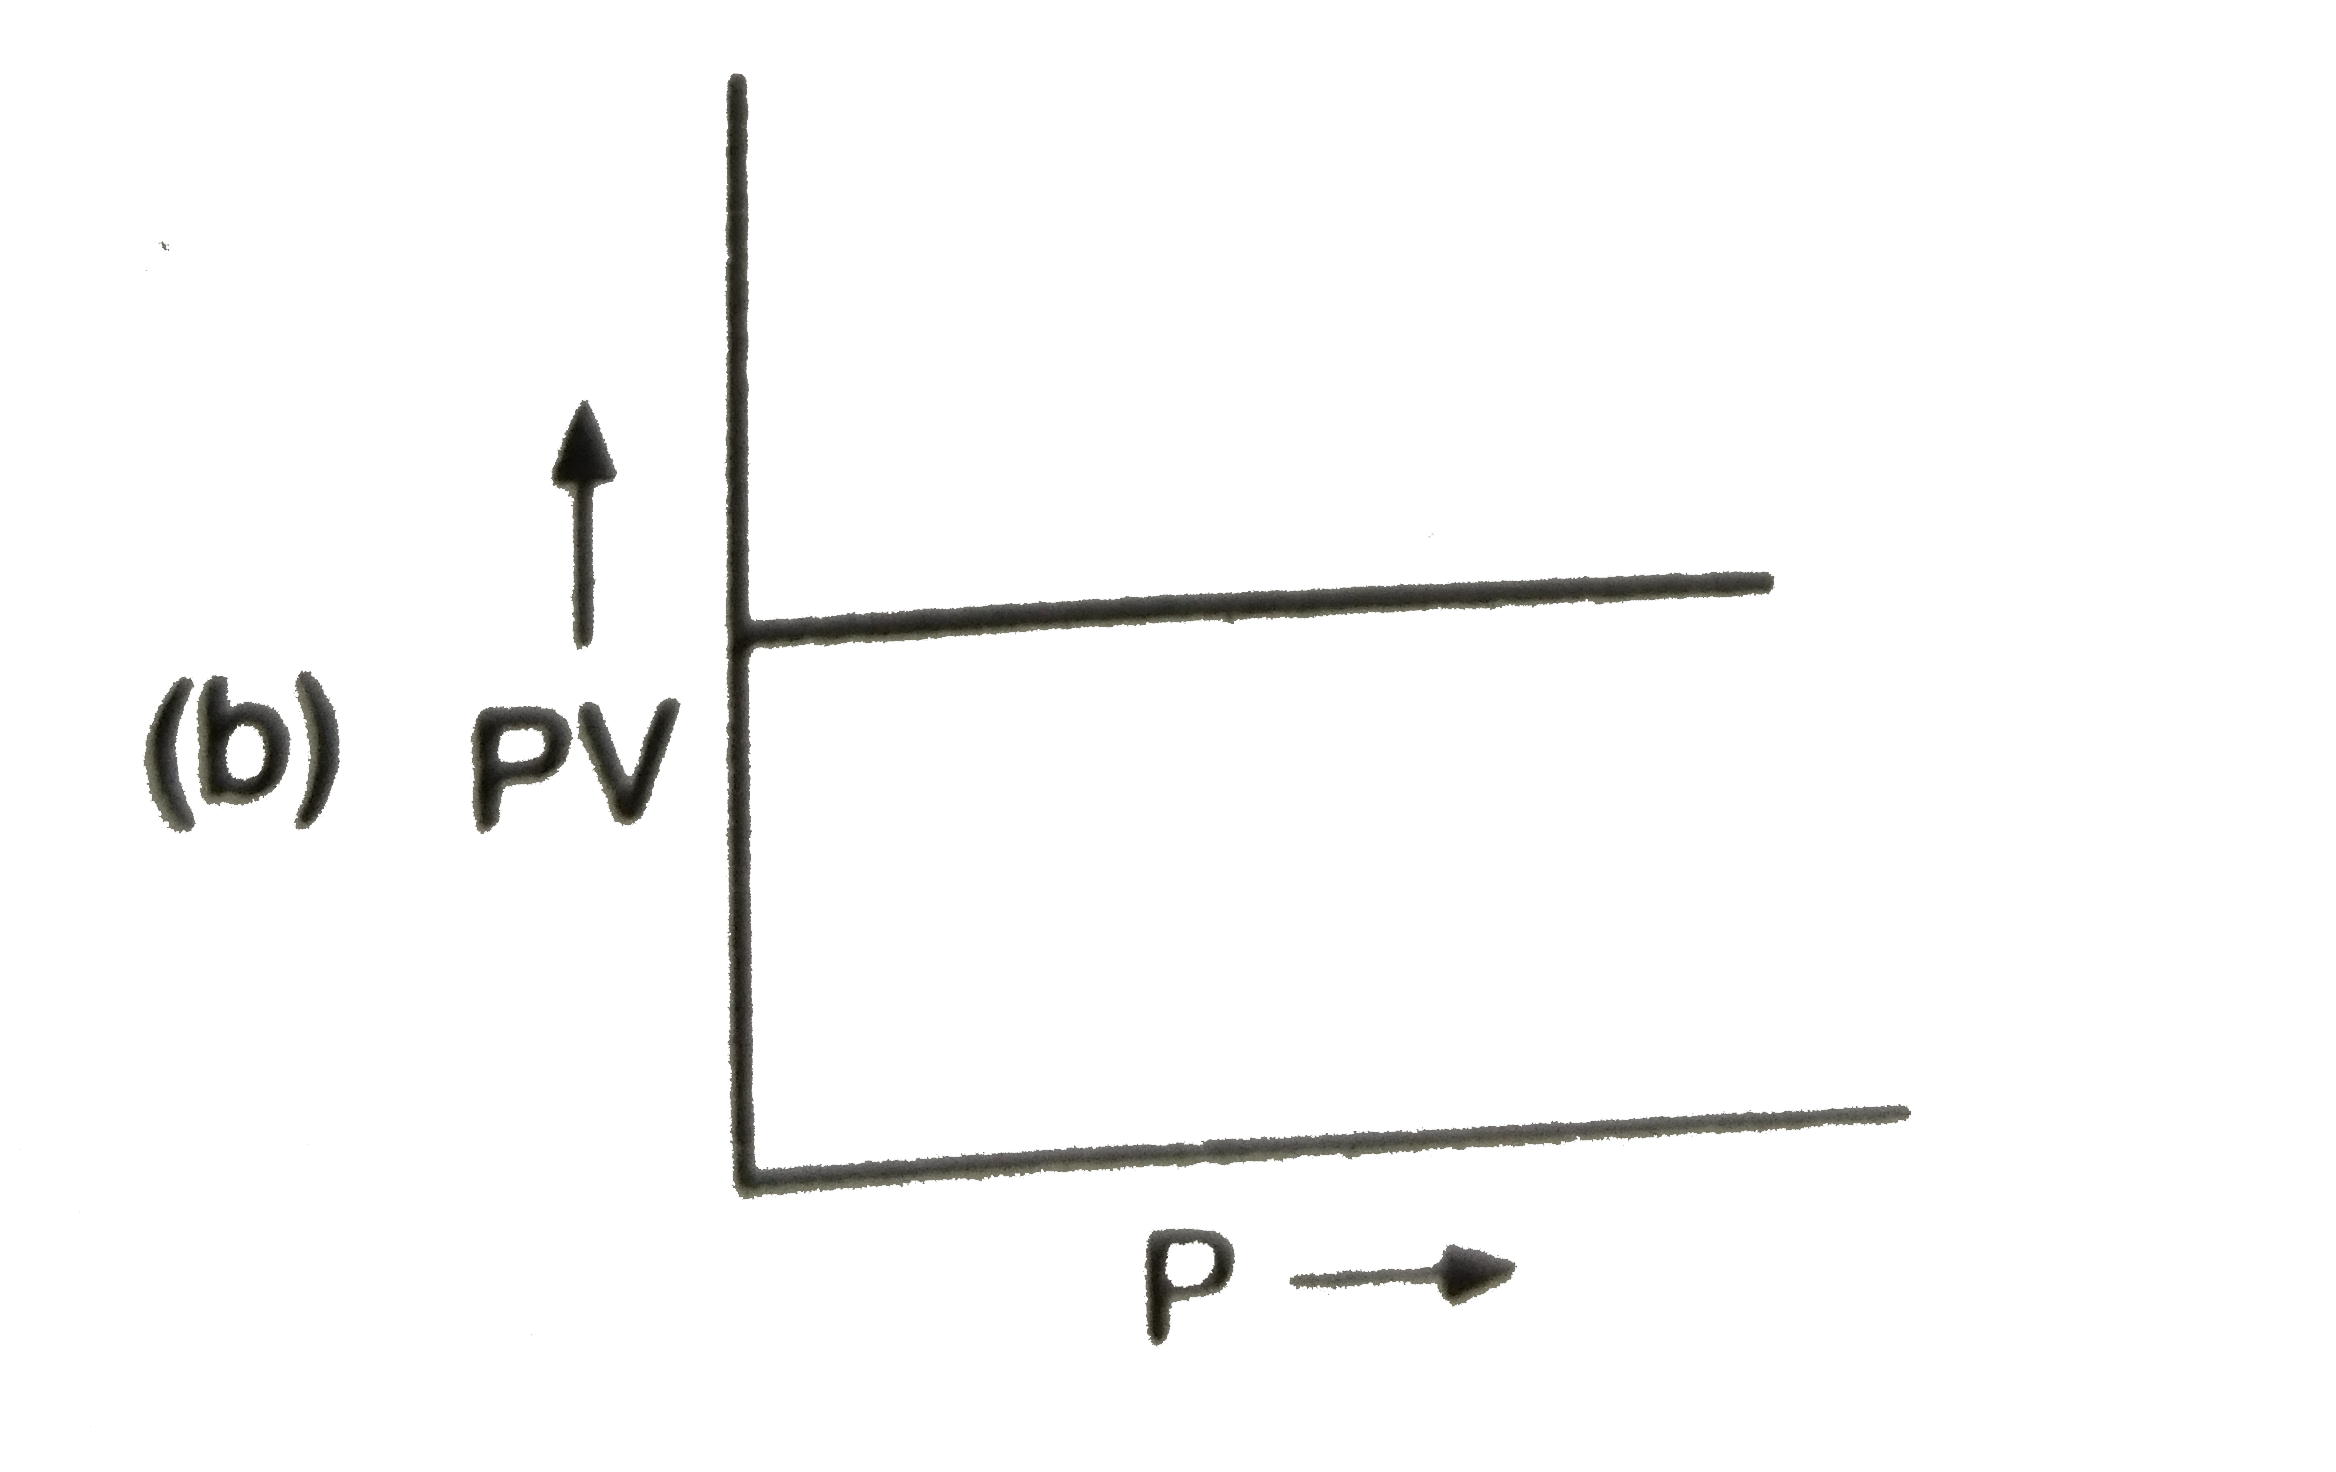 C
C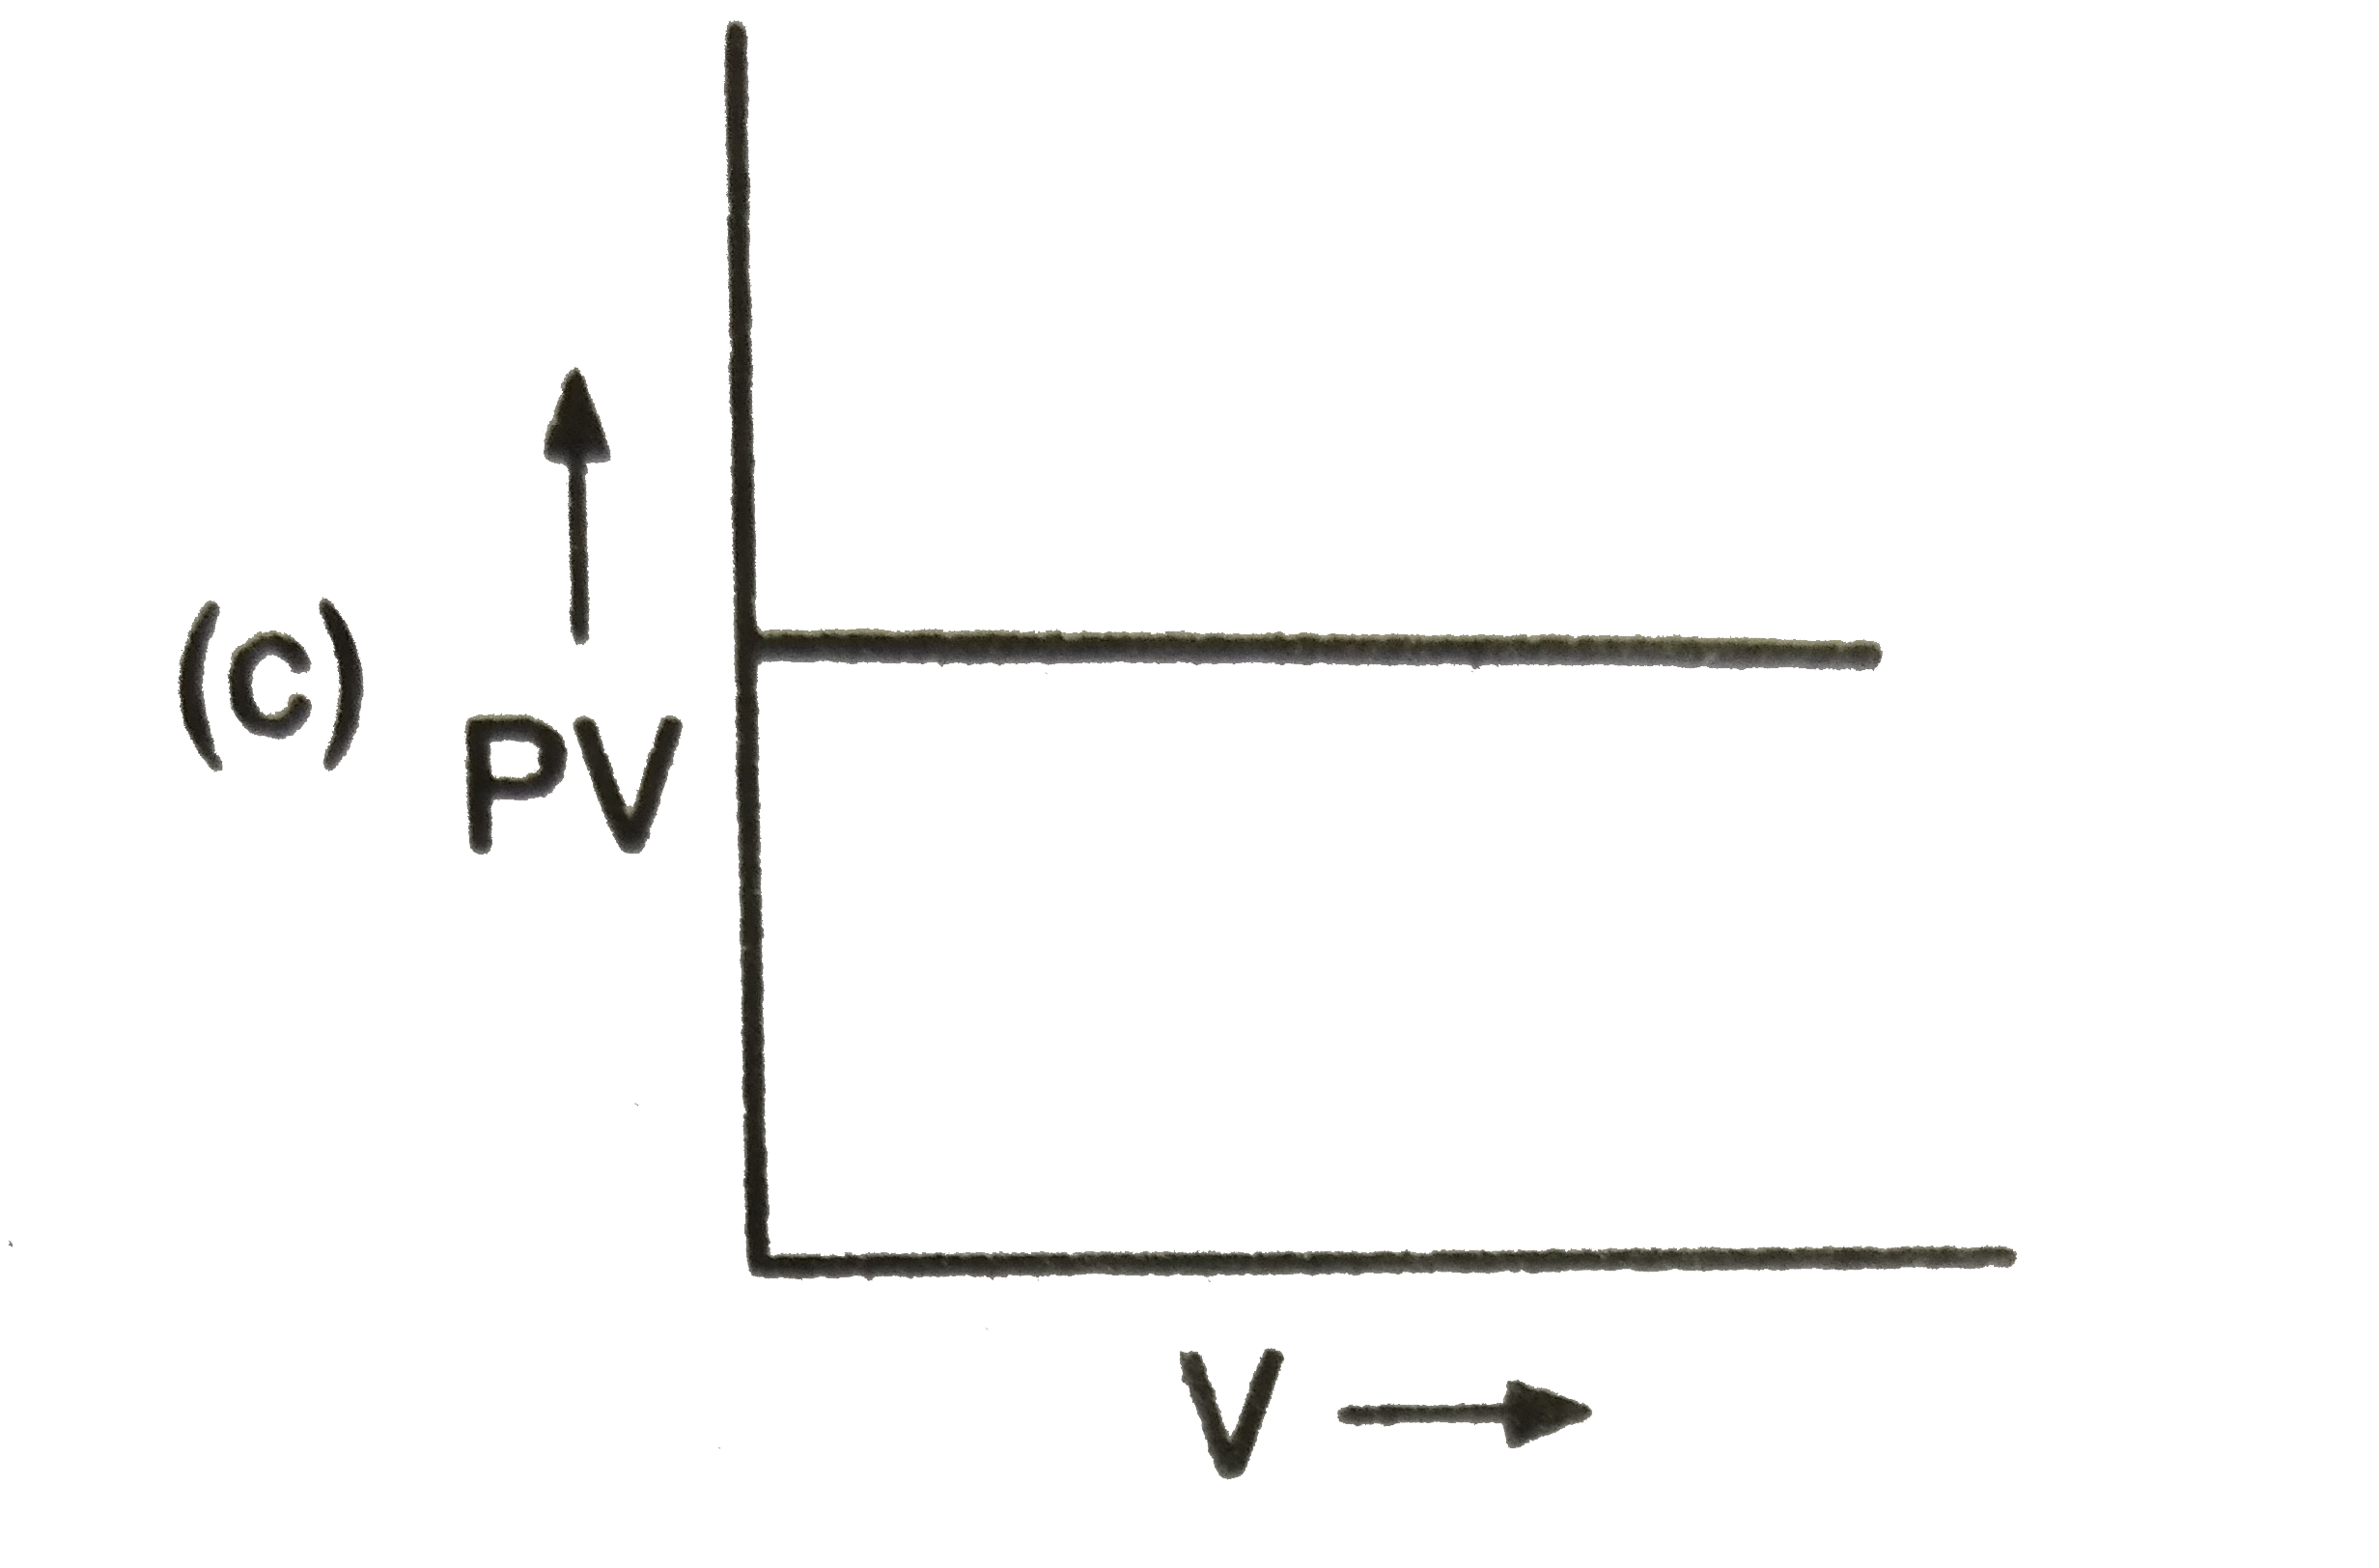 D
D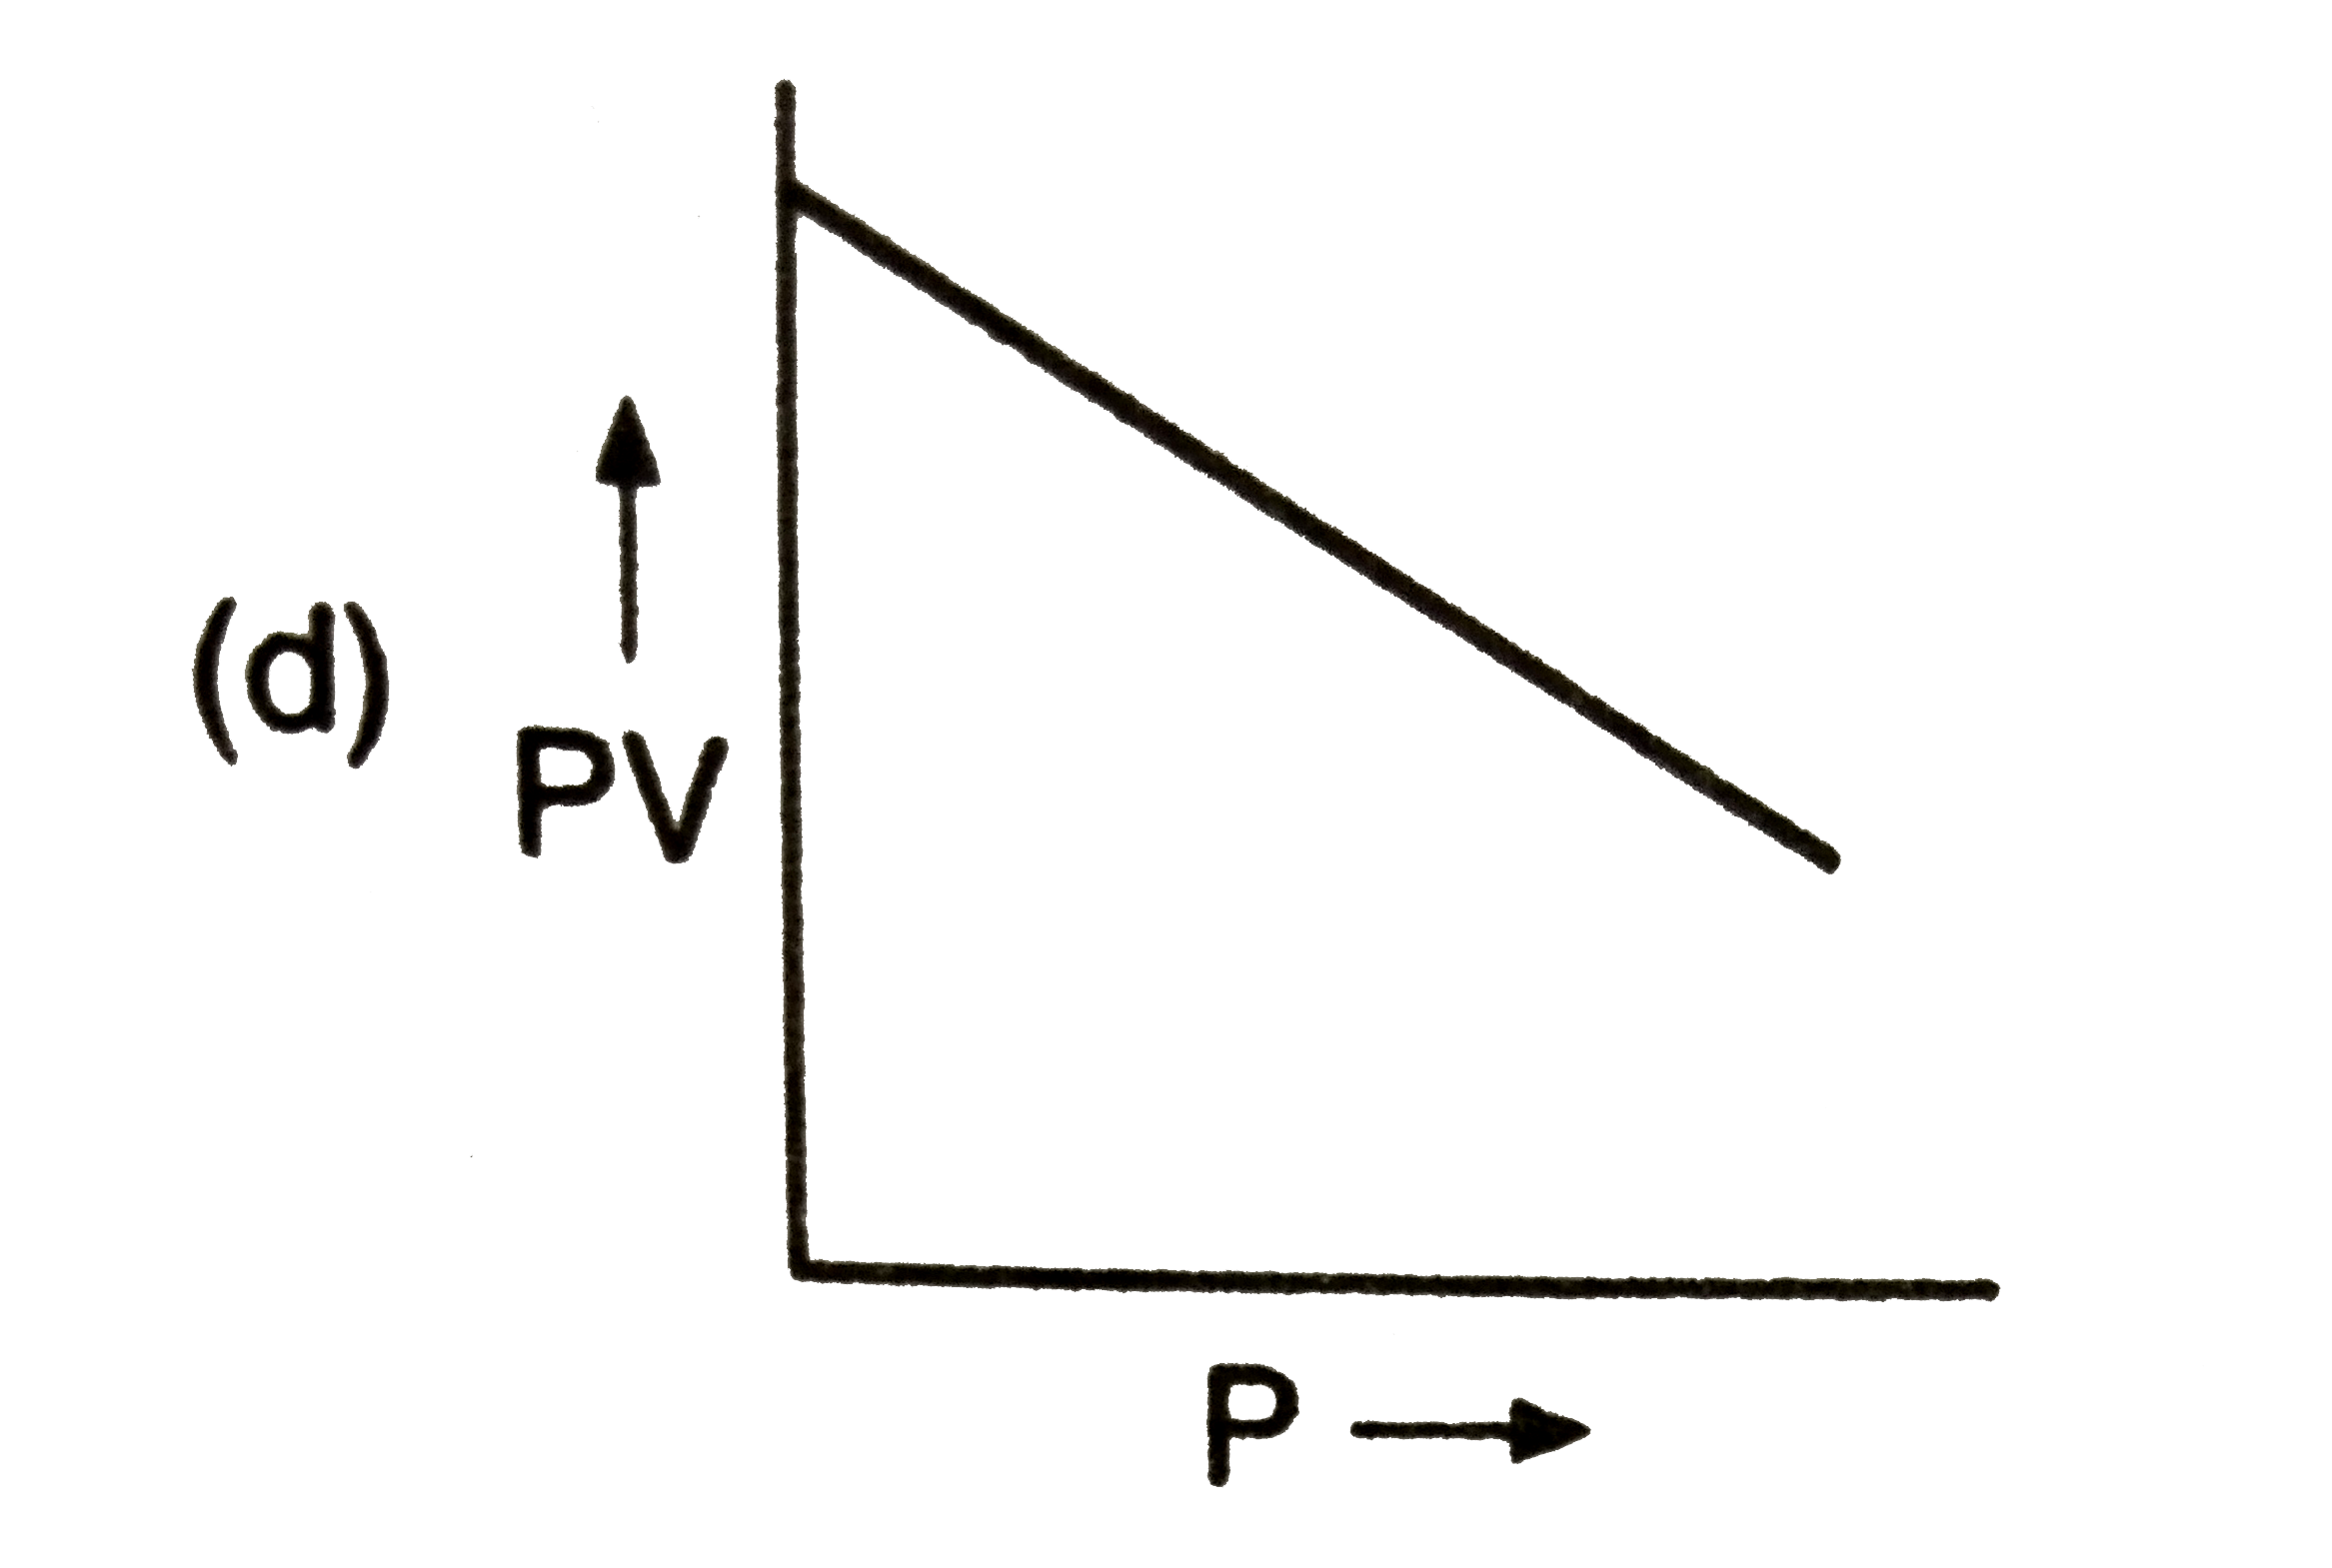
Which of the following graph represents Boyle's law ?
A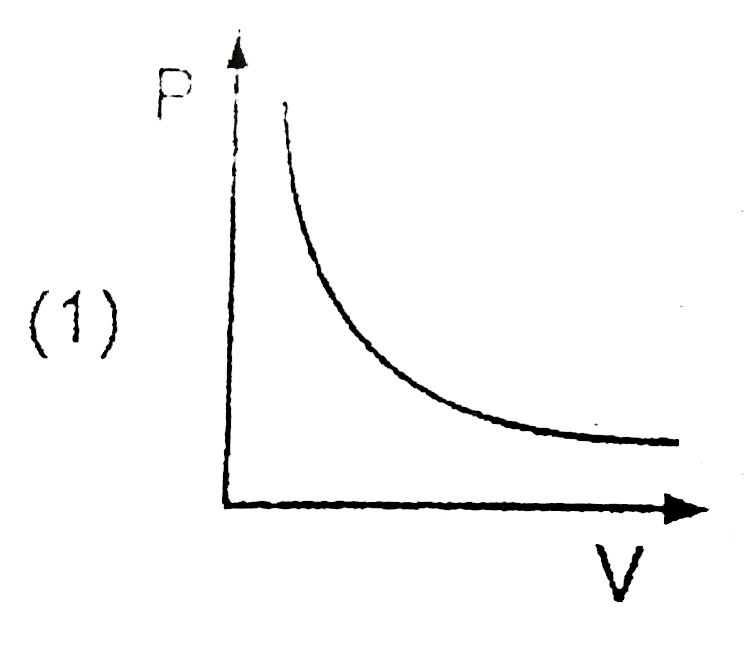 B
B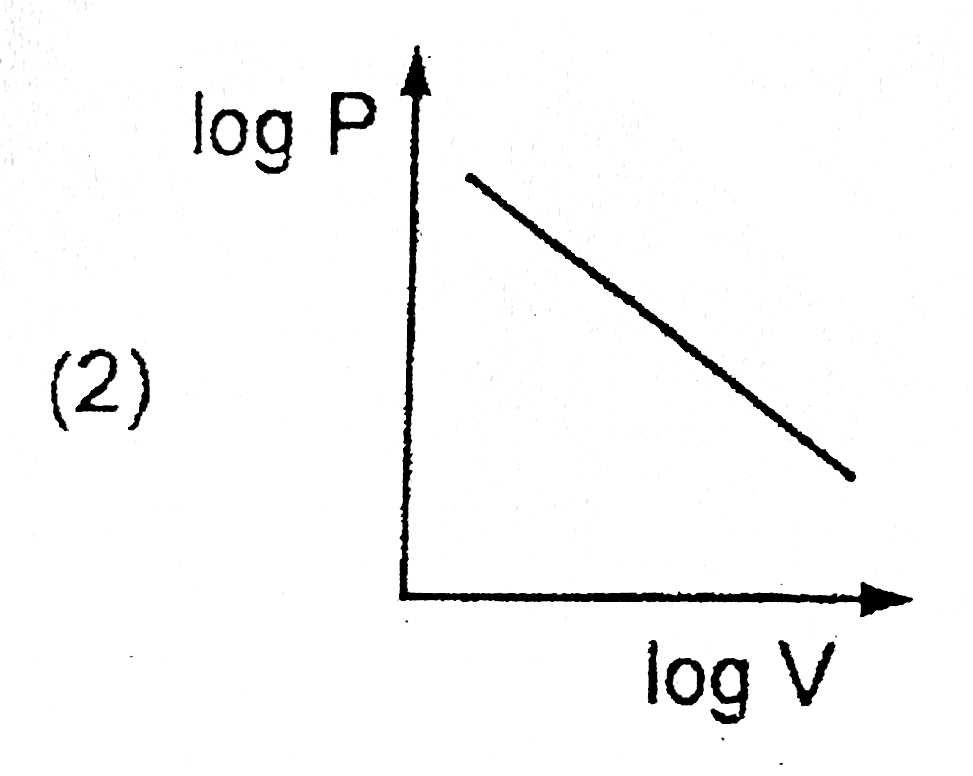 C
C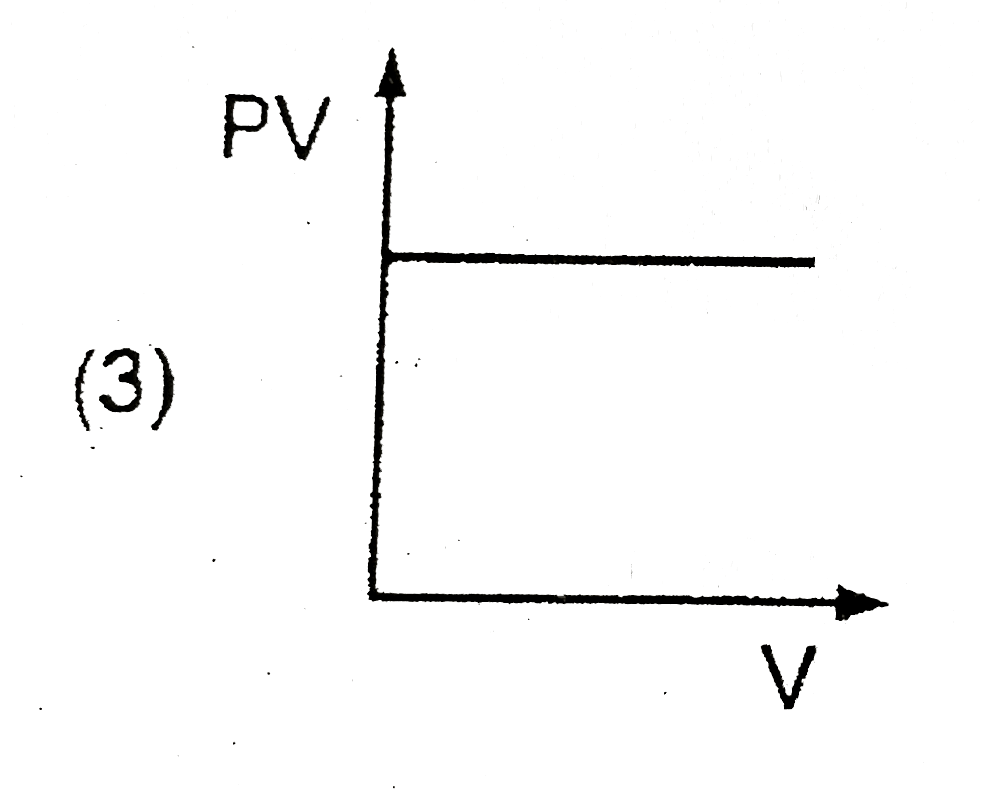 DAll of these
The slope of the plot between pV and p at constant temperature is
View SolutionThe gas law PV=constant is true for
View SolutionVariation of KH (Henry's law constant) with temperature T is shown by following graphs I−IV

correct representation is
View SolutionWhich of the following graphs represents Boyle's law correctly?
(i)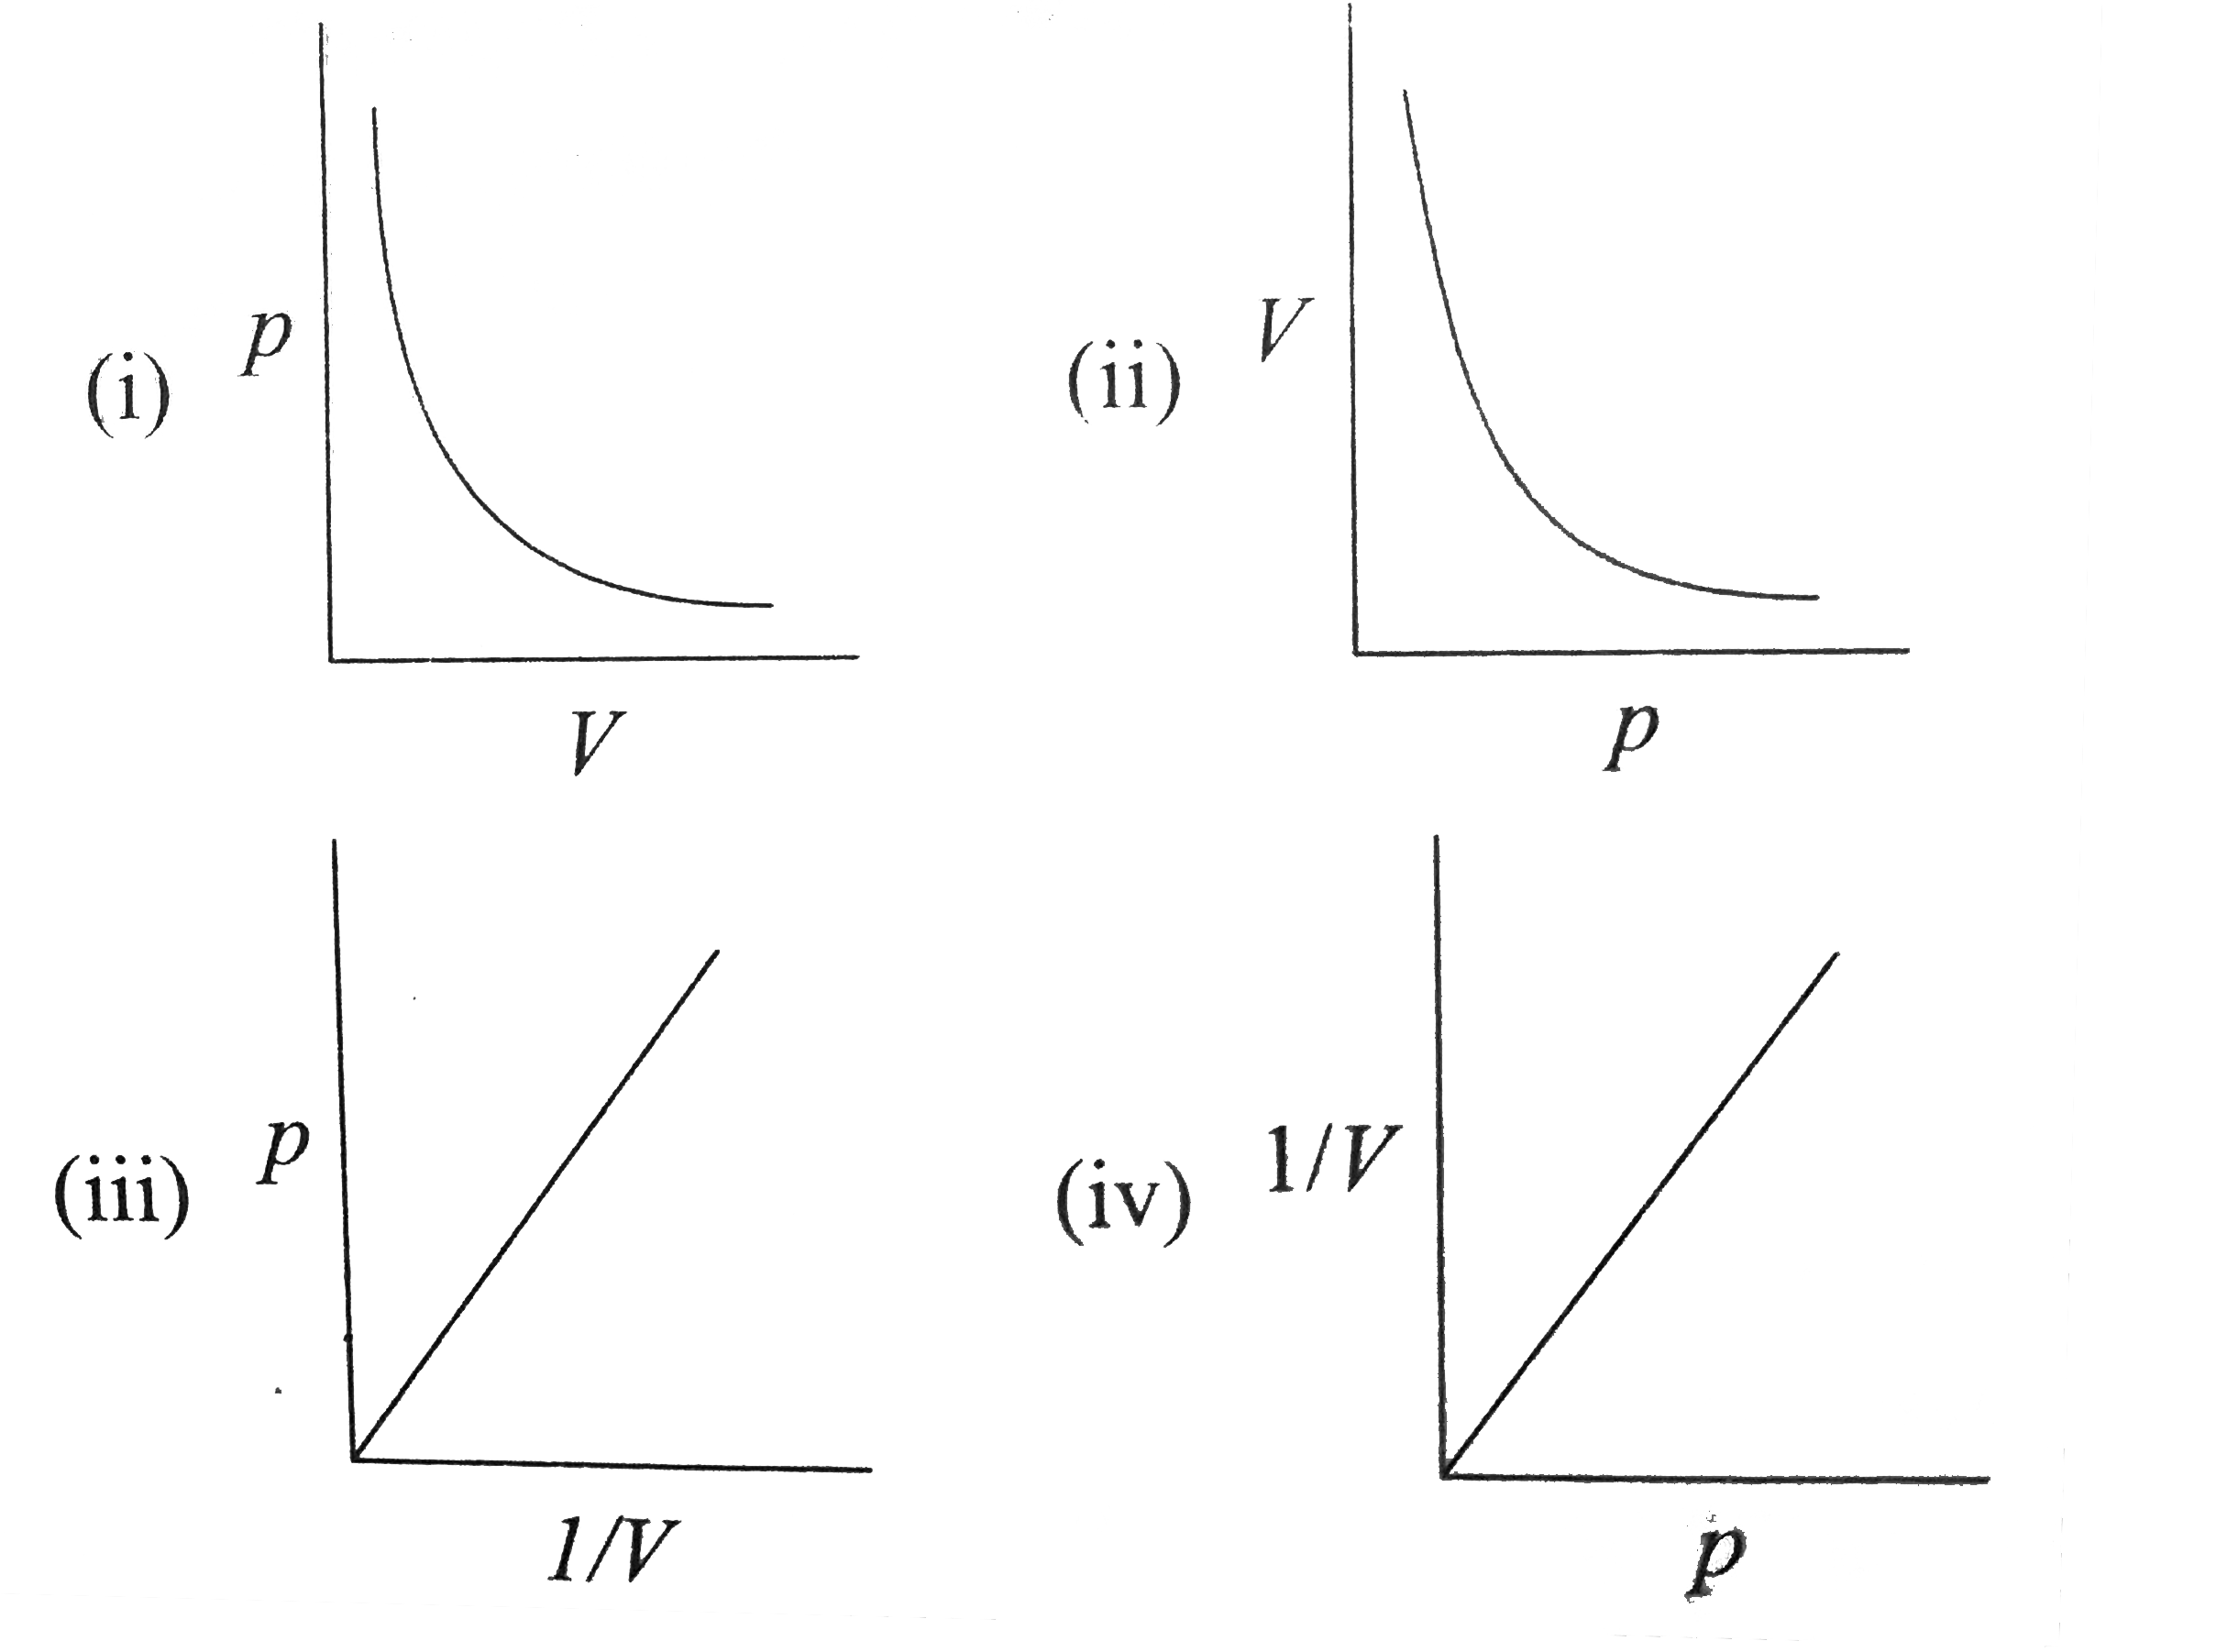
View SolutionA sample of gas follow process represented by PV2 = constant . Bulk modulus for this process is B, then which of the following graph is correct ?
View Solution
