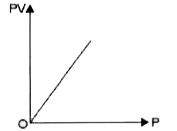
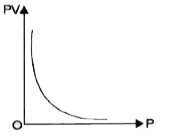
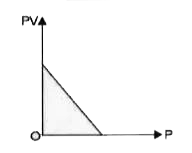
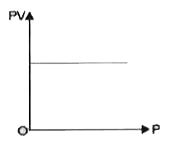
Variation of KH (Henry's law constant) with temperature T is shown by following graphs I−IV

correct representation is
A
IV
B
III
C
I
D
II
Video Solution
Text Solution
The correct Answer is:C
Partial pressure, p=KHχ
If temperature is lowered, 8solubility of gases increases at a given pressure. Thus KHincreases with increase in temperature. It is due to this reason that aquatic species are more comfortable in cold water rather than in warm water.
|
Topper's Solved these Questions
- SOLUTIONSBook:A2ZChapter:SOLUTIONSExercise:Raoult'S Law, Ideal And Non-Ideal Solutions, Azeotropes
Explore 37 Videos
- SOLUTIONSBook:A2ZChapter:SOLUTIONSExercise:Relative Lowering Of Vapour Pressure
Explore 24 Videos
- SOLUTIONSBook:A2ZChapter:SOLUTIONSExercise:Section D - Chapter End Test
Explore 30 Videos
- SOLID STATEBook:A2ZChapter:SOLID STATEExercise:Section D - Chapter End Test
Explore 30 Videos
- SURFACE CHEMISTRYBook:A2ZChapter:SURFACE CHEMISTRYExercise:Section D - Chapter End Test
Explore 30 Videos
Similar Questions
Knowledge Check
Variation of KH (Henry's law constant) with temperature T is shown by following graphs I−IV

correct representation isAIVBIIICIDIISignificance of Henry's law constant (KH) is
Ahigher the value of KH, lower the solubility of gas in liquidBhigher the value of KH, highgher the solubility of gas in liquidClower the value of KH, lower the solubility of gas in liquidDall of the aboveAccording to Boyle's law, PV = constant, at constant temperature. Which of the following graphs is correct?
A B
B C
C D
D
Value of Henry's constant KH…
View SolutionPlots showing the variation of the rate constant (k) with temperature (T) are given below. The plot that follows the Arrhenius equation is
View SolutionPlots showing the variation of the rate constant (k) with temperature (T) are given below. The plot that follows the Arrhenius equation is
View SolutionPlots showing the variation of the rate constant (k) with temperature (T) are given below. The plot that follows the Arrhenius equation is
View SolutionPlots showing the variation of the rate constant (k) with temperature (T) are given below. The plot that follows Arrhenius equations is
View Solution

