A graph is plotted taking .∘C along the Y-axis and .∘F along the X-axis. It is a/an
parabola
straight line
ellipse
circle
The correct Answer is:B
To determine the nature of the graph plotted with degrees Celsius on the Y-axis and degrees Fahrenheit on the X-axis, we can follow these steps:
1. Understand the Relationship:
We know the relationship between degrees Celsius (C) and degrees Fahrenheit (F) is given by the formula:
F=1.8C+32
2. Rearranging the Equation:
We can rearrange this equation to express Celsius in terms of Fahrenheit:
C=F−321.8
Here, we can let F be represented by x (the X-axis) and C be represented by y (the Y-axis). Thus, we have:
y=x−321.8
3. Identifying the Form of the Equation:
The equation y=11.8x−321.8 is in the form of y=mx+c, where:
- m=11.8 (the slope)
- c=−321.8 (the y-intercept)
4. Conclusion:
Since the equation is linear (in the form of y=mx+c), the graph of this relationship is a straight line.
Final Answer:
The graph plotted with degrees Celsius on the Y-axis and degrees Fahrenheit on the X-axis is a straight line.
---
We know the relationship between degrees Celsius (C) and degrees Fahrenheit (F) is given by the formula:
F=1.8C+32
We can rearrange this equation to express Celsius in terms of Fahrenheit:
C=F−321.8
Here, we can let F be represented by x (the X-axis) and C be represented by y (the Y-axis). Thus, we have:
y=x−321.8
The equation y=11.8x−321.8 is in the form of y=mx+c, where:
- m=11.8 (the slope)
- c=−321.8 (the y-intercept)
Since the equation is linear (in the form of y=mx+c), the graph of this relationship is a straight line.
The graph plotted with degrees Celsius on the Y-axis and degrees Fahrenheit on the X-axis is a straight line.
Topper's Solved these Questions
- HEATBOOK - MCGROW HILL PUBLICATIONCHAPTER - HEATEXERCISE - HIGHER ORDER THINKING QUESTIONS
15 Videos
- GRAVITATION BOOK - MCGROW HILL PUBLICATIONCHAPTER - GRAVITATION EXERCISE - HIGHER ORDER THINKING QUESTIONS
25 Videos
- HEATING AND MAGNETIC EFFECTS OF CURRENT BOOK - MCGROW HILL PUBLICATIONCHAPTER - HEATING AND MAGNETIC EFFECTS OF CURRENT EXERCISE - HIGHER ORDER THINKING QUESTIONS
34 Videos
Similar Questions
A graph is plotted between PVm along Y-axis and P along X-axis whre Vm is the molar voulume of a real gas Find the intercept along Y-axis .
View SolutionA graph is plotted by taking pressure along y-axis and centigrade temperature along X-axis for an ideal gas at constant volume. x intercept of the graph is
View Solution
Knowledge Check
A graph is plotted taking ∘––C along the Y - axis and of along the X - axis .It is a /an
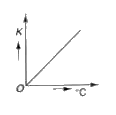
AparabolaBstraight lineCellipseDcircleA graph was plotted taking the temperature in .∘C along the X-axis and the corresponding temperature in Kelvin along the Y-axis. Which of the curves in Fig, 6.1 most correctly represents this behaviour?
A B
B C
C D
D
The flux linked with a circuit is given by
ϕ=t3+3t−5
The graph between the indued e.m.f. (e) along the Y-axis and the time (t) along the X-axis will beAa straight line through the originBa straight line with a negative intercept on the e-axisCa straight line with a +ve intercept on the e-axisDa parabola not passing through the origin
If a graph is plotted by taking spectral emissive power along y-axis and wavelength along X-axis then the area below the graph above wavelength axis is
View SolutionA graph is drawn with 1u along x-axis and 1v along the y-axis. If the intercept on the x-axis is 0.5m−1, the focal length of thr lens is (in meter).
View SolutionIf a graph is plotted taking the temperature in fahrenheit along the Y- axis and the corresponding temperature in celsins along X - axis it will be straight line
View SolutionIf a graph is plotted taking the temperature in Fahrenheit along the Y-axis and the corresponding temperature in Celsius along the X-axis, it will be a straight line
View SolutionA force →F=(6ˆi−8ˆj)N, acts on a particle and displaces it over 4m along the X-axis and 6m along the Y-axis. The work done during the total displacement is
View Solution
