Which of the following graphs shows variation between density of water and temperature?
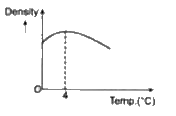
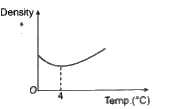
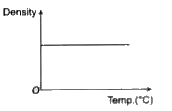
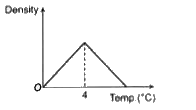
The correct Answer is:A
Step by step video, text & image solution for Which of the following graphs shows variation between density of water and temperature? by Physics experts to help you in doubts & scoring excellent marks in Class 10 exams.
Updated on:21/07/2023Topper's Solved these Questions
- HEATBook:MCGROW HILL PUBLICATIONChapter:HEATExercise:HIGHER ORDER THINKING QUESTIONS
Explore 15 Videos
- GRAVITATION Book:MCGROW HILL PUBLICATIONChapter:GRAVITATION Exercise:HIGHER ORDER THINKING QUESTIONS
Explore 25 Videos
- HEATING AND MAGNETIC EFFECTS OF CURRENT Book:MCGROW HILL PUBLICATIONChapter:HEATING AND MAGNETIC EFFECTS OF CURRENT Exercise:HIGHER ORDER THINKING QUESTIONS
Explore 34 Videos
Similar Questions
Knowledge Check
Which of the following graph shows the variationi of density of water increase in temperature ?
A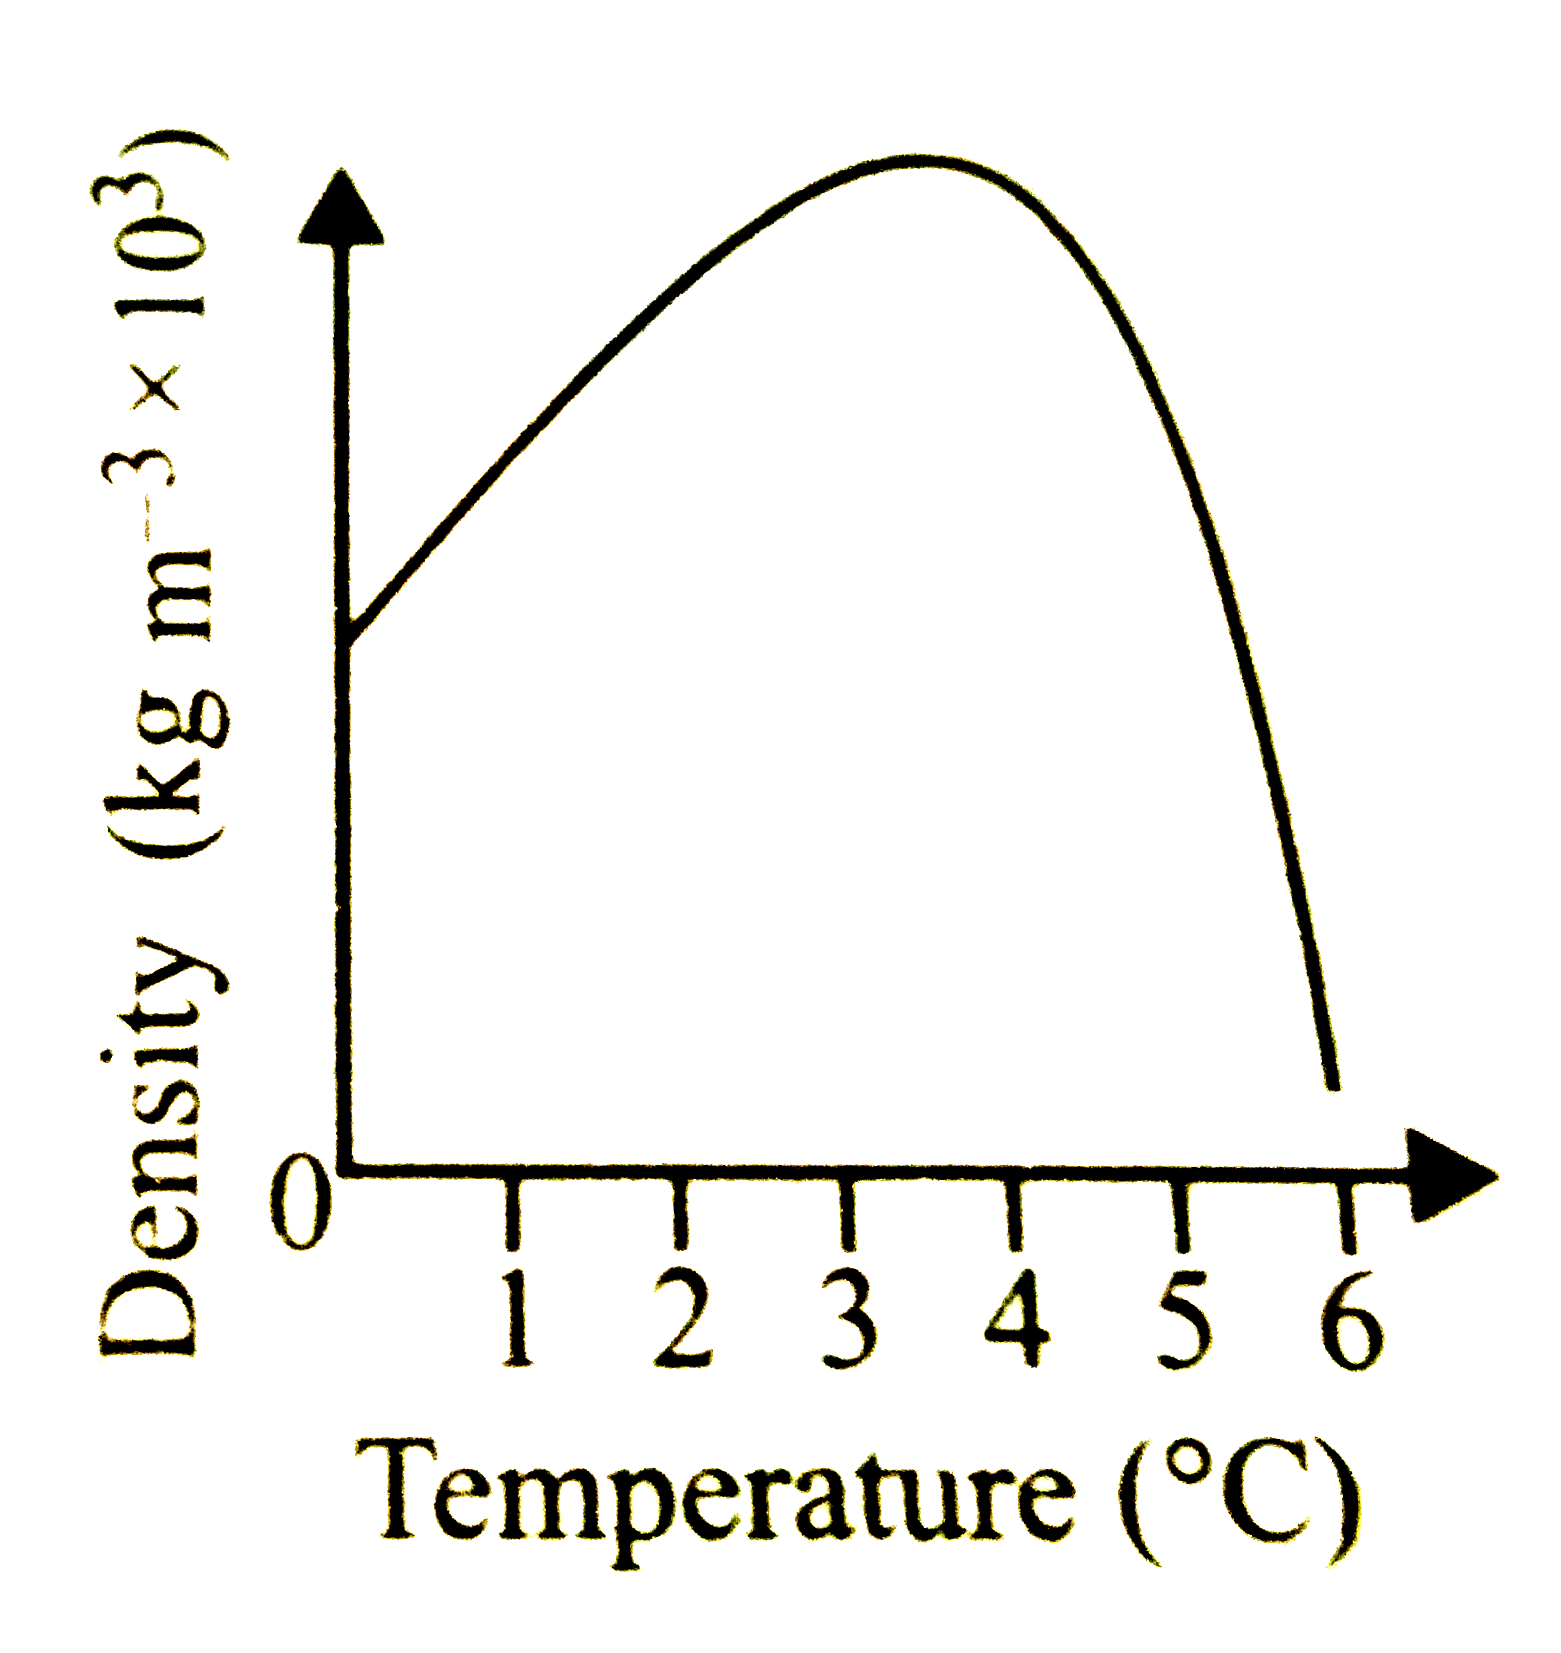 B
B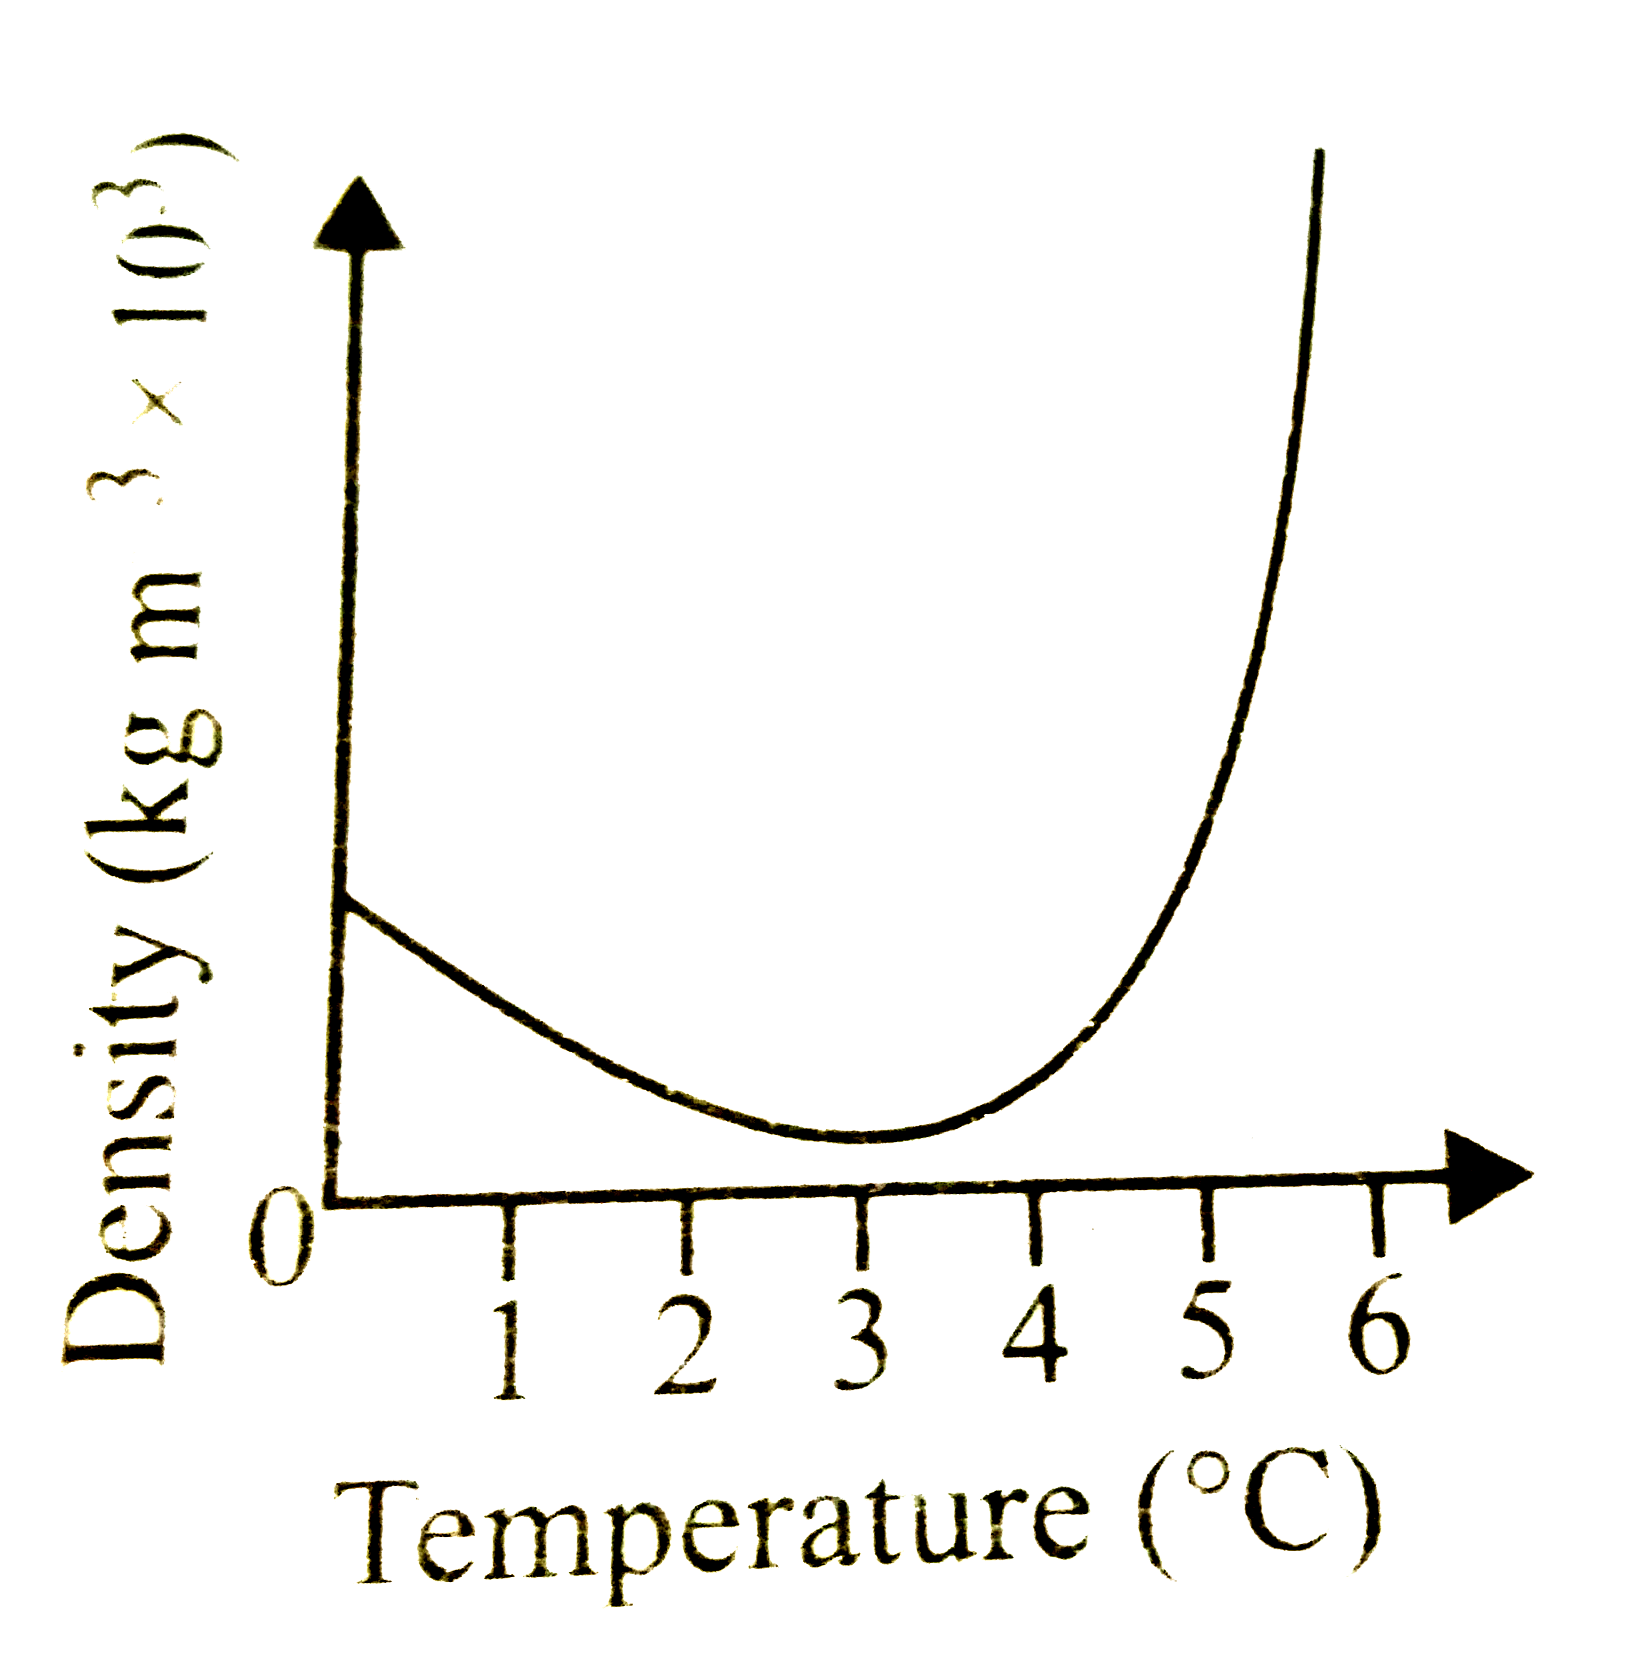 C
C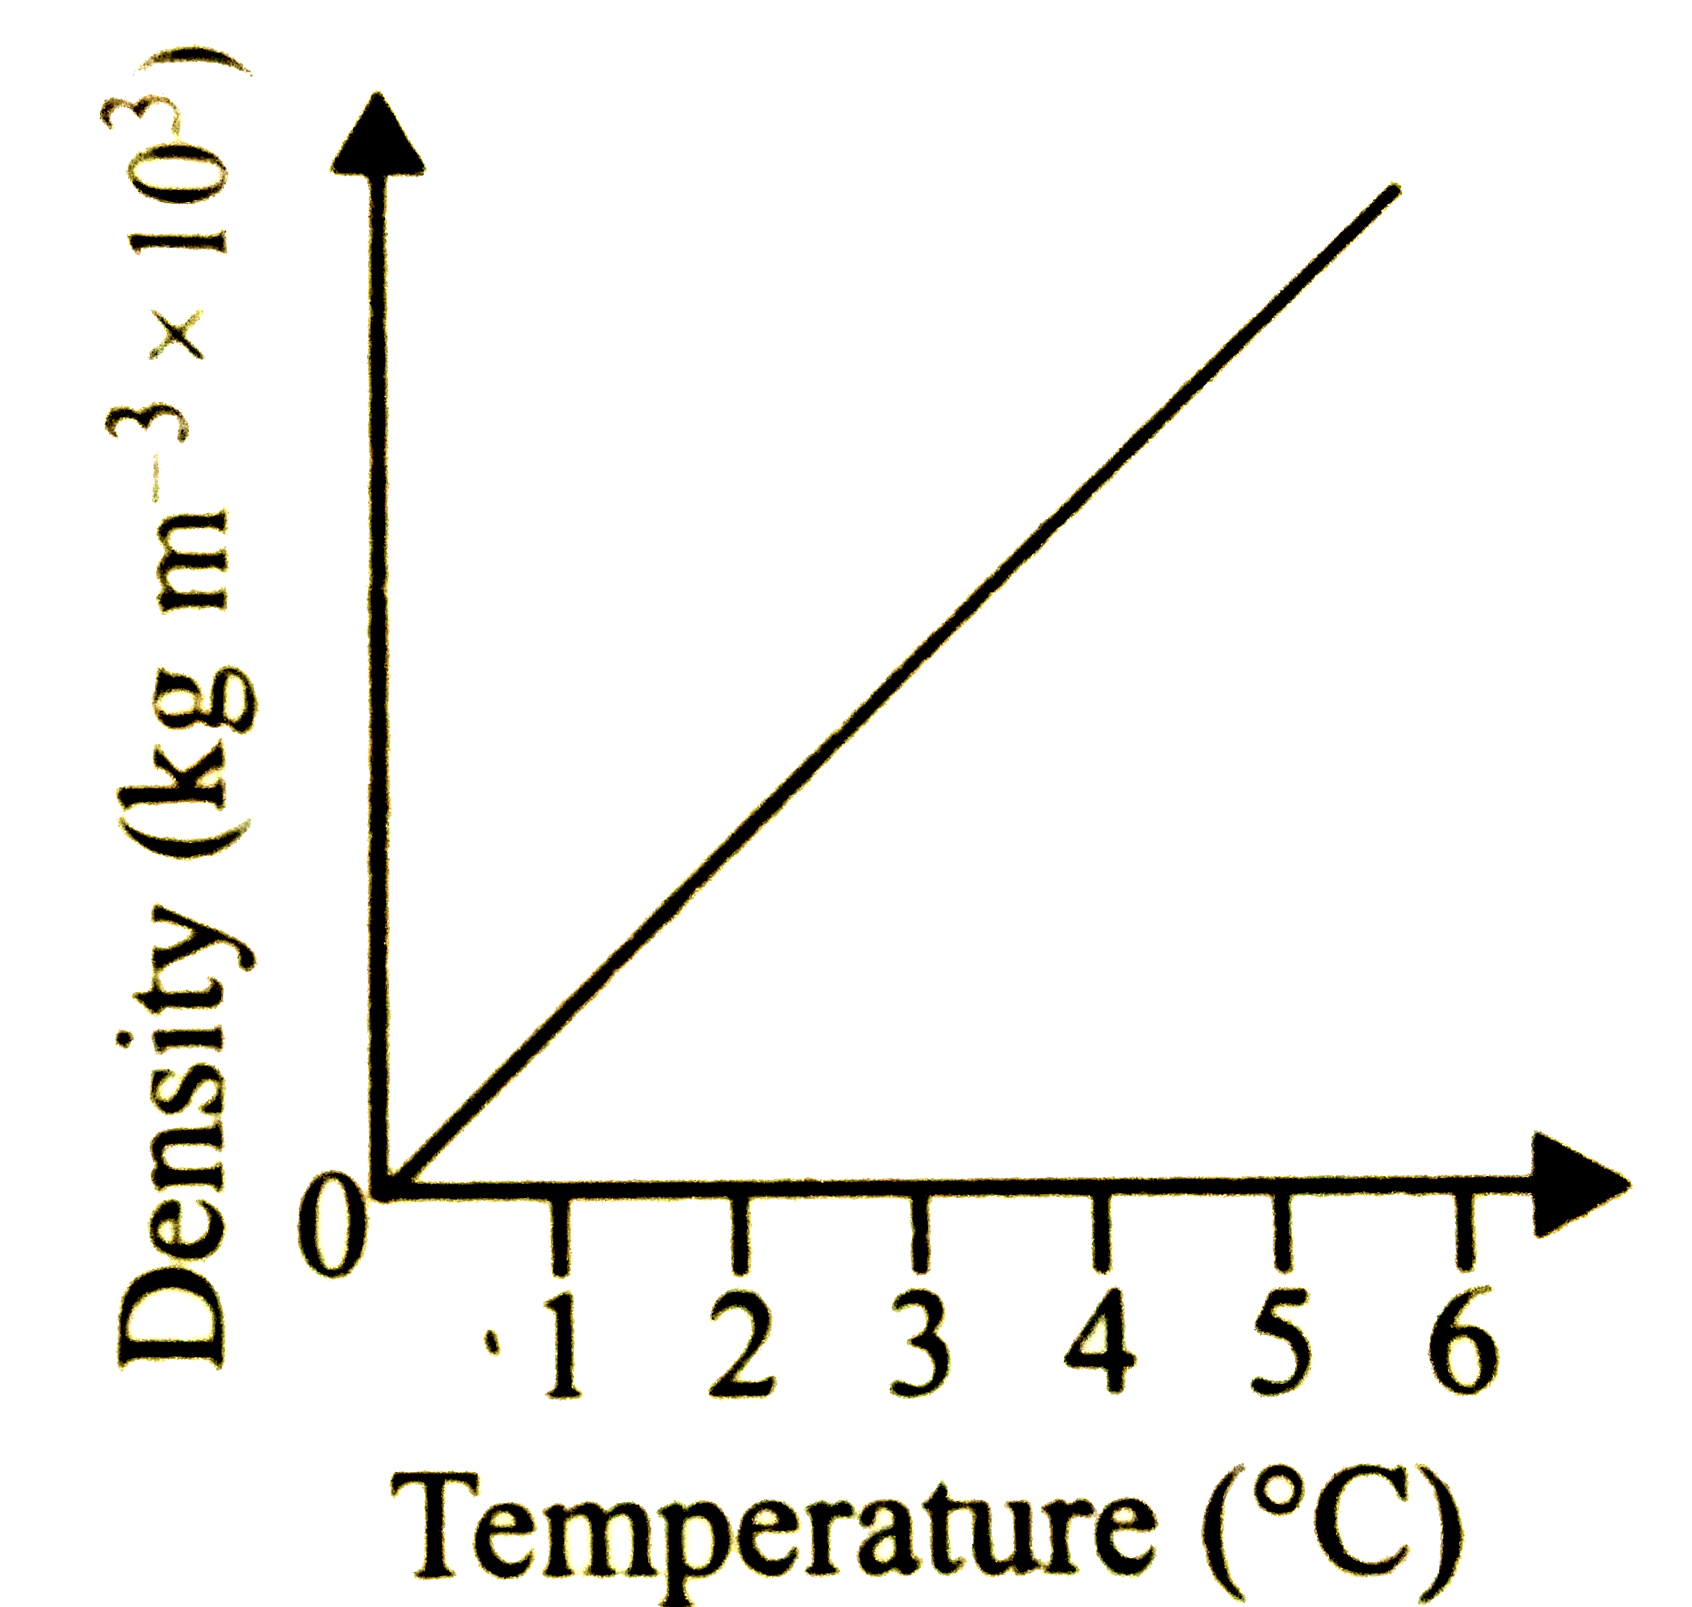 D
D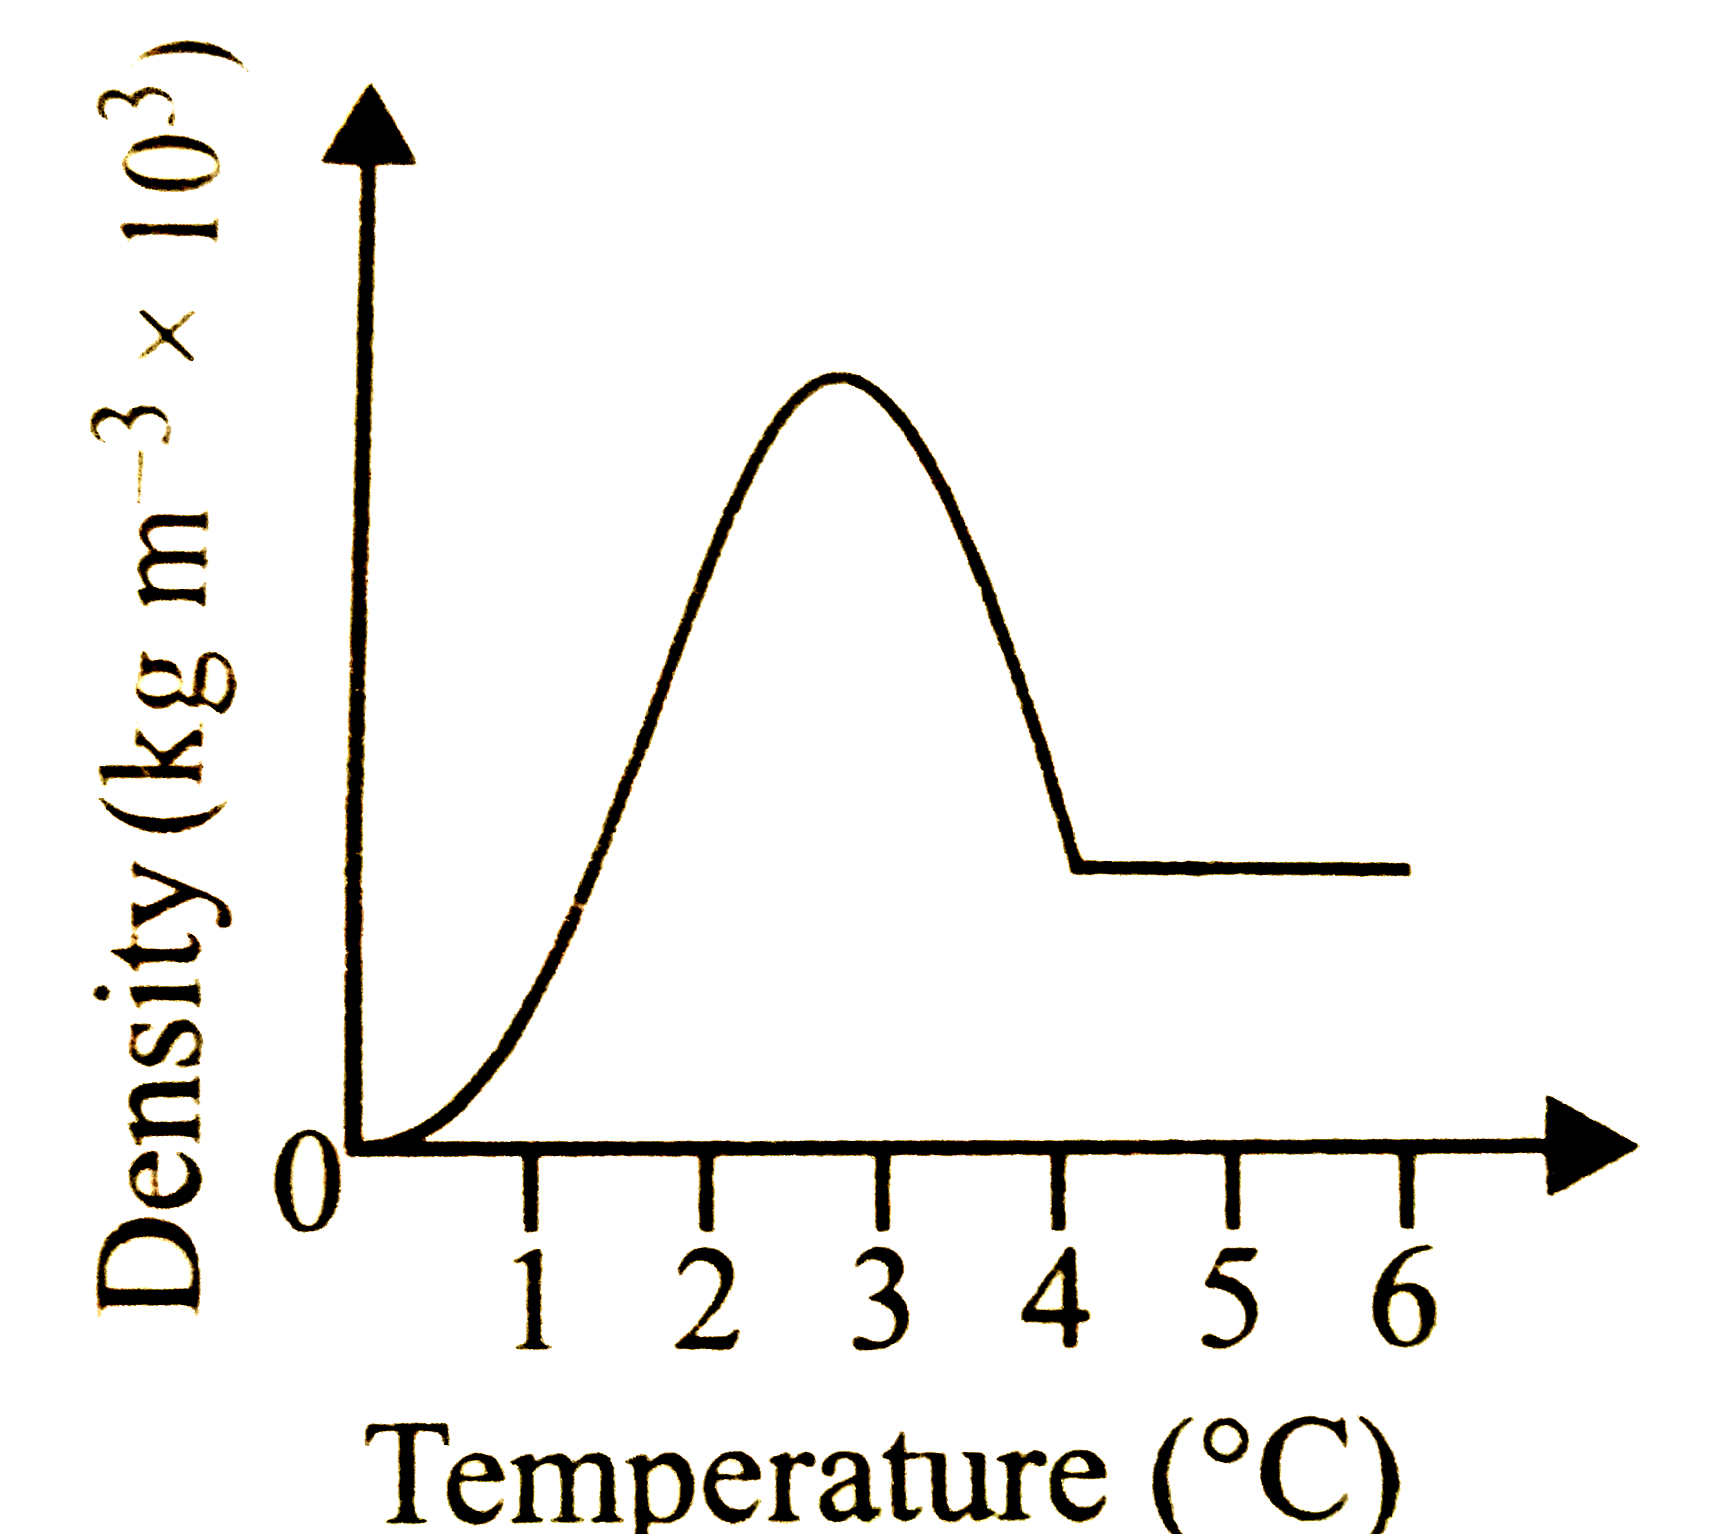
Which of the following curve represent variation of density of water with temperature best-
A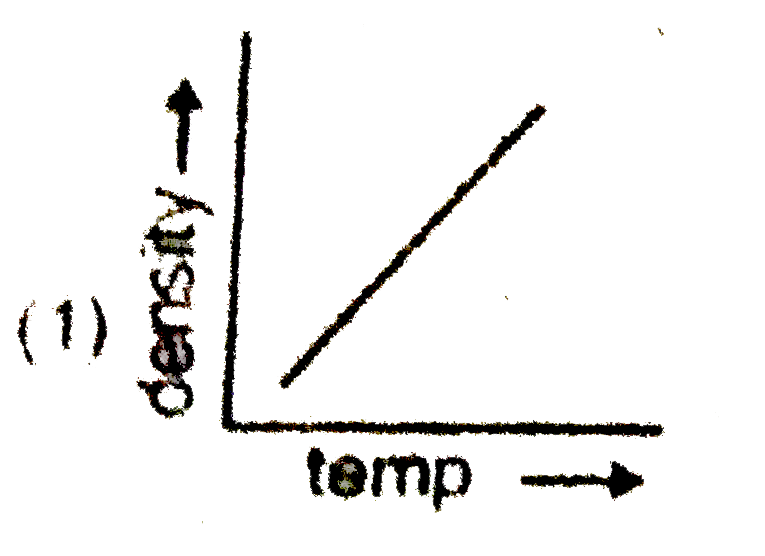 B
B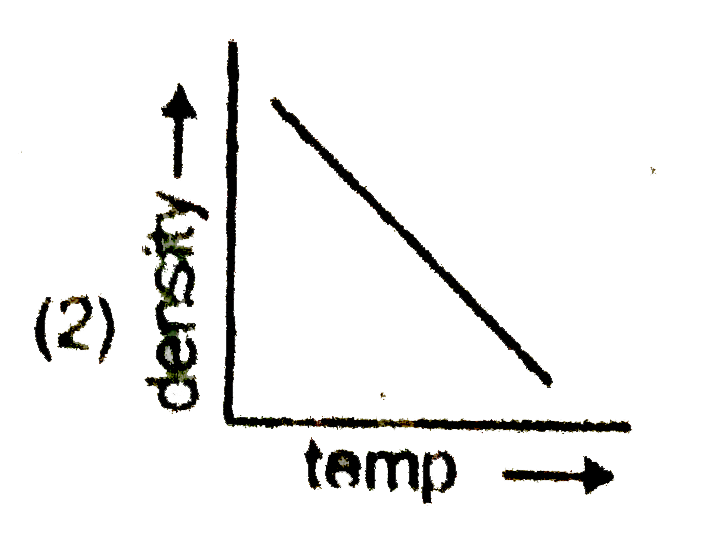 C
C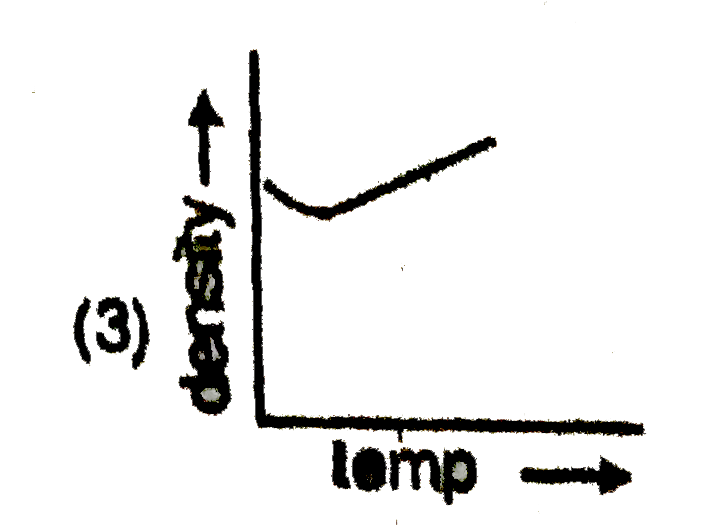 D
D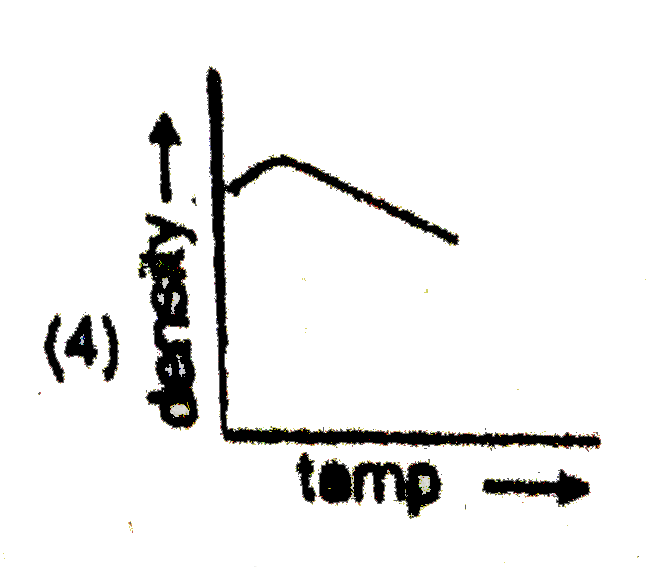
Which of the following graphs shows the variation of thermoelectric power with temperature difference between hot and cold junction in thermocouples
A B
B C
C D
D
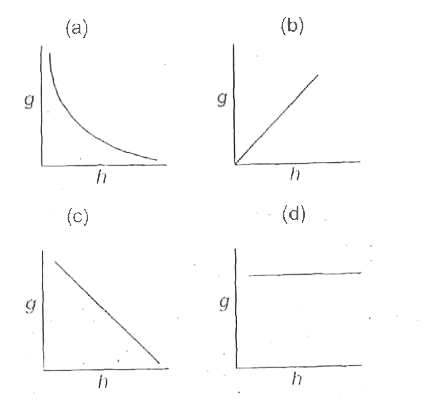
Which of the following graphs shows the variation of acceleration due to gravity g with depth h from the surface of the earth ?
View SolutionWhich of the following graphs shows the variation of magnetic induction B with distance r from a long wire carrying current
View SolutionWhich of the following graphs shows the variation of de-Broglie wavelength with potential through which a particle of charge q and mass m is accelerated ?
View SolutionWhich of the following graphs correctly shows variation of coefficient of volume expansion of copper as a function of temperature ?
View SolutionWhich one of the following graphs represents the variation of surface tension of water with temperture for a small range of temperature ?
View Solution


 .
.