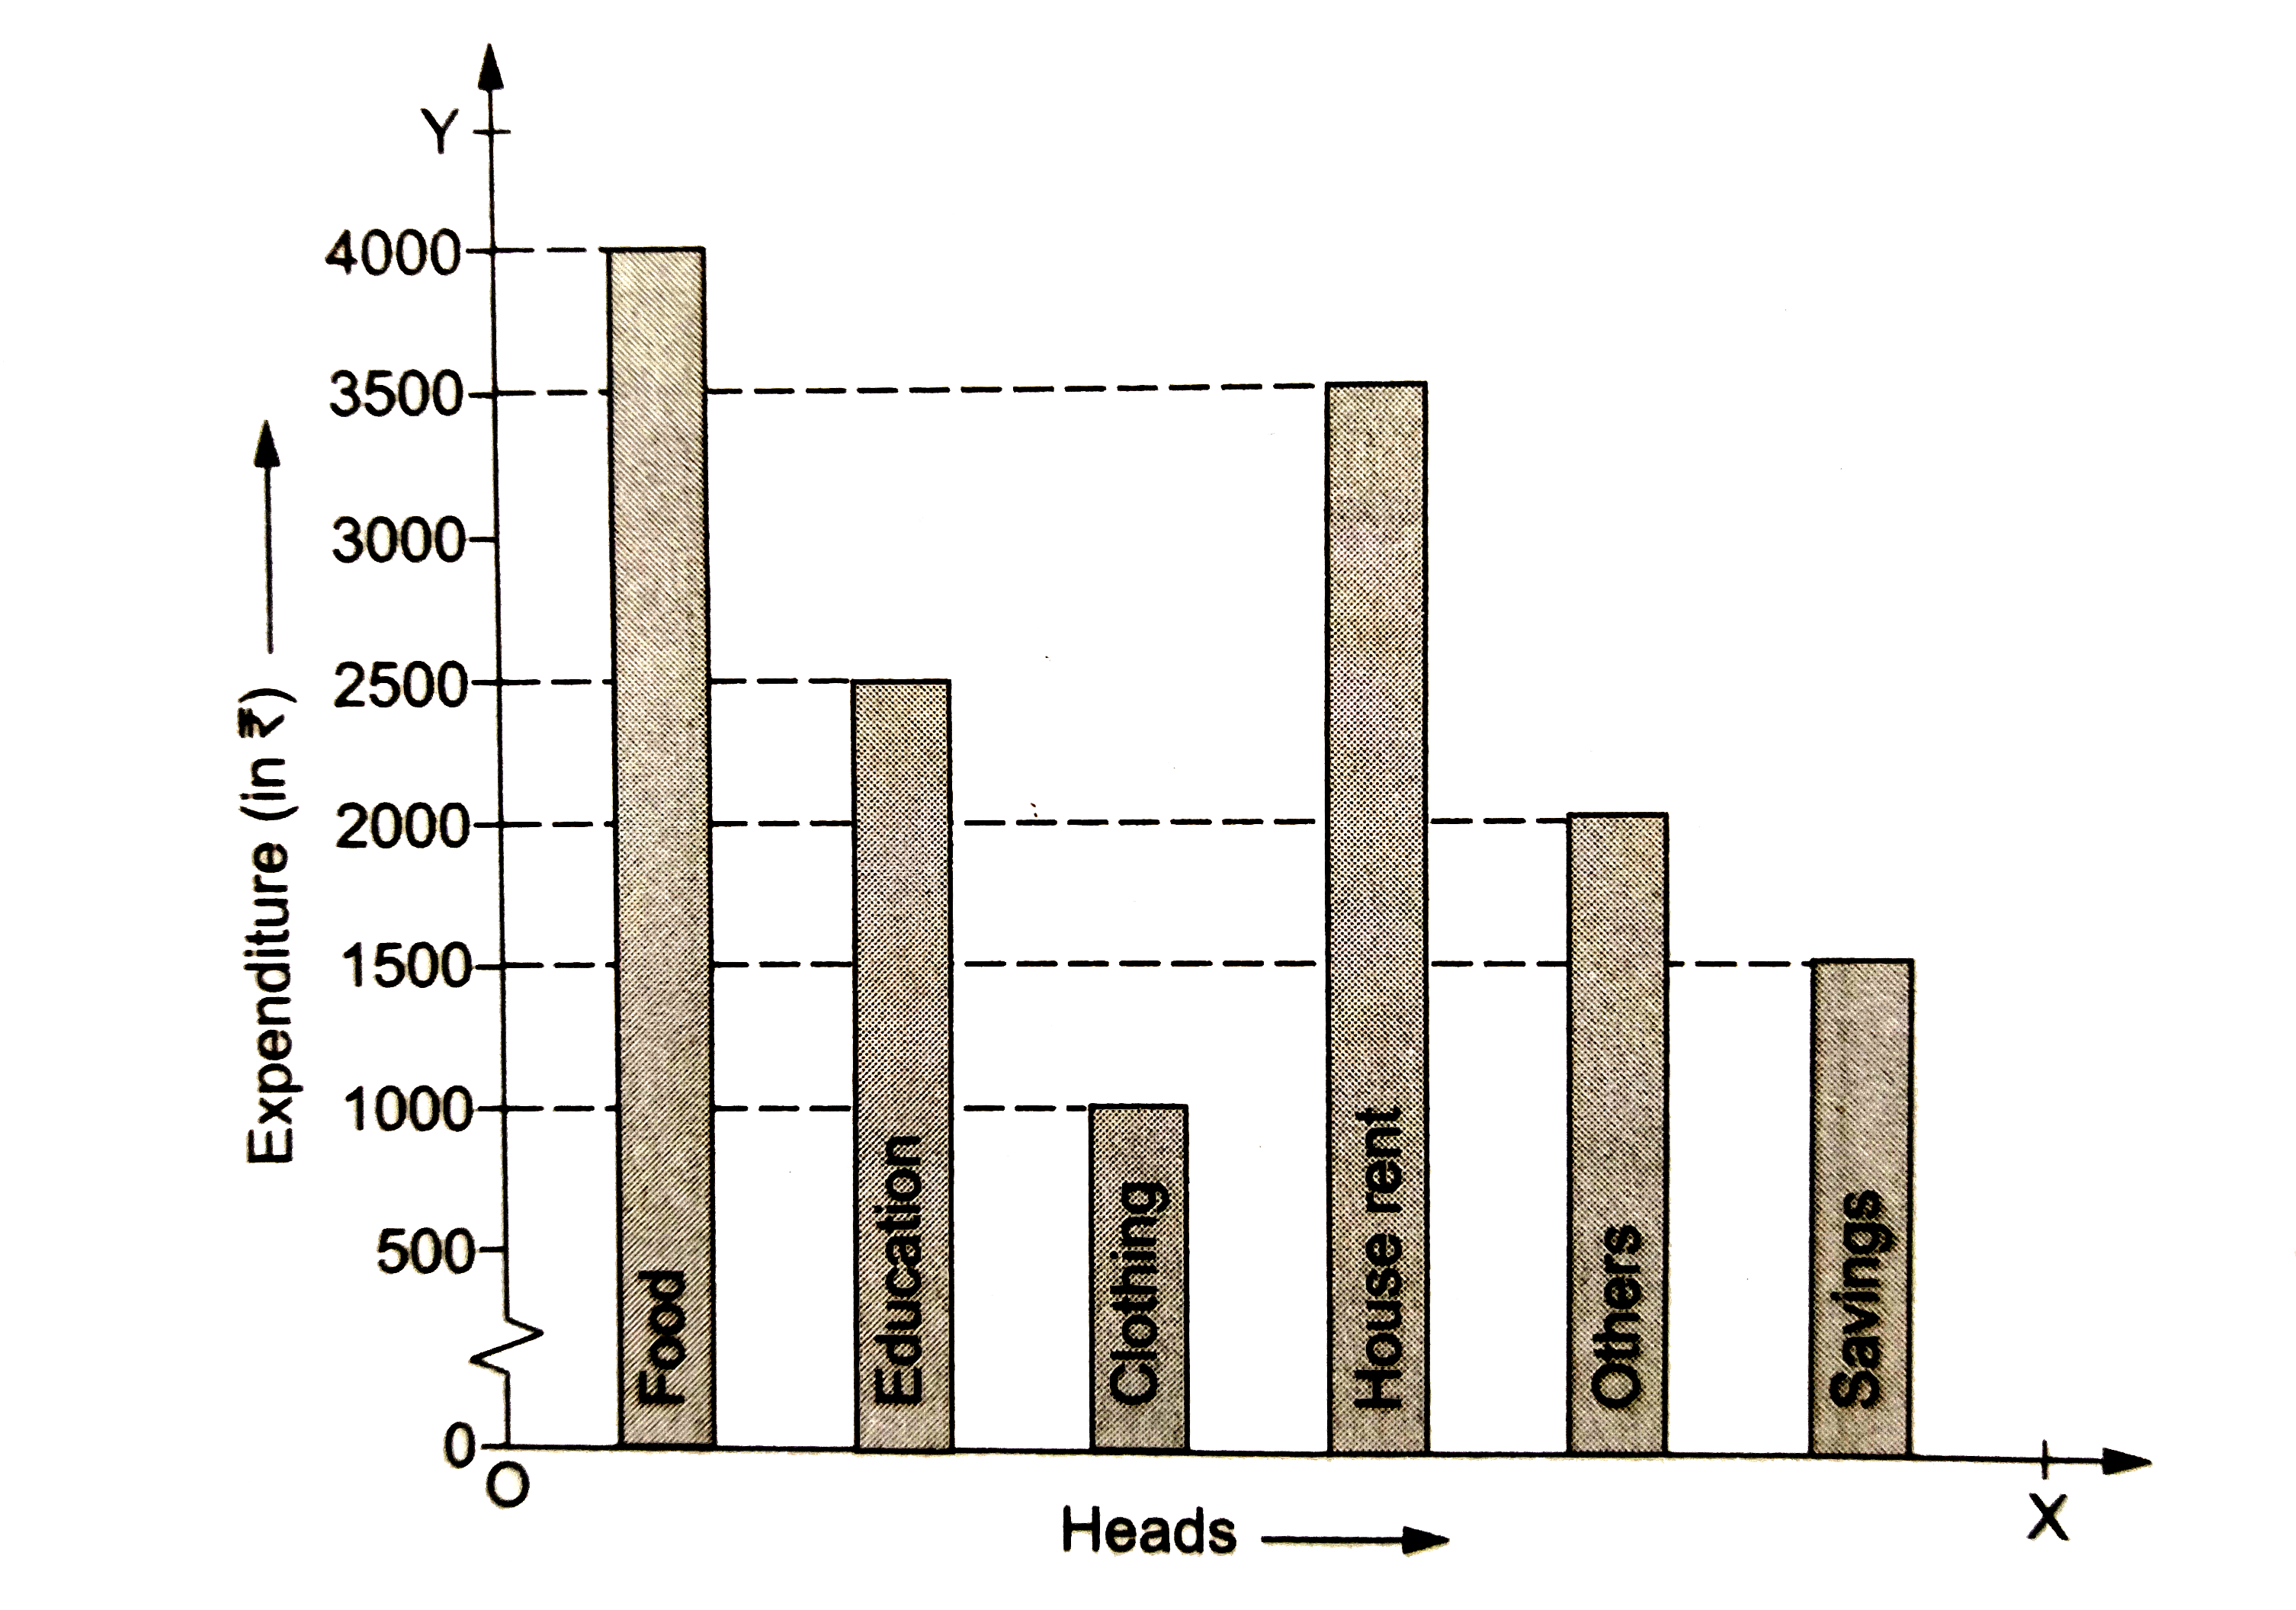
The expenditure of a family on different heads in a month is given below:

Draw a bar graph to represent the above data.
Take the difference heads of expenditure along the x-axis and the corresponding expenditure (in) along the y-axis. Draw the bars of the same width having their heights proportional to the expenditure in corresponding heads, keeping the same space between two consecutive bars, as shown below.
Topper's Solved these Questions
- BAR GRAPH, HISTOGRAM AND FREQUENCY POLYGONBOOK - RS AGGARWALCHAPTER - BAR GRAPH, HISTOGRAM AND FREQUENCY POLYGONEXERCISE - EXAMPLE
11 Videos
- BAR GRAPH, HISTOGRAM AND FREQUENCY POLYGONBOOK - RS AGGARWALCHAPTER - BAR GRAPH, HISTOGRAM AND FREQUENCY POLYGONEXERCISE - EXERCISE 17A
12 Videos
- AREAS OF TRIANGLES AND QUADRILATERALSBOOK - RS AGGARWALCHAPTER - AREAS OF TRIANGLES AND QUADRILATERALSEXERCISE - Multiple Choice Questions (Mcq)
16 Videos
- CIRCLES BOOK - RS AGGARWALCHAPTER - CIRCLES EXERCISE - MULTIPLE CHOICE QUESTION(MCQ)
37 Videos
Similar Questions
The expenditure of a family of different heads in a month is given below

Draw a bar graph to represent the data above.
View SolutionThe number of ATMs of different banks in a city is shown below:
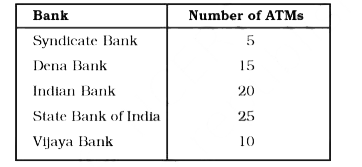
Draw a bar graph to represent the above information by choosing the scale of your choice.
View SolutionHome appliances sold by a shop in one month are given as below:
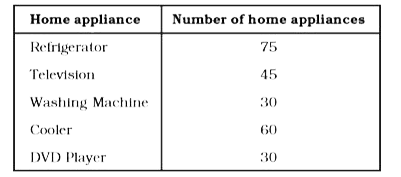
Draw a bar graph to represent the above information.
View SolutionThe income of a family i different year are as follows. Draw a bar graph to represent the data
View SolutionThe percentage of expenditure on different heads in a budget of a state is as shown below :

Draw a pie diagram to represent the information .
View Solution70 students from a locality use different modes of transport to go to school as given below:

Draw the bar graph representing the above data.
View Solution70 students from a locality use different modes of transport to go to school as given below:
 Draw the bar graph representing the above data.
View SolutionThe lengths in km (rounded to nearest hundred) of some major rivers of India is given below:
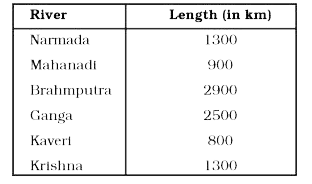
Draw a bar graph to represent the above information.
View SolutionThe production of oil (in lakh tonnes) in some of the refineries in India during 2008 is given below :
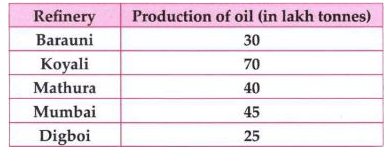
Construct a bar graph to represent the above data
View SolutionNumber of mobile phone users in various age groups in a city is listed below:
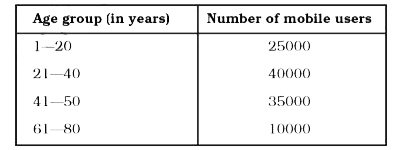
Draw a bar graph to represent the above information.
View Solution
