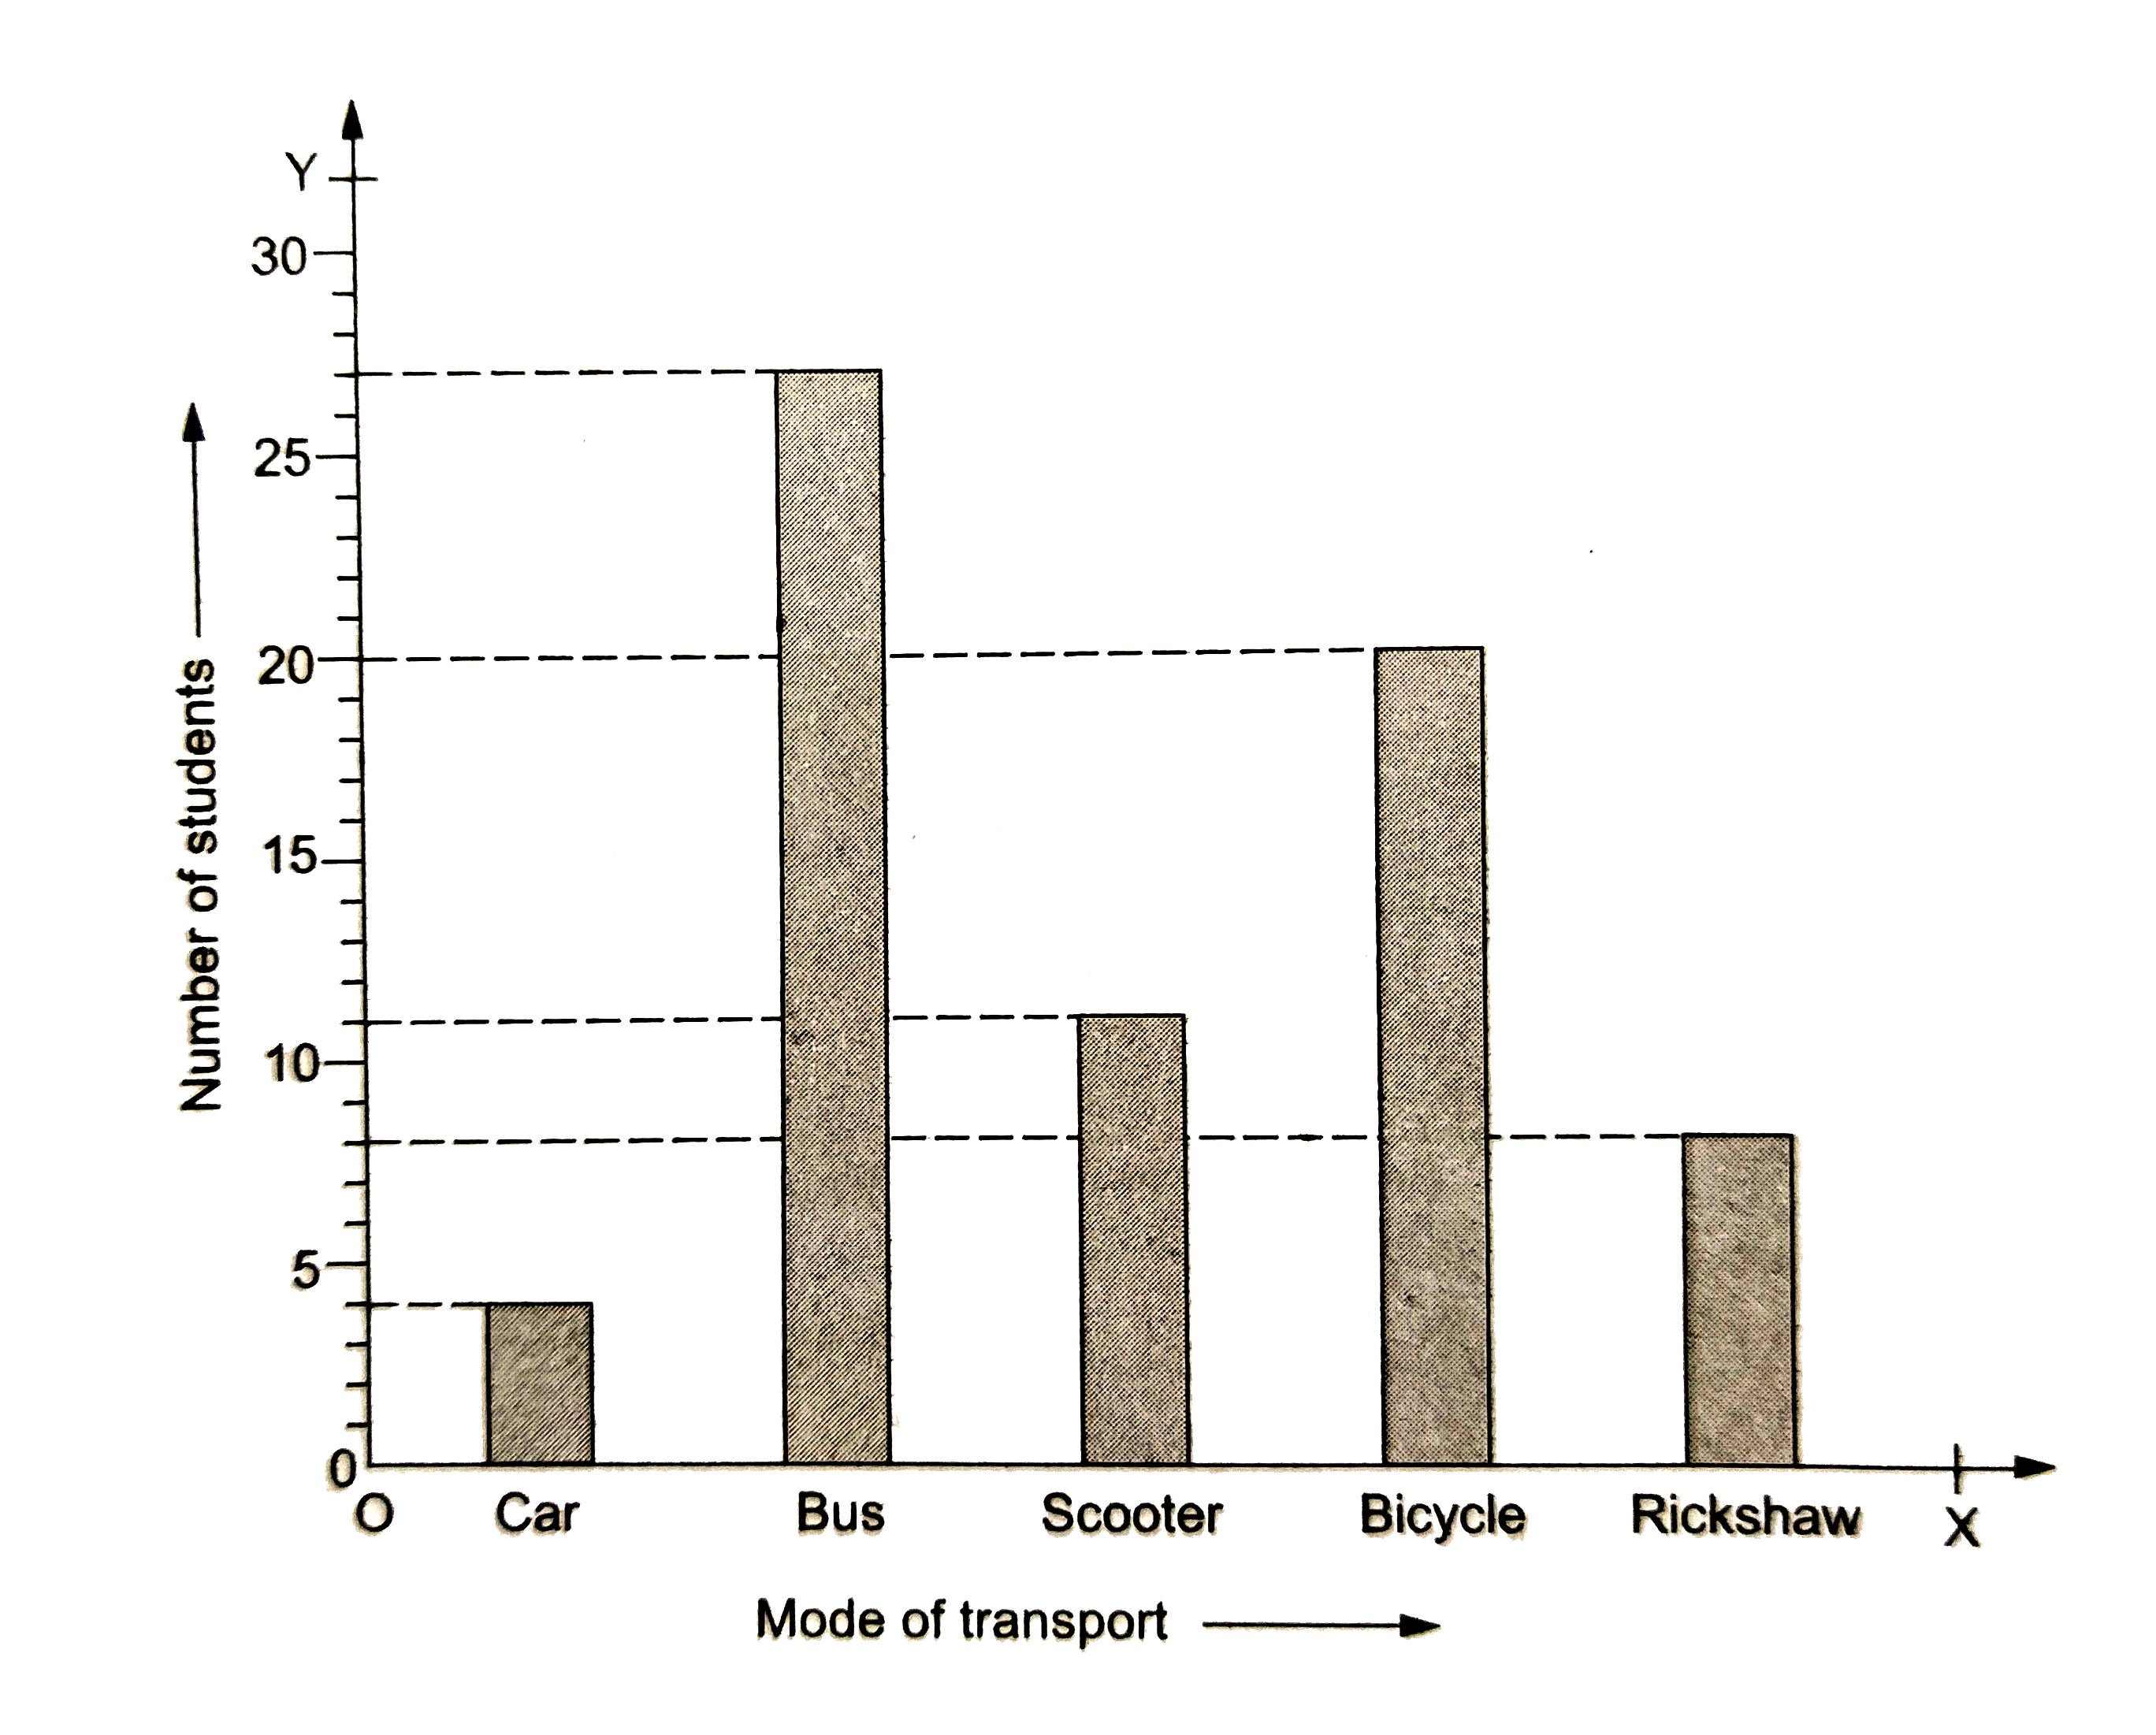
70 students from a locality use different modes of transport to go to school as given below:

Draw the bar graph representing the above data.
Take the mode of transport along the x-axis and the number of students along the y-axis. All the bars should be of the same width and same space should be left between the consecutive bars. These bars may be drawn as shown below:
Topper's Solved these Questions
- BAR GRAPH, HISTOGRAM AND FREQUENCY POLYGONBook:RS AGGARWALChapter:BAR GRAPH, HISTOGRAM AND FREQUENCY POLYGONExercise:EXAMPLE
Explore 11 Videos
- BAR GRAPH, HISTOGRAM AND FREQUENCY POLYGONBook:RS AGGARWALChapter:BAR GRAPH, HISTOGRAM AND FREQUENCY POLYGONExercise:EXERCISE 17A
Explore 12 Videos
- AREAS OF TRIANGLES AND QUADRILATERALSBook:RS AGGARWALChapter:AREAS OF TRIANGLES AND QUADRILATERALSExercise:Multiple Choice Questions (Mcq)
Explore 16 Videos
- CIRCLES Book:RS AGGARWALChapter:CIRCLES Exercise:MULTIPLE CHOICE QUESTION(MCQ)
Explore 37 Videos
Similar Questions
51 students from a locality use different modes of transport to school, as shown by the bar graph given below:
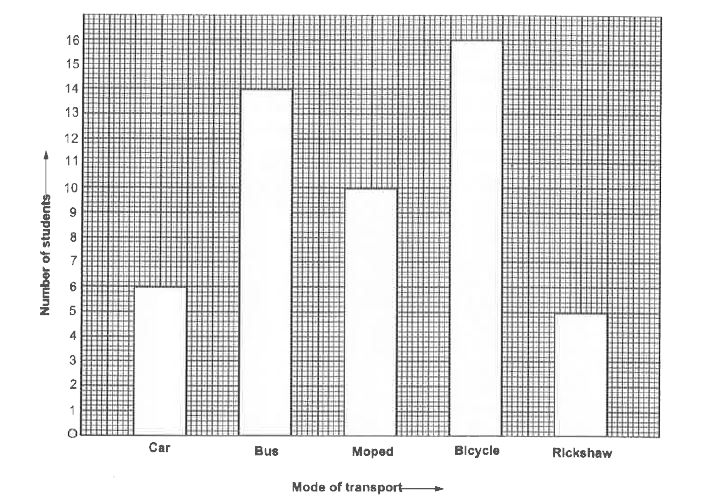
Look at the bar graph given above and answer the question given below:
What does the above bar graph show ?
Which mode of transport is used by maximum number of students ?
How many students use bus for going to school ?
How many students of the locality do not use bus for going to school ?
View Solution51 students from a locality use different modes of transport to go to school as shown by the bar graph given below.
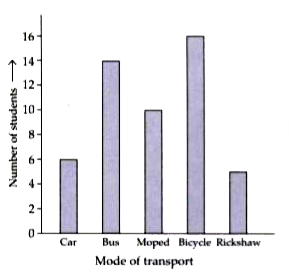
Assertion : Bicycle is used by maximum number of students.
Reason : Height of bar corresponding to bicycle is maximum. So, most students use bicycle to go to school.
View Solution
Knowledge Check
In an Institution there are 800 students. Students use different modes of transport for going to the intitution and return. The given pie diagram represents the requisite data. Study the diagram carefully and answer the questions.
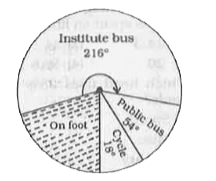
The number of students who go to institute on foot isA160B170C120D106In an Institution there are 800 students. Students use different modes of transport for going to the intitution and return. The given pie diagram represents the requisite data. Study the diagram carefully and answer the questions.
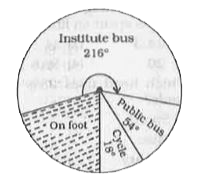
The number of students who travel in public bus isA150B120C130D125
Given below is the data of school going students (boys and girls):

Draw the bar graph to represent the above data.
View SolutionThe runs scored by a cricket team in first 10 overs are given below:

Draw a line graph representing the above data.
View SolutionThe expenditure of a family of different heads in a month is given below

Draw a bar graph to represent the data above.
View SolutionThe sales of a shopkeeper in the first week of january 2012, are given below :

Draw a graph representing the above data.
View SolutionThe approximate speeds of some objects are given below. Draw a bar graph to represent them:

View SolutionHome appliances sold by a shop in one month are given as below:
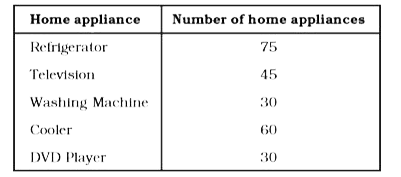
Draw a bar graph to represent the above information.
View Solution

