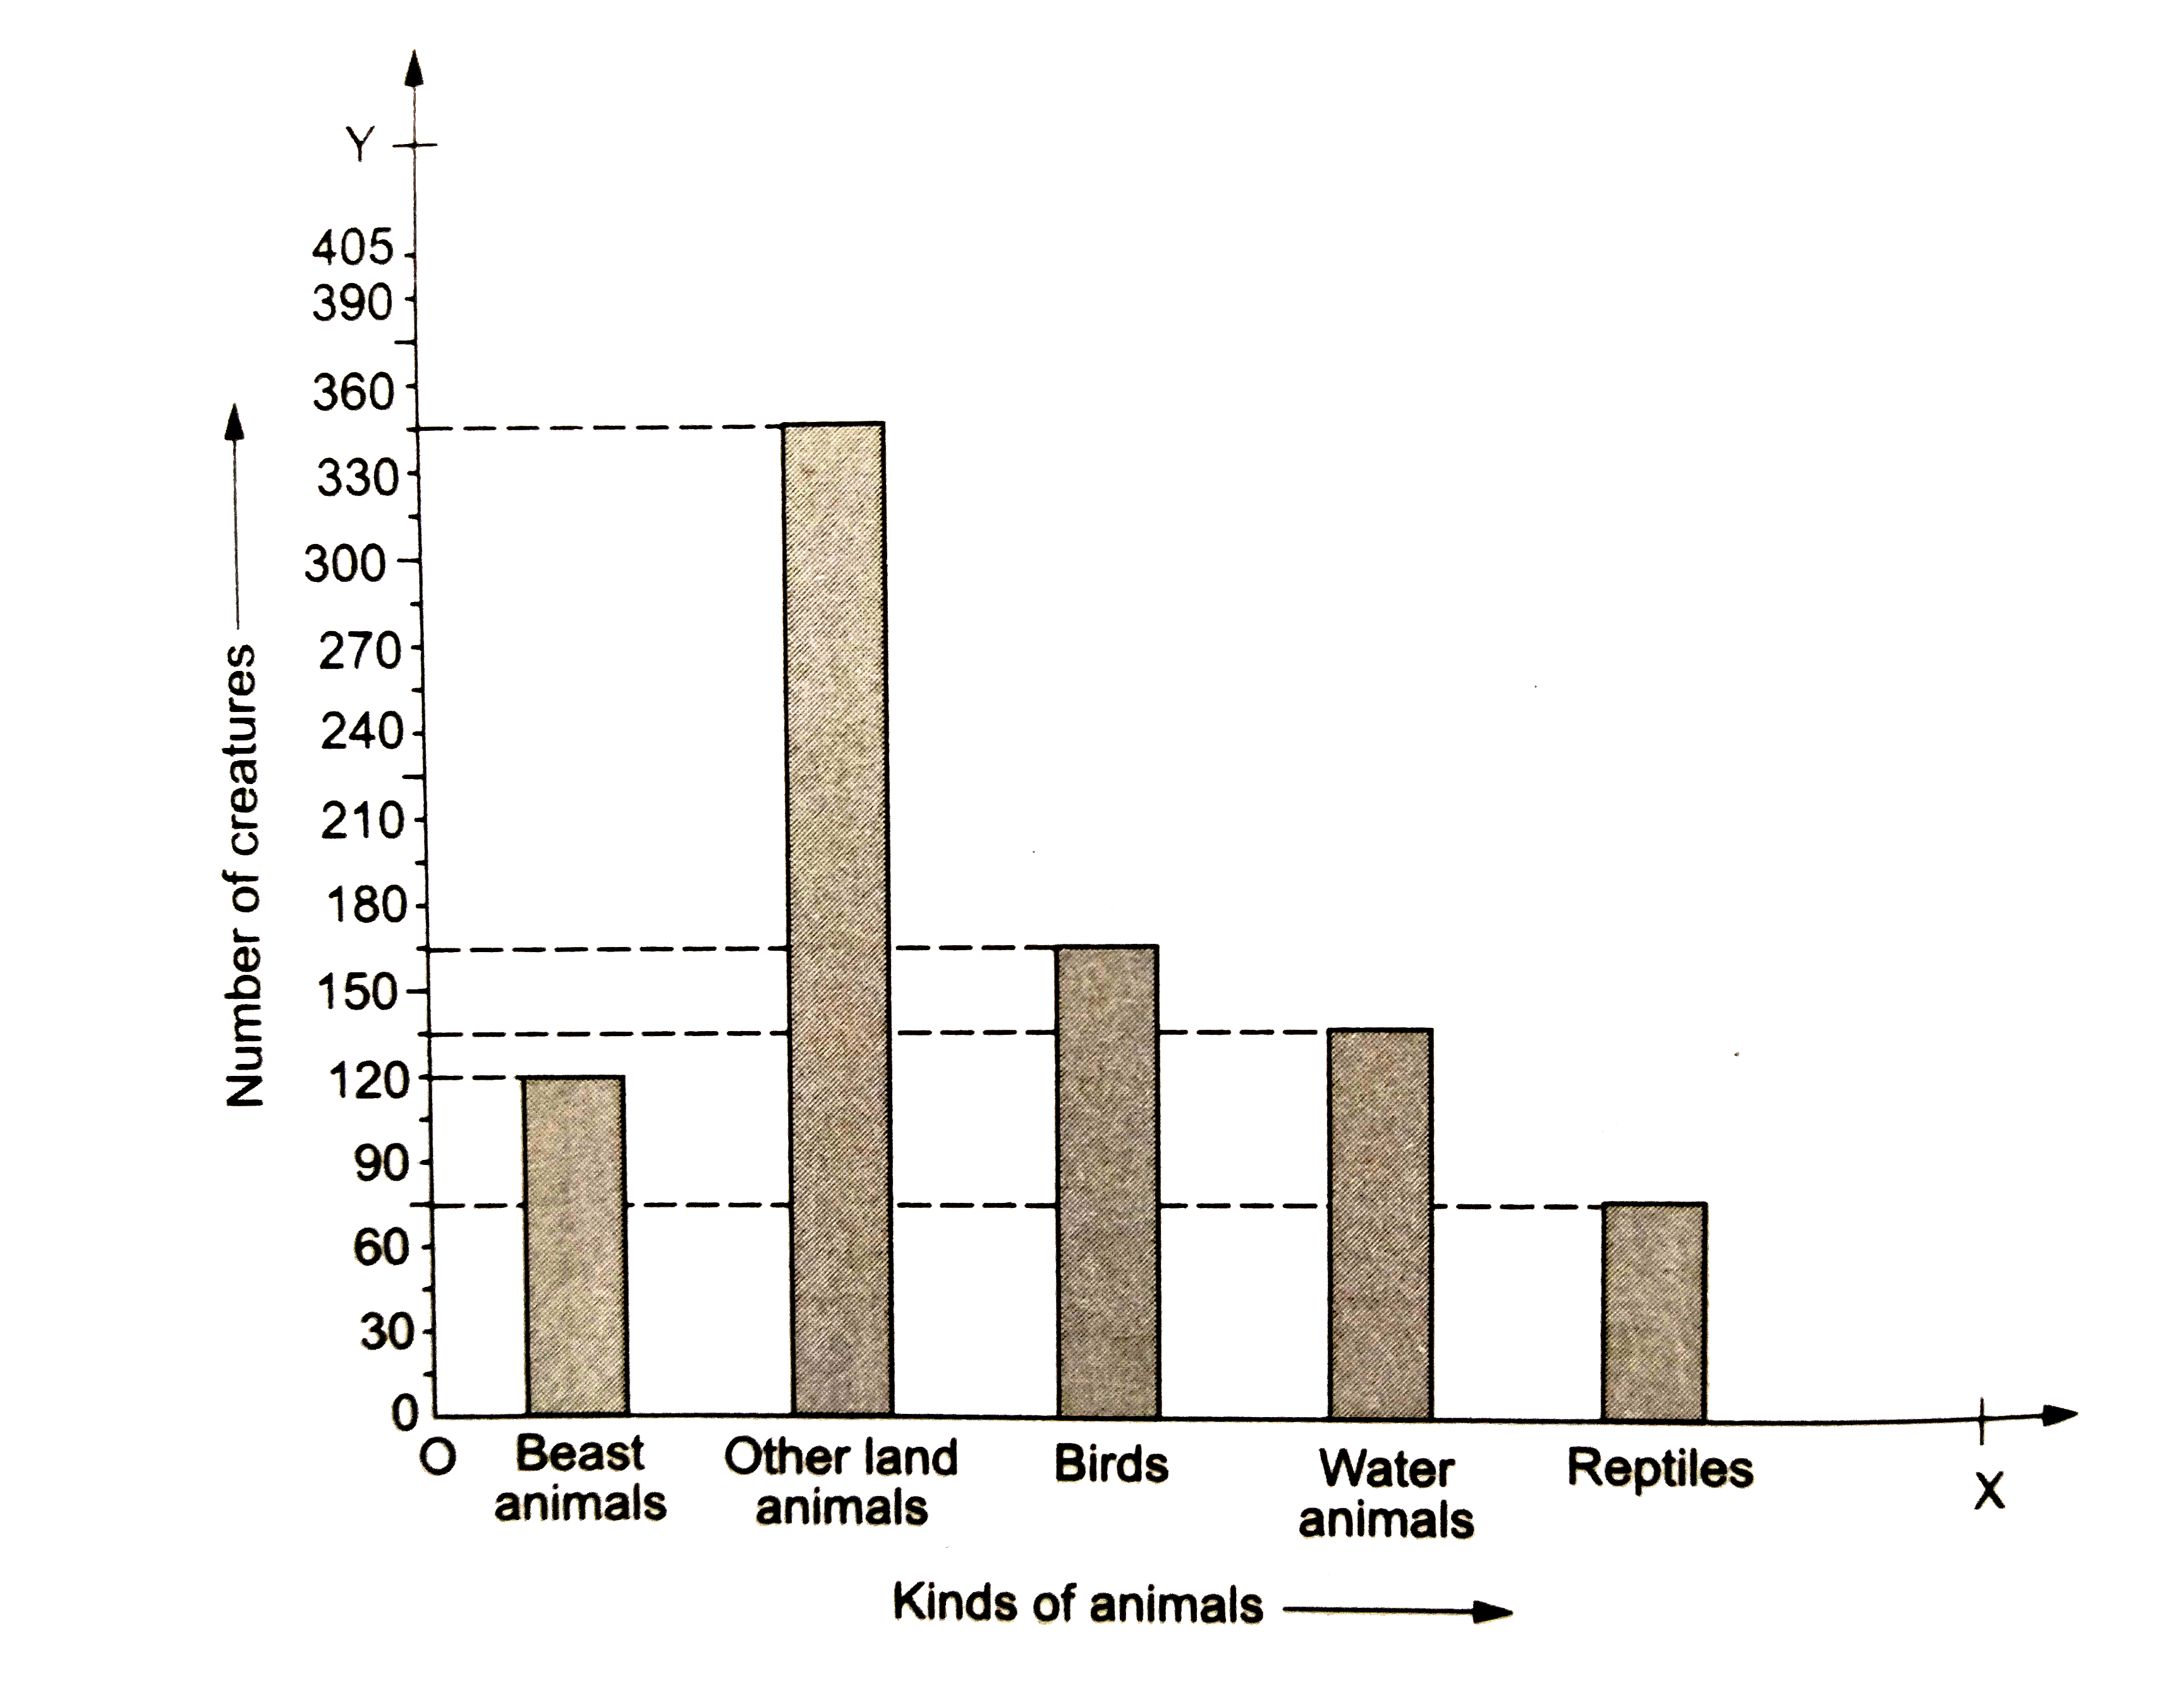
There are 840 creatures in a zoo as per list given below:

Represent the above data by a bar chart.
Take the kinds of animals along the x-axis and the corresponding number of these animals along the y-axis. Draw the bars of the same width and the same space should be lect between the consecutive bars. The heights of these bars should be proportional to their number, as shown below.

Topper's Solved these Questions
- BAR GRAPH, HISTOGRAM AND FREQUENCY POLYGONBOOK - RS AGGARWALCHAPTER - BAR GRAPH, HISTOGRAM AND FREQUENCY POLYGONEXERCISE - EXAMPLE
11 Videos
- BAR GRAPH, HISTOGRAM AND FREQUENCY POLYGONBOOK - RS AGGARWALCHAPTER - BAR GRAPH, HISTOGRAM AND FREQUENCY POLYGONEXERCISE - EXERCISE 17A
12 Videos
- AREAS OF TRIANGLES AND QUADRILATERALSBOOK - RS AGGARWALCHAPTER - AREAS OF TRIANGLES AND QUADRILATERALSEXERCISE - Multiple Choice Questions (Mcq)
16 Videos
- CIRCLES BOOK - RS AGGARWALCHAPTER - CIRCLES EXERCISE - MULTIPLE CHOICE QUESTION(MCQ)
37 Videos
Similar Questions
In a school, there are five sections of Class VI. The number of students in each section is given below:

Represent the above data using a bar graph.
View SolutionGiven below is the result of an annual examination of a class, showing the percentage of students in each category .

Represent the above data by a pie chart.
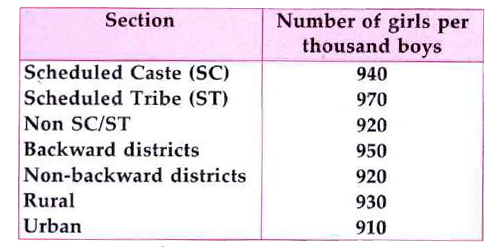
View SolutionThe following data on the number of girls (to the nearest ten) per thousand boys in different sections of Indian society is given below

Represent the information above by a bar graph.
View SolutionThe following table shows the expenditure of a family whose monthly income is * 22,000.Represent the above data by a pie chart.
View SolutionThe following table shows the percentage of buyers of four different brands of bathing soaps.

Represent the above data by a pie chart.
View SolutionExpenditure on education of a country during a five years period (2002-2006), in crore of rupees, is given below

Represent the information above by a bar graph.
View SolutionThe runs scored by a cricket team in first 10 overs are given below:

Draw a line graph representing the above data.
View SolutionThe following table shows the number of fruits in a fruit shop. Represent the above data by a bar graph
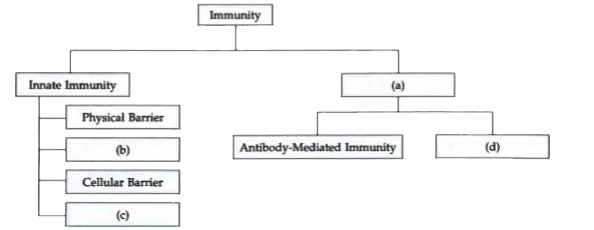
View SolutionComplete the flow chart given below:

View SolutionThe expenditure of a family of different heads in a month is given below

Draw a bar graph to represent the data above.
View Solution
