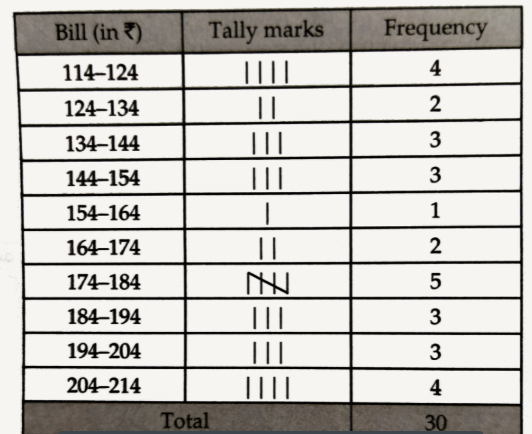
The water-tax bills in (in rupee) of 30 houses in a locality are given below:
144,184,130,195,132,134,196,114,212,174,188,210,202,145,175,154,174,178,166,146,135,115,120,114,140,188,179,166,210,208.
Construct a frequency distribution table with class size 10.
The minimum observation is 114 and the maximum observation is 212.
∴range=(212−114)=98
Class size=10.
Since 98÷10=9.8, we should have 10 classes, each of size 10.
The class of equal size, convering the above data are:
114-124,124-134,134-144,144-154,154-164,164-174,174-184,184-194,194-204 and 204,214
The frequency distribution table may be presented as shown below:

Topper's Solved these Questions
- PRESENTATION OF DATA IN TABULAR FORMBOOK - RS AGGARWALCHAPTER - PRESENTATION OF DATA IN TABULAR FORMEXERCISE - EXAMPLE
1 Videos
- PRESENTATION OF DATA IN TABULAR FORMBOOK - RS AGGARWALCHAPTER - PRESENTATION OF DATA IN TABULAR FORMEXERCISE - Exercise 16
14 Videos
- POLYNOMIALSBOOK - RS AGGARWALCHAPTER - POLYNOMIALSEXERCISE - Multiple Choice Questions (Mcq)
32 Videos
- PROBABILITYBOOK - RS AGGARWALCHAPTER - PROBABILITYEXERCISE - Multiple Choice Questions (Mcq)
16 Videos
Similar Questions
The water tax bills (in rupees) of 30 houses in a locality are given below. Construct a grouped frequency distribution with class size of 10. 30,32,45,54,74,78,108,112,66,76,88,40,14,20,15,35,44,66, 75,84,95,96,102,110,88,74,112,14,34,44
View SolutionThe water tax bills (in rupees) of 30 hours in a locality are given below. Construct a grouped frequency distribution with class size of 10. 30,32,45,54,74,78,108,112,66,76,88,40,14,20,15,35,44,66,75,84, 95,96,102,110,88,74,112,14,34,44
View SolutionDirections (Questions 11 to 15): Study the following table carefully and answer the questions given below: Number (N) of Candidates (In lakhs) Appearing For An Entrance Examination From Six Different States And The Percentage (P) of Candidates Clearing the Same Over the Years STATE → A B C D E F YEAR ↓ N P N P N P N P N P N P 2004 1.23 42 1.04 51 1.11 32 1.32 24 1.23 36 1.33 31 2005 1.05 43 1.12 62 1.07 47 1.15 49 1.18 55 1.24 24 2006 2.04 38 1.48 32 1.08 28 1.96 35 1.42 49 1.58 26 2007 1.98 41 2.07 43 1.19 30 1.88 46 1.36 47 1.79 29 2008 1.66 53 1.81 50 1.56 42 1.83 60 1.73 57 1.86 34 2009 1.57 39 1.73 36 1.64 52 2.01 56 1.69 55 1.95 37 What is the ratio of the total number of candidates clearing the entrance examination from State B in the year 2004 to that of those clearing the entrance examination from State C in the same year? (a) 221 : 148 (b) 218 : 143 (c) 148 : 221 (d) 143 : 218 (e) None of these
View Solution
