The relative humidity (in %) of a certain city for a month of 30 days was as follws:

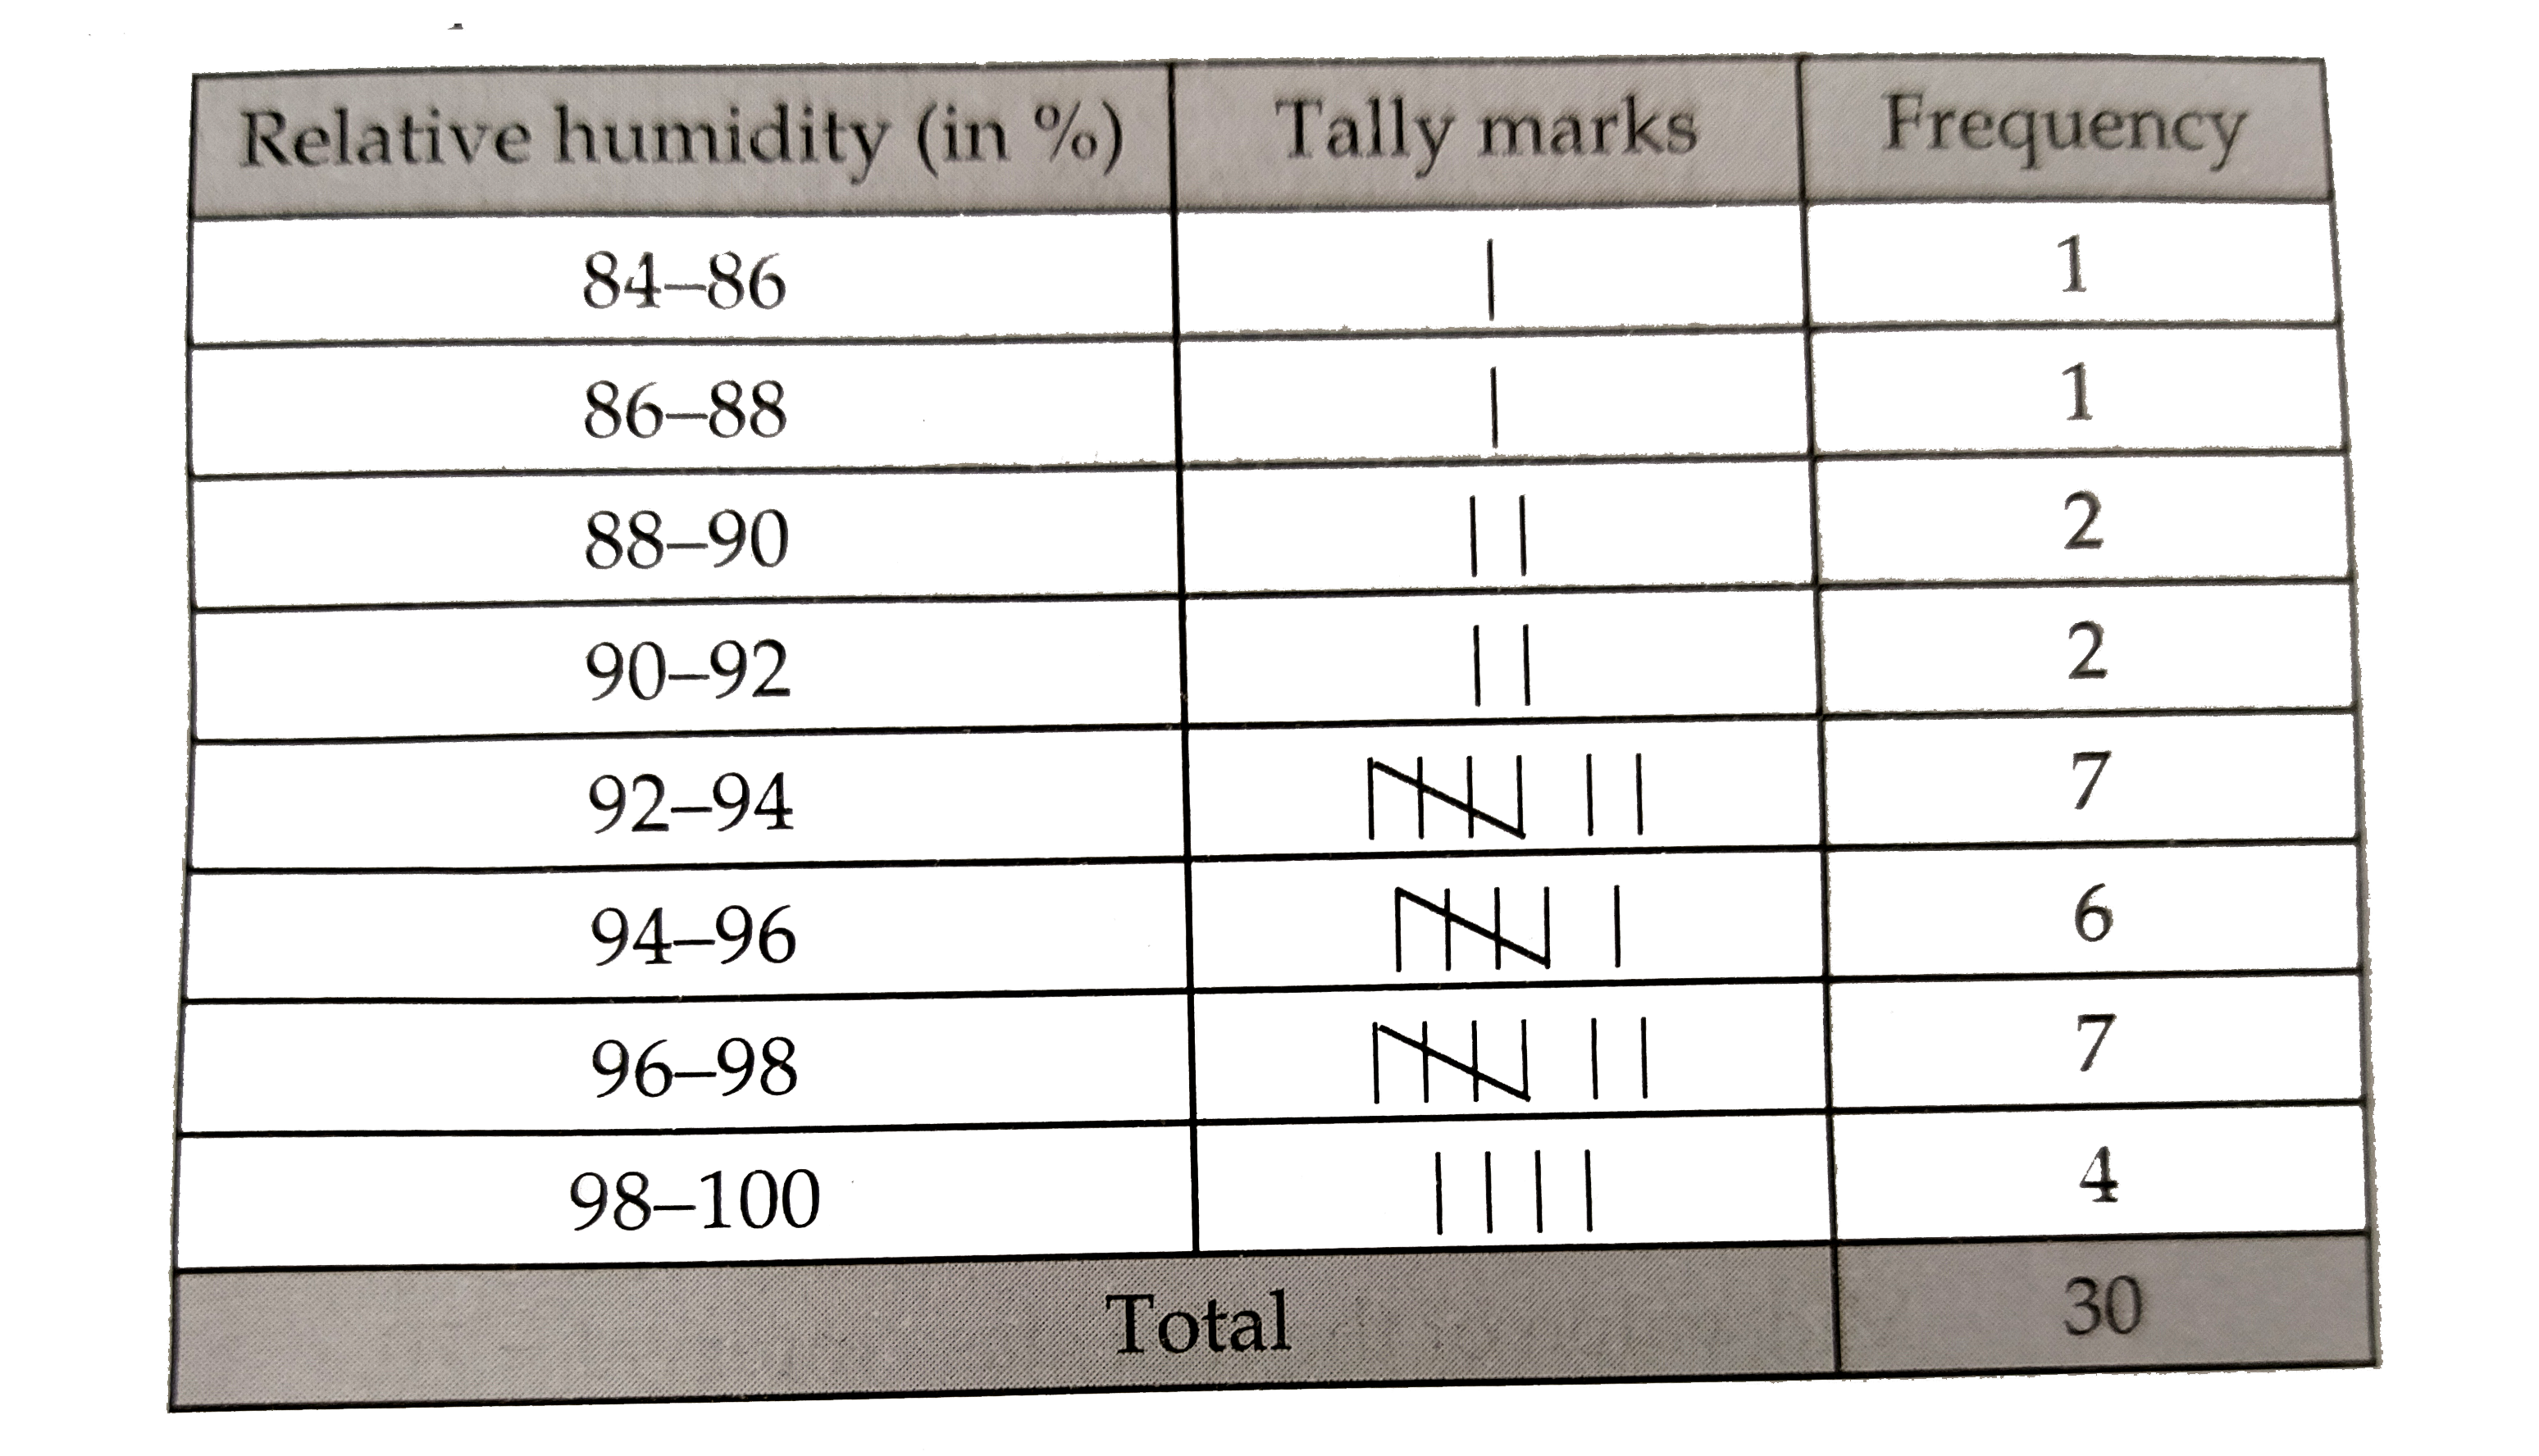
(i) Construct a grouped frequency distribution table with classes 84-86, 86-88 etc,
(ii) Which season do you think this data is about?
(iii) What is the range of this data.
(i) The required frequency table is given below:

(ii) Since the humidity in the air is more in percentage, the data is therefore related to the rainy season:
(iii) Range of the data=(99.2-84.9)=14.3
Topper's Solved these Questions
- PRESENTATION OF DATA IN TABULAR FORMBOOK - RS AGGARWALCHAPTER - PRESENTATION OF DATA IN TABULAR FORMEXERCISE - Exercise 16
14 Videos
- PRESENTATION OF DATA IN TABULAR FORMBOOK - RS AGGARWALCHAPTER - PRESENTATION OF DATA IN TABULAR FORMEXERCISE - EXERCISE 19
1 Videos
- PRESENTATION OF DATA IN TABULAR FORMBOOK - RS AGGARWALCHAPTER - PRESENTATION OF DATA IN TABULAR FORMEXERCISE - Multiple Choice Questions (Mcq)
9 Videos
- POLYNOMIALSBOOK - RS AGGARWALCHAPTER - POLYNOMIALSEXERCISE - Multiple Choice Questions (Mcq)
32 Videos
- PROBABILITYBOOK - RS AGGARWALCHAPTER - PROBABILITYEXERCISE - Multiple Choice Questions (Mcq)
16 Videos
Similar Questions
The relative humidity (in %) of a certain city for a month of 30 days was as follows: 98.1 98.6 99.2 90.3 86.5 95.3 92.9 96.3 94.2 95.189.2 92.3 97.1 93.5 92.7 95.1 97.2 93.3 95.2 97.396.2 92.1 84.9 90.2 95.7 98.3 97.3 96.1 92.1 89 (i) Construct a grouped frequency distribution table with classes 84 - 86, 86 - 88, etc.(ii) Which month or season do you think this data is about?(iii) What is the range of this data?
View SolutionA study was conducted to find out the concentration of sulphur dioxide in the air in parts per million (ppm) of a certain city. The data obtained for 30 days is a follows :

(i) Make a grouped frequency distribution table for this data with class-intervals as 0.00−0.04,0.04−0.08 and so on.
(ii) For how many day's was the concentration of sulphar dioxide more than 0.11 parts per million (ppm)?
View SolutionThe distance (in km) of 40 engineers from their residence to their place of work were found as follows.

Construct a grouped frequency distribution table with calss- size 5 for the data given above taking the first interval as 0-5 (5 not included). What main features do you observe from this tabular representation?
View SolutionThe heights of 50 students, measured to the nearest centimetres have been found to be as follows:

(i) Represent the data given above by a grouped frequency distribution table, taking class intervals as 160-165, 165-170 etc.
(ii) What can you conclude about their heights from the table ?
View SolutionThe relative humidity (in % ) of a certain city for a month of 30 days was as follows: 98.1 98.6 99.2 90.3 86.5 95.3 92.9 96.3 94.2 95.1 89.2 92.3 97.1 93.5 92.7 95.1 97.2 93.3 95.2 97.3 96.2 92.1 84.9 90.2 95.7 98.3 97.3 96.1 92.1 89
What is the range of this data?
View SolutionFor the following data of daily wages (in rupees0 received by 30 labourers in a certain factory, construct a grouped frequency distribution table by dividing the range into class intervals of equal width, each corresponding to 2 rupees, in such a way that the mid-value of the first class interval corresponds to 12 rupees. 14,16,16,14,22,13,15,24,12,23,14,20,17,21,22,18,18,19,20,17,16,15,11,12,21,20,17,18,19,23
View SolutionThe distance (in km) of 40 engineers from their residence to their place of work were found as follows: 5 3 10 20 25 11 13 7 12 31 19 10 12 17 18 11 32 17 16 2 7 9 7 8 3 5 12 15 18 3 12 14 2 9 6 15 15 7 6 12 Construct a grouped frequency distribution table with class size 5 for the data given above taking the first interval as 0-5 (5 not included). What main features do you observe from this tabular representation?
View SolutionThe heights of 50 students, measured to the nearest centimetres, have been found to be as follows: 161,150,154,165,168,161,154,162,150,151,162,164,171,165,158,154,156,172,160,170,153,159,161,170,162,165,166,168,165,164,154,152,153,156,158,162,160,161,173,166,161,159,162,167,168,159,158,153,154,159,
(i) Represent the data given above by a grouped frequency distribution table, taking the class intervals as 160−165,165−170, etc.
(ii) What can you conclude about their heights from the table?
View SolutionOrganise the following marks in a class assessment, in a tabular form.](i) Which number is the highest? (ii) Which number is the lowest?(iii) What is the range of the data? (iv) Find the arithmetic mean.
View SolutionThe relative humidity (in % ) of a certain city for a month of 30 days was as follows: 98.1 98.6 99.2 90.3 86.5 95.3 92.9 96.3 94.2 95.1 89.2 92.3 97.1 93.5 92.7 95.1 97.2 93.3 95.2 97.3 96.2 92.1 84.9 90.2 95.7 98.3 97.3 96.1 92.1 89
Construct a grouped frequency distribution table with classes 84 - 86, 86 - 88, etc.
View Solution
