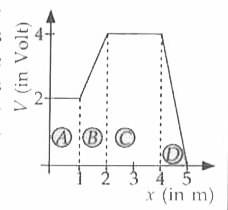
A V - X graph for an electric field in X-direction is shown in the figure. In which region is the magnitude of electric field maximum ?

(a) A
(b) B
(c) C
(d) DSolution in Gujrati
A
B
C
D
The correct Answer is:C
The slope of graph V→X indicates the intensity of electric field.
The slope in region (C) is one of the highest in given region. So the intensity of electric field is m.aximum in this region.
Topper's Solved these Questions
- ELECTROSTATIC POTENTIAL AND CAPACITANCEBook:KUMAR PRAKASHANChapter:ELECTROSTATIC POTENTIAL AND CAPACITANCEExercise:Section D ( MCQs asked in Cometitive Exams )
Explore 39 Videos
- ELECTROSTATIC POTENTIAL AND CAPACITANCEBook:KUMAR PRAKASHANChapter:ELECTROSTATIC POTENTIAL AND CAPACITANCEExercise:Section C ( NCERT Exemplar Solution ) ( Long Answer Type Questions )
Explore 12 Videos
- ELECTROMAGNETIC WAVESBook:KUMAR PRAKASHANChapter:ELECTROMAGNETIC WAVESExercise:BOARD.S QUESTION PAPER MARCH - 2020 (PART - B) SECTION - C
Explore 5 Videos
- MAGNETISM AND MATTERBook:KUMAR PRAKASHANChapter:MAGNETISM AND MATTERExercise:SECTION D Multiple Choice Questions (MCQs) (MCQs asked in Competitive Exams) MCQs asked in Board Exam and GUJCET
Explore 7 Videos
Similar Questions
Capacitance of a capacitor 100 μ F. The work is done for depositing chargc 8×10⁻¹⁸ C on it will be .........
View SolutionFind the equation of the equipotential for an infinite cylinder of radius r0 carrying charge of linear density λ.
View SolutionDetermine the current in each branch of the given network.

View SolutionAt a place on earth the vertical component of earth's magnetic field is √3 times its horizontal component. The angle of dip at this place is …...
View SolutionThe electrical potential function for an electrical field directed parallel to the x-axis is shown in the given graph. Draw the graph of electric field strength.
View SolutionA graph of the x-component of the electric field as a function of x in a region of space is shown in figure. The y−andz−compo≠nts of the electric field are zero in this region. If the electric potential is 10 V at the origin, then the potential at x = 2.0 m is

View SolutionIn an electric field region, the electric potential varies along the x-axis as shown in the graph. The x components of the electirc field in the regions for the intervals PQ and QR as market in the garph, in N/C, are respectively:

View SolutionA charge +Q at A (see figure) produces electric field E and electric potential V at D . If we now put charges -2Q and +Q at B and C respectively, then the electric field and potential at D will be
View SolutionIn a certain region of space the electric potential V is known to be constant. Is the electric field in this region (a) positive (b) zero ,or (c ) negative ?
View SolutionThe figure gives the electric potential V as a function of distance through four regions , on x-axis. Which of the following is true for the magnitude of the electric field E in these regions?

View SolutionThe electrostatic potential is given as a function of x in figure ( a) and (b) . Calculate the corresponding electric fields in regions A, B, C and D . Plot the electric field as a function of x for the figure (b).
View SolutionA charge + Q at A as shown in fig. produces electric field E and electric potential V at D. if we now put charges -2 Q and + Q at B and C respectively , then the electric field and potential at D will be :
View SolutionThe electrical potential function for an electrical field directed parallel to the x-axis is shown in the given graph. Draw the graph of electric field strength.
View SolutionA charge +Q at A as shown produces electric field E and electric potential V at D. If we now put charges - 3 Q and +Q at B and C, respectively, then the electric field and potential at D will be .
View SolutionA graph of the x-component of the electric field as a function of x in a region of space is shown in figure. The y−andz−compo≠nts of the electric field are zero in this region. If the electric potential is 10 V at the origin, then the potential at x = 2.0 m is

View Solution

