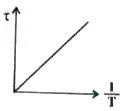
Which graph correctly represents the variation between relaxation time of gas molecules with absolute temperature (T) of the gas?Solution in Gujrati


The correct Answer is:A
Topper's Solved these Questions
- QUESTION ASKED IN NEET -2019 BOOK - KUMAR PRAKASHANCHAPTER - QUESTION ASKED IN NEET -2019 EXERCISE - MULTIPLE CHOICE QUESTIONS
9 Videos
- SYSTEMS OF PARTICLES AND ROTATIONAL MOTIONBOOK - KUMAR PRAKASHANCHAPTER - SYSTEMS OF PARTICLES AND ROTATIONAL MOTIONEXERCISE - SECTION-F (SECTION-D) QUESTIONS PAPER
1 Videos
Similar Questions
When a block of mass M is suspended by a long wire of length L, the length of the wire becomes (L+l). The elastic potential energy stored in the extended wire is:
View SolutionA rope of negligible mass is wound round a hollow cylinder of mass 3 kg and radius 40 cm. What is the angular acceleration of the cylinder if the rope is pulled with a force of 30 N? What is the linear acceleration of the rope? Assume that there is no slipping.
View SolutionWhich of the following graphs correctly represents the variation of β=−dV/dPV
with P for an ideal gas at constant temperature?
View SolutionAt a constant pressure, of the following graphs that one which represents the variation of the density of an ideal gas with the absolute temperature T, is
View SolutionWhich of the following graphs correctly represents the variation of β=−(dVdP)/V with P for an ideal gas at constant temperature
View SolutionWhich of following graphs correctly represent variation of alpha = (-(dV//dP)_(T))/(V) with P for fixed amount of an ideal gas at constant temperature ?
View Solutionकिसी गैस के परम ताप T तथा गैस में ध्वनि की चाल के वर्ग (v2) के बीच में ग्राफ खीचिए ।
View SolutionWhich graph correctly represents variation between relaxation time (t) of gas molecules with absolute temperature of gas T.
View SolutionWhich of the following graphs correctly represents the variation of β=−dV/dPV
with P for an ideal gas at constant temperature?
View SolutionWhich of the following graph best represents the relationship between absolute temperature of gas and the average kinetic energy of the gas molecules?
View SolutionWhich of the following graphs correctly represents the variation of β=−(dVdP)1V with P for an ideal gas at constant temperature ?
View SolutionWhich graph correctly represents variation between relaxation time (t) of gas molecules with absolute temperature of gas T.
View SolutionWhich graph correctly represents variation between relaxation time (t) of gas molecules with absolute temperature of gas T.
View SolutionWhich of the following graphs correctly represent the variation of beta = -(dV//dP)/(V) with P for an ideal gas at constant temperature?
View SolutionWhich of the following graphs correctly represents the variation of β=−(dV/dP)/V with P for an ideal gas at constant temperature?
View Solution
