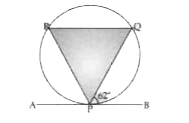
In the given figure ,APB is tangent of the circle at the point P on the circle.PQ is a chord .If ∠BPQ=62∘,then ∠PQR is equal to :
 Solution in Kannada
28∘
118∘
124∘
62∘
The correct Answer is:D
Step by step video, text & image solution for In the given figure ,APB is tangent of the circle at the point P on the circle.PQ is a chord .If angleBPQ=62^(@),then anglePQR is equal to : by Maths experts to help you in doubts & scoring excellent marks in Class 10 exams.
Updated on:21/07/2023Topper's Solved these Questions
- CIRCLES Book:OSWAAL PUBLICATIONChapter:CIRCLES Exercise:VERY SHORT ANSWER TYPE QUESTIONS
Explore 11 Videos
- CIRCLES Book:OSWAAL PUBLICATIONChapter:CIRCLES Exercise:SHORT ANSWER TYPE QUESTIONS
Explore 4 Videos
- ARITHMETIC PROGRESSIONSBook:OSWAAL PUBLICATIONChapter:ARITHMETIC PROGRESSIONSExercise:TEXTBOOK CORNER EXERCISE 1.4
Explore 5 Videos
- CO-ORDINATE GEOMETRYBook:OSWAAL PUBLICATIONChapter:CO-ORDINATE GEOMETRYExercise:TEXTBOOK CORNER (EXERCISE 7.4)
Explore 7 Videos
Similar Questions
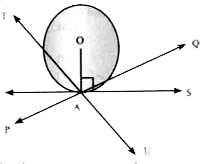
Identify then tangent to the circle in the adjoining figure and write its name.

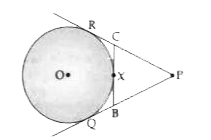
View SolutionIn the given figure,PQ,PR and BC are the tangents to the circle,BC touches the circles ,at X.If PQ=7cmthen find the perimeter of ΔPBC

View SolutionWhich term of the AP: 121,117,113……. is its first negative term?
View SolutionDetermine the ratio in which the line 2x + y - 4 = 0 divides the line segment joining the points A(2, -2) and B(3, 7).

View SolutionHow many lines of symmetry does the above figure have ?
View SolutionDetermine the point of symmetry of a regular hexagon.
View SolutionDtermine the images of the following figure about the given line :
View SolutionMatch the following Column A to Column B

View SolutionMatch the following Column A to Column B

View SolutionMatch the following Column A to Column B

View SolutionFind the area of figure given below.

View SolutionFind the perimeter of the figure given below.

View SolutionFind the area of the figure given below.

View SolutionThe area of the shaded part in the figure given below is ______.

View SolutionThe inequation represented by the graph given below is :
View SolutionThe inequation that best describes the graph given below is _________
View Solution

