In the study of a photoelectric effect the graph between the stopping potential V and frequency ν of the incident radiation on two different metals P and Q is shown in fig.
(i) which one of two metals have higher threshold frequency
(ii) Determine the work function of the metal which has greater value
(iii) Find the maximum kinetic energy of electron emitted by light of frequency 8×10¹⁴Hz for this metal.
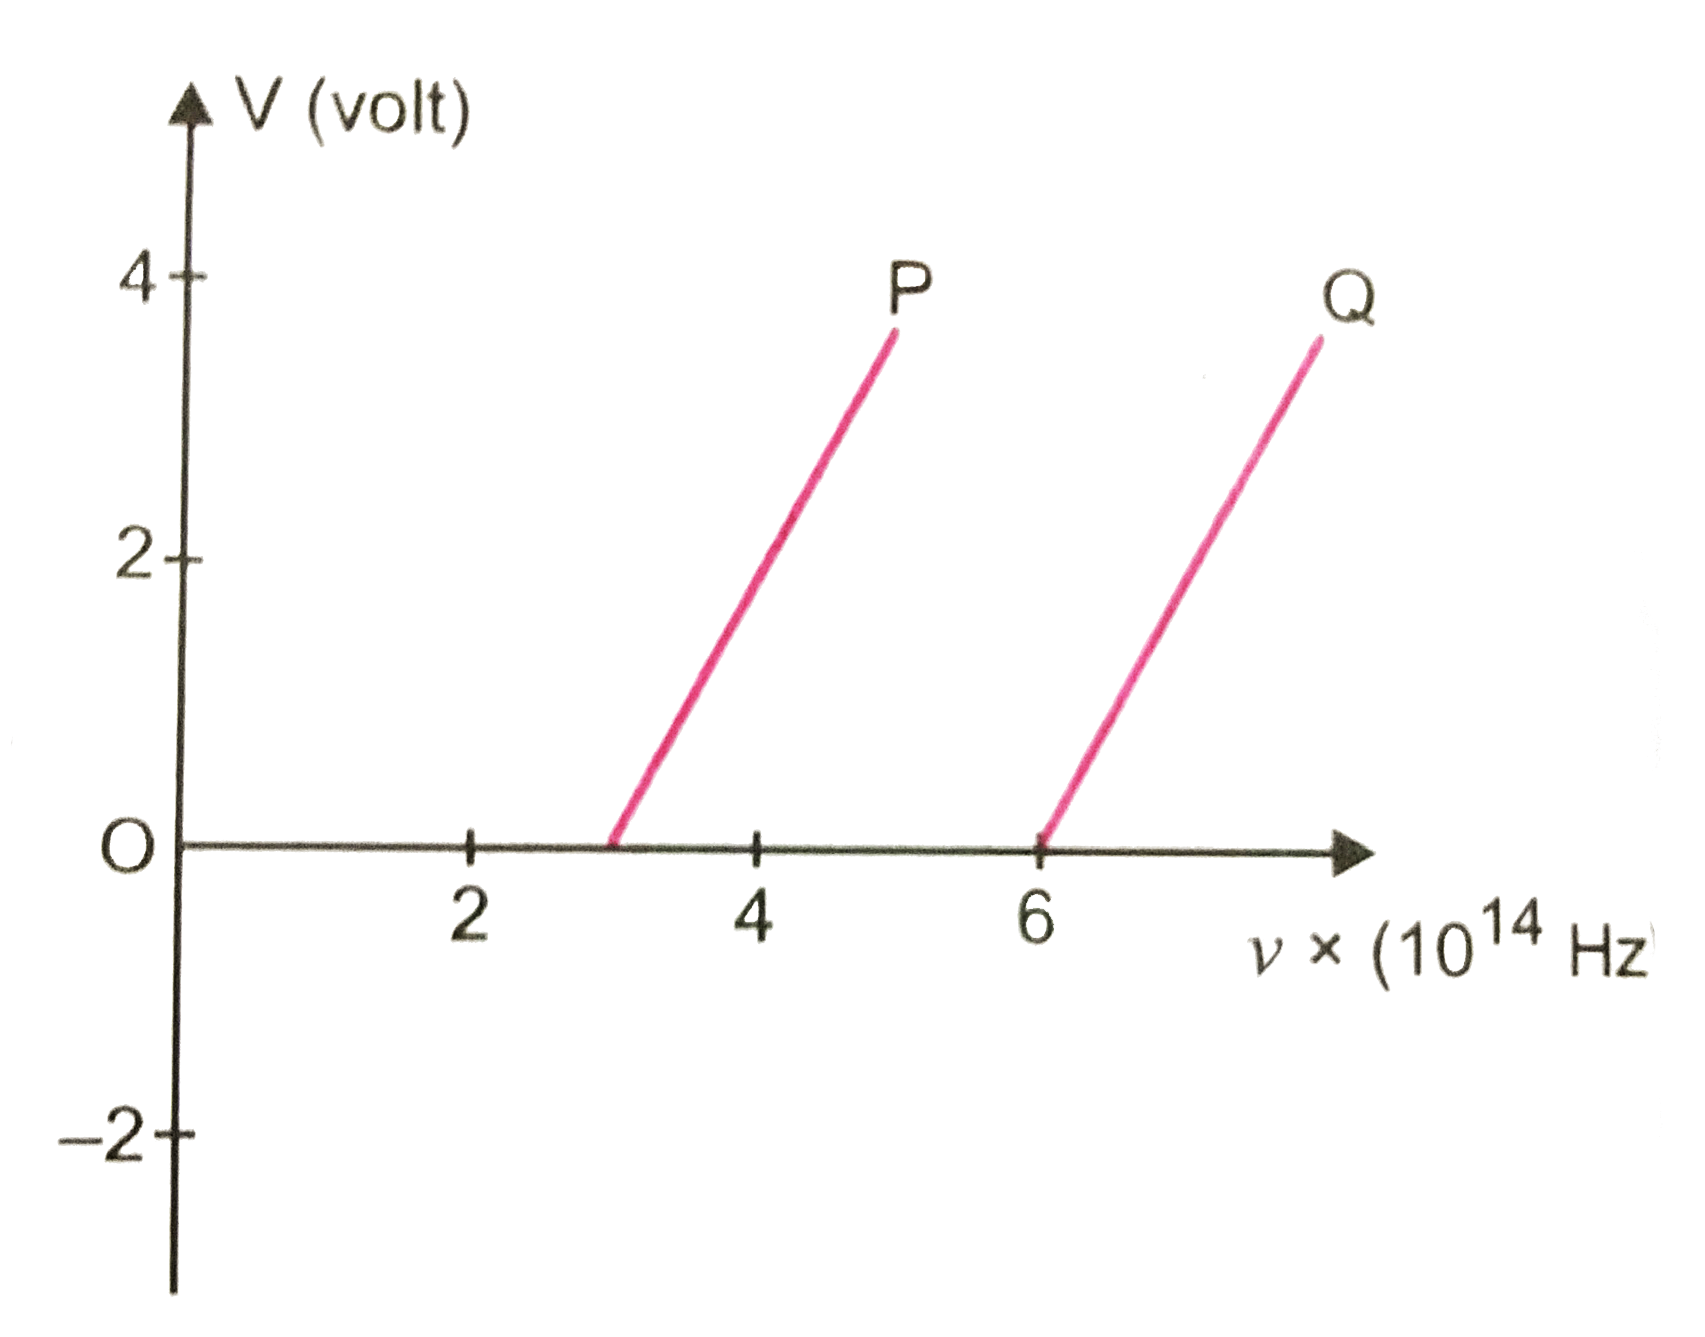
(i) Threshold frequency of metal Q is higher than P.
(ii) Also from, W=hv0 work function of Q is 6×1014×6.63×10−34
W=3.9×10⁻¹⁹ unit WQ>WP
(iii) Emax=hv−φ0=hv−hv0=h(v−v0)
=6.63(8×10¹⁴−6×1014)J×10−34J=1.33×10⁻¹⁹J.
Topper's Solved these Questions
- XII BOARDSBook:XII BOARDS PREVIOUS YEARChapter:XII BOARDSExercise:SET-III DELHI BOARD SEC-C
Explore 5 Videos
- XII BOARDSBook:XII BOARDS PREVIOUS YEARChapter:XII BOARDSExercise:[SET -II, OUTSIDE DELHI]
Explore 9 Videos
- XII BOARDSBook:XII BOARDS PREVIOUS YEARChapter:XII BOARDSExercise:SET-II DELHI BOARD (SEC-B)
Explore 2 Videos
- SAMPLE PAPER 2019Book:XII BOARDS PREVIOUS YEARChapter:SAMPLE PAPER 2019Exercise:SECTION D
Explore 6 Videos
Similar Questions
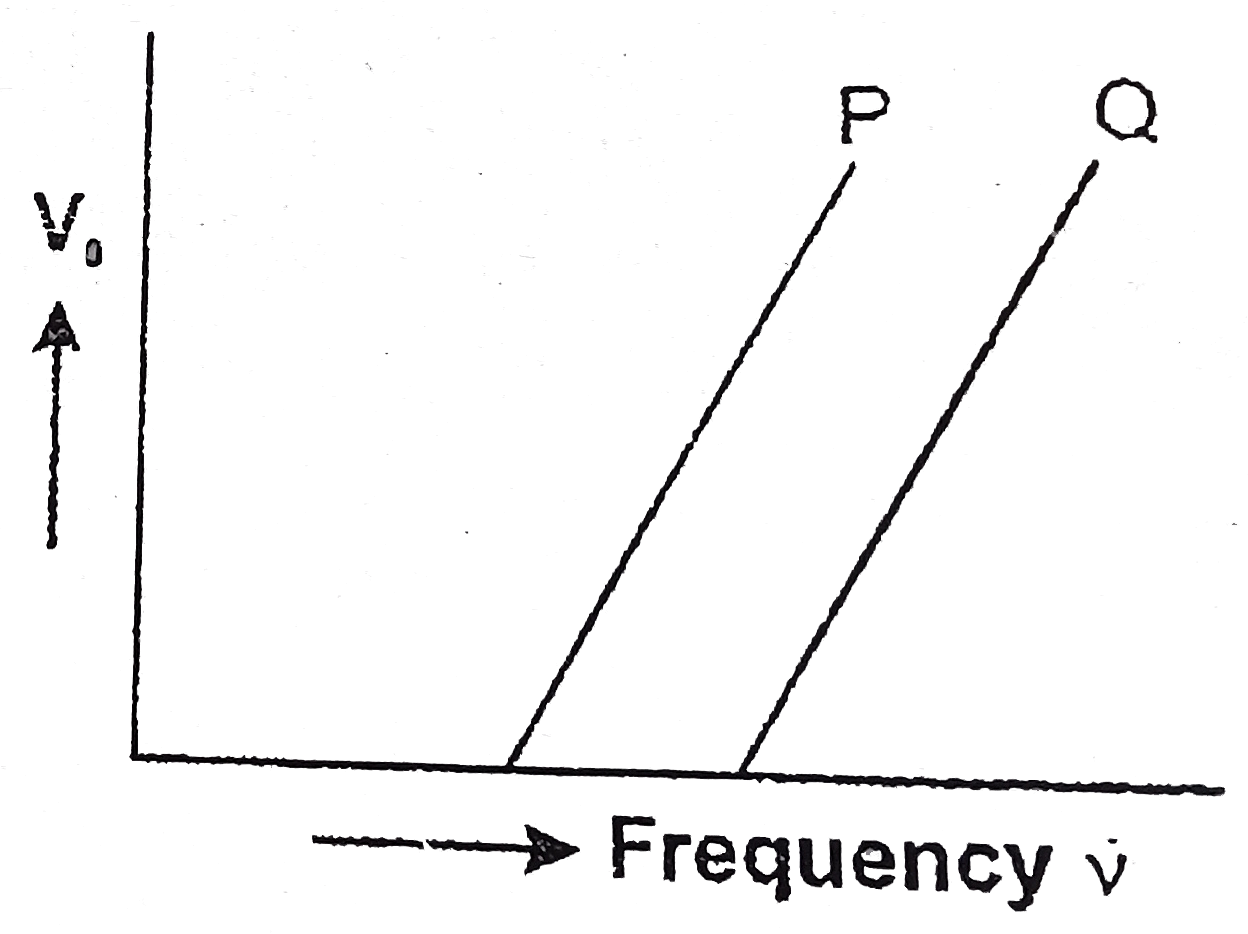
The graph between the stopping potential V0 and frequency v for two different metal plates P and Q are shown in the figure. Which of the metals has greater threshold wavelength and work function.
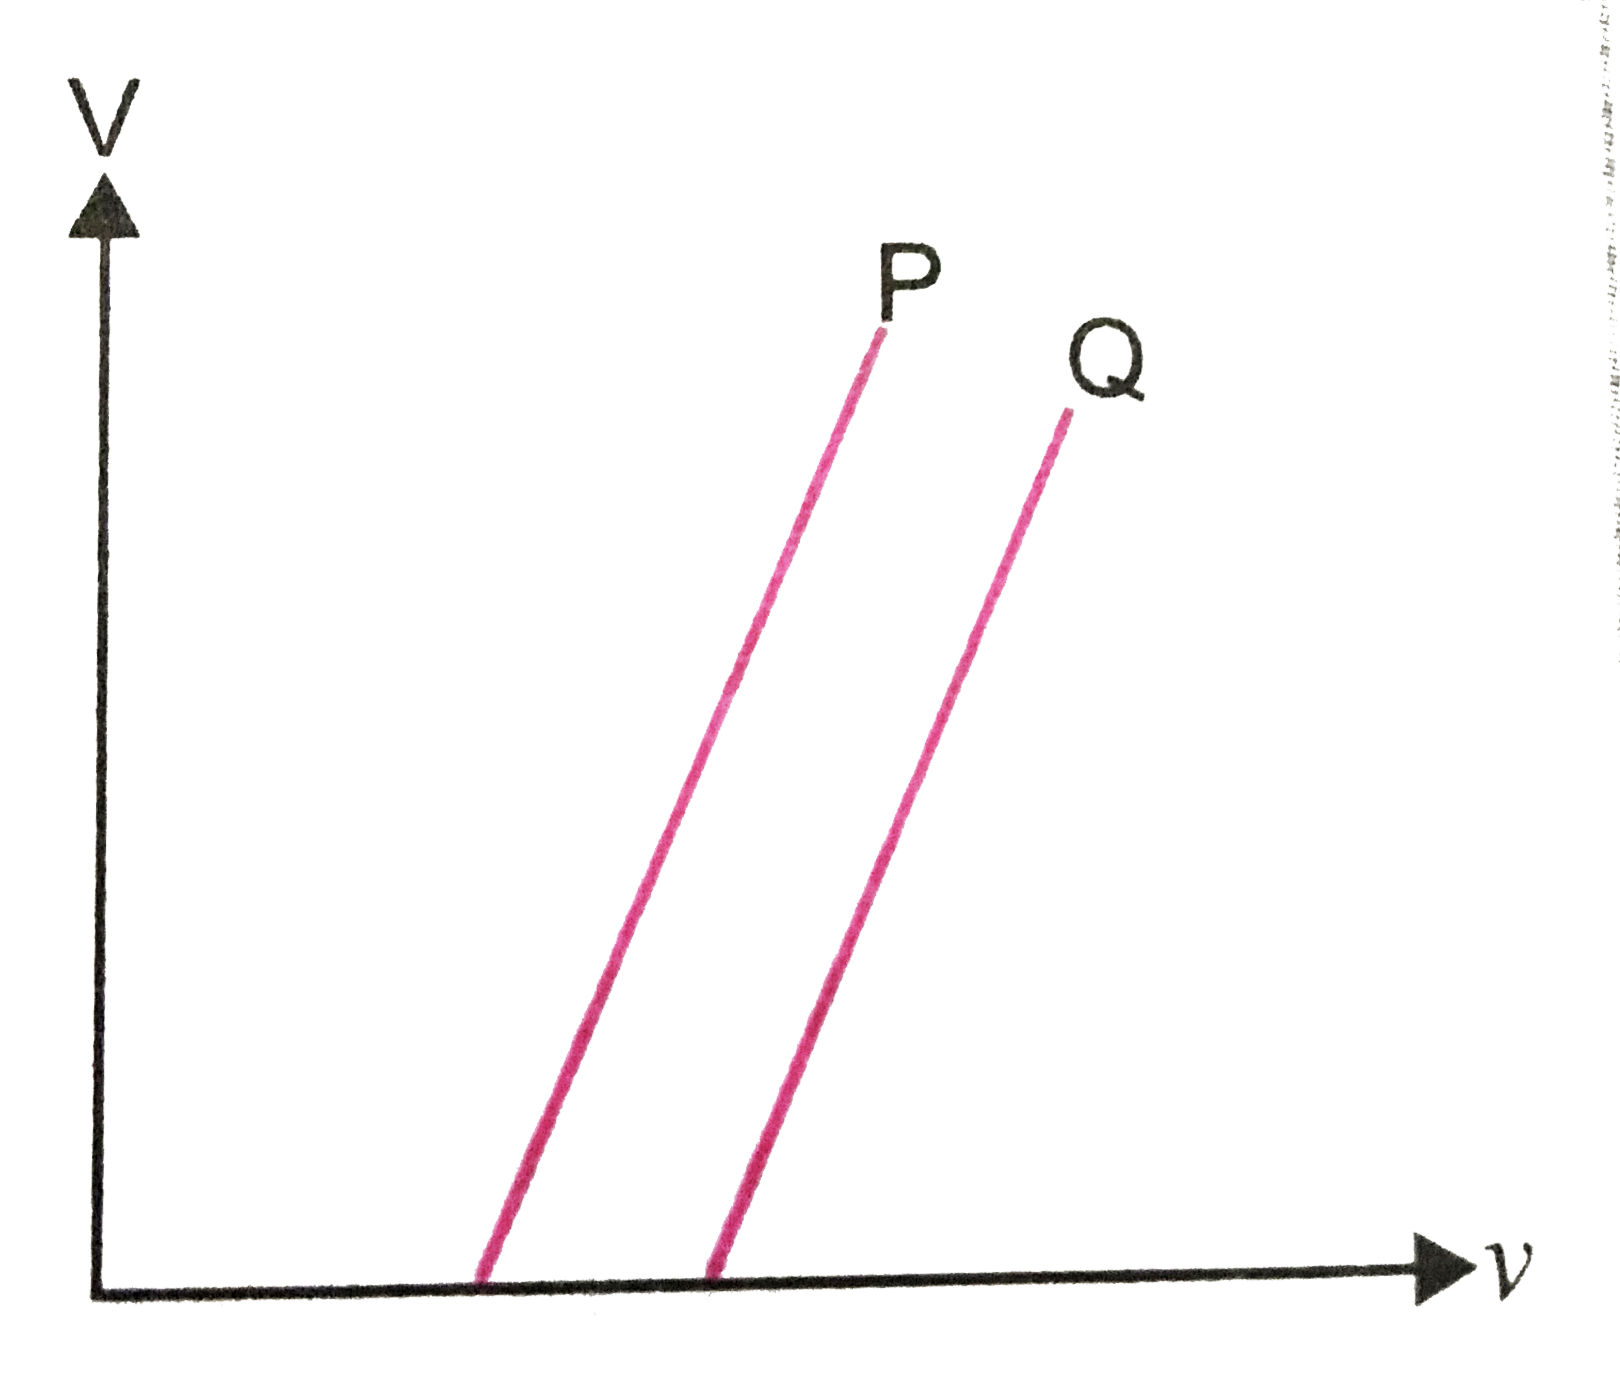
View SolutionIn a photoelectric effect experiment, the graph between the stopping potential (V) and frequency (v) of the incident radiations on two different metal plates P and Q are shown in plates, P and Q has greater value of work function ? (ii) What does the slope of the lines depict?
View Solution
Knowledge Check
Graph between stopping potential and frequency of light as shown find the work function
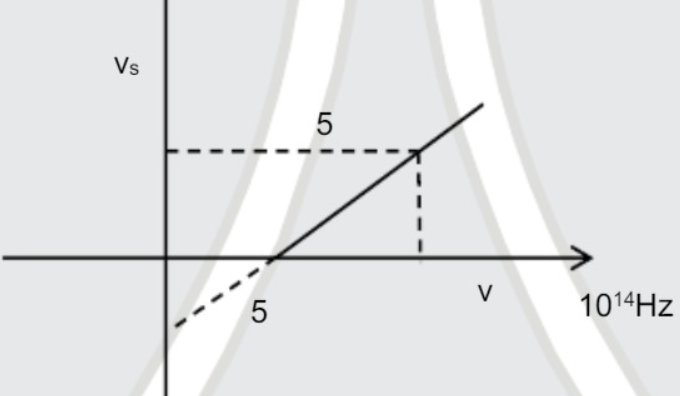 A4.01 evB2.07 evC5.01 evD2.09 ev
In photoelectric effect the slope of stop of stopping potential versus frequency of incident light for a given surface will be
A10−14B5×10−14C4×10−15D4×10−34In a photoelectric effect experiment, the slope of the graph between the stopping potential and the incident frequency will be :
A1B0.5C10−15D10−34
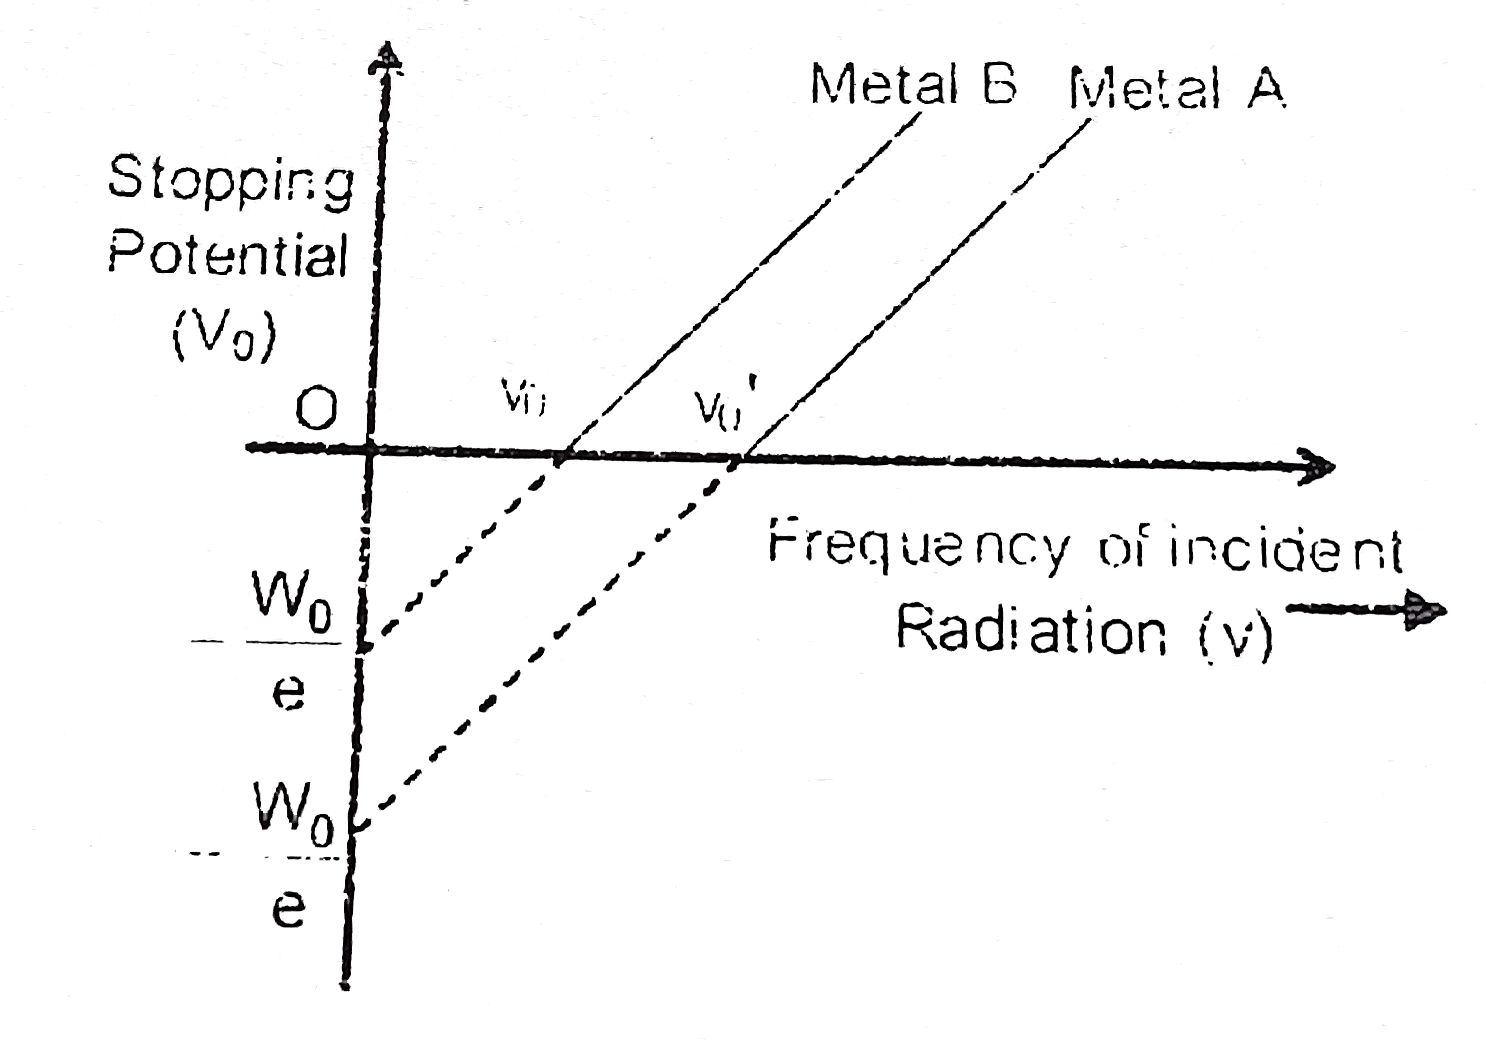
The graph shows variation of stopping potential V0 versus frequency of incident radiation v for two photosensitive metals A and B. Which of two metals has higher threshold frequency and why?
View SolutionDefine photoelectric effect. Draw a graph to show the variation of stopping potential with frequency of incident radiation on a metal plate.
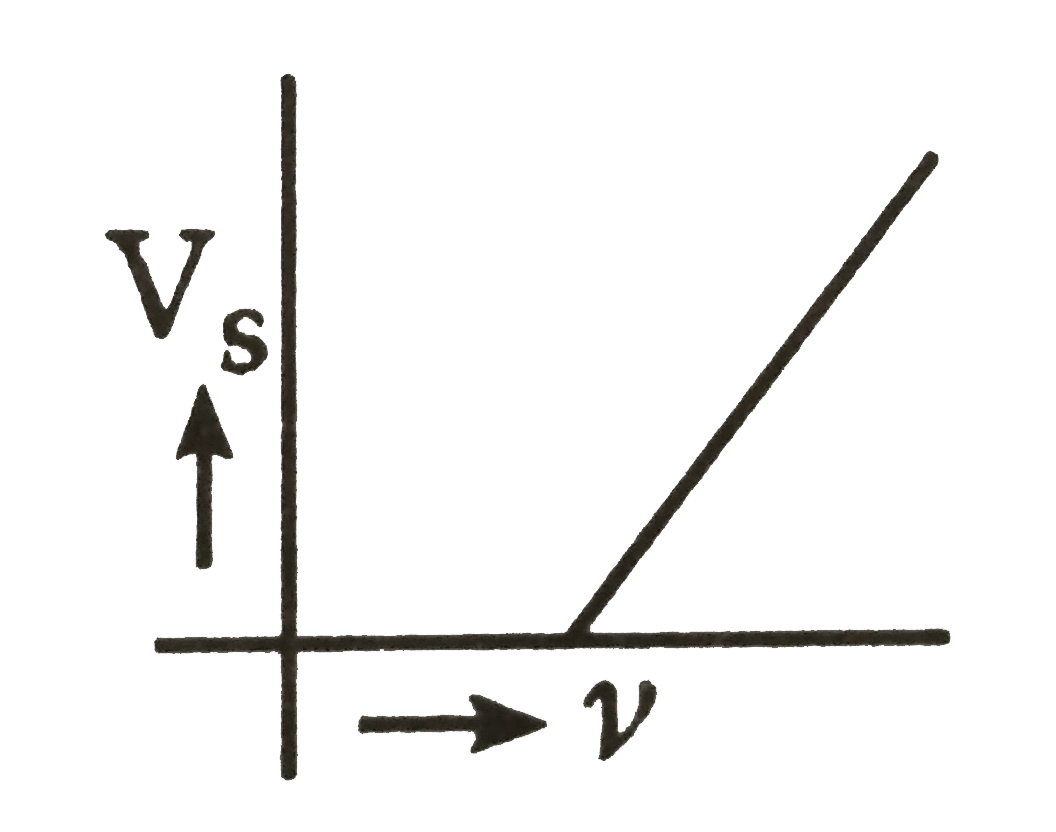
View SolutionIn photoelectric effect the slope of straight line graph between stopping potential (Vs) and frequency of incident light (v) gives
View SolutionIn a photoelectric effect experiment, the slope of the graph between the stopping potential and the incident frequency will be :
View SolutionGraph between stopping potential and frequency of photon is given in figure
_2019_CBT7_E01_021_Q01.png)
Find out work function of metal:
View Solution

