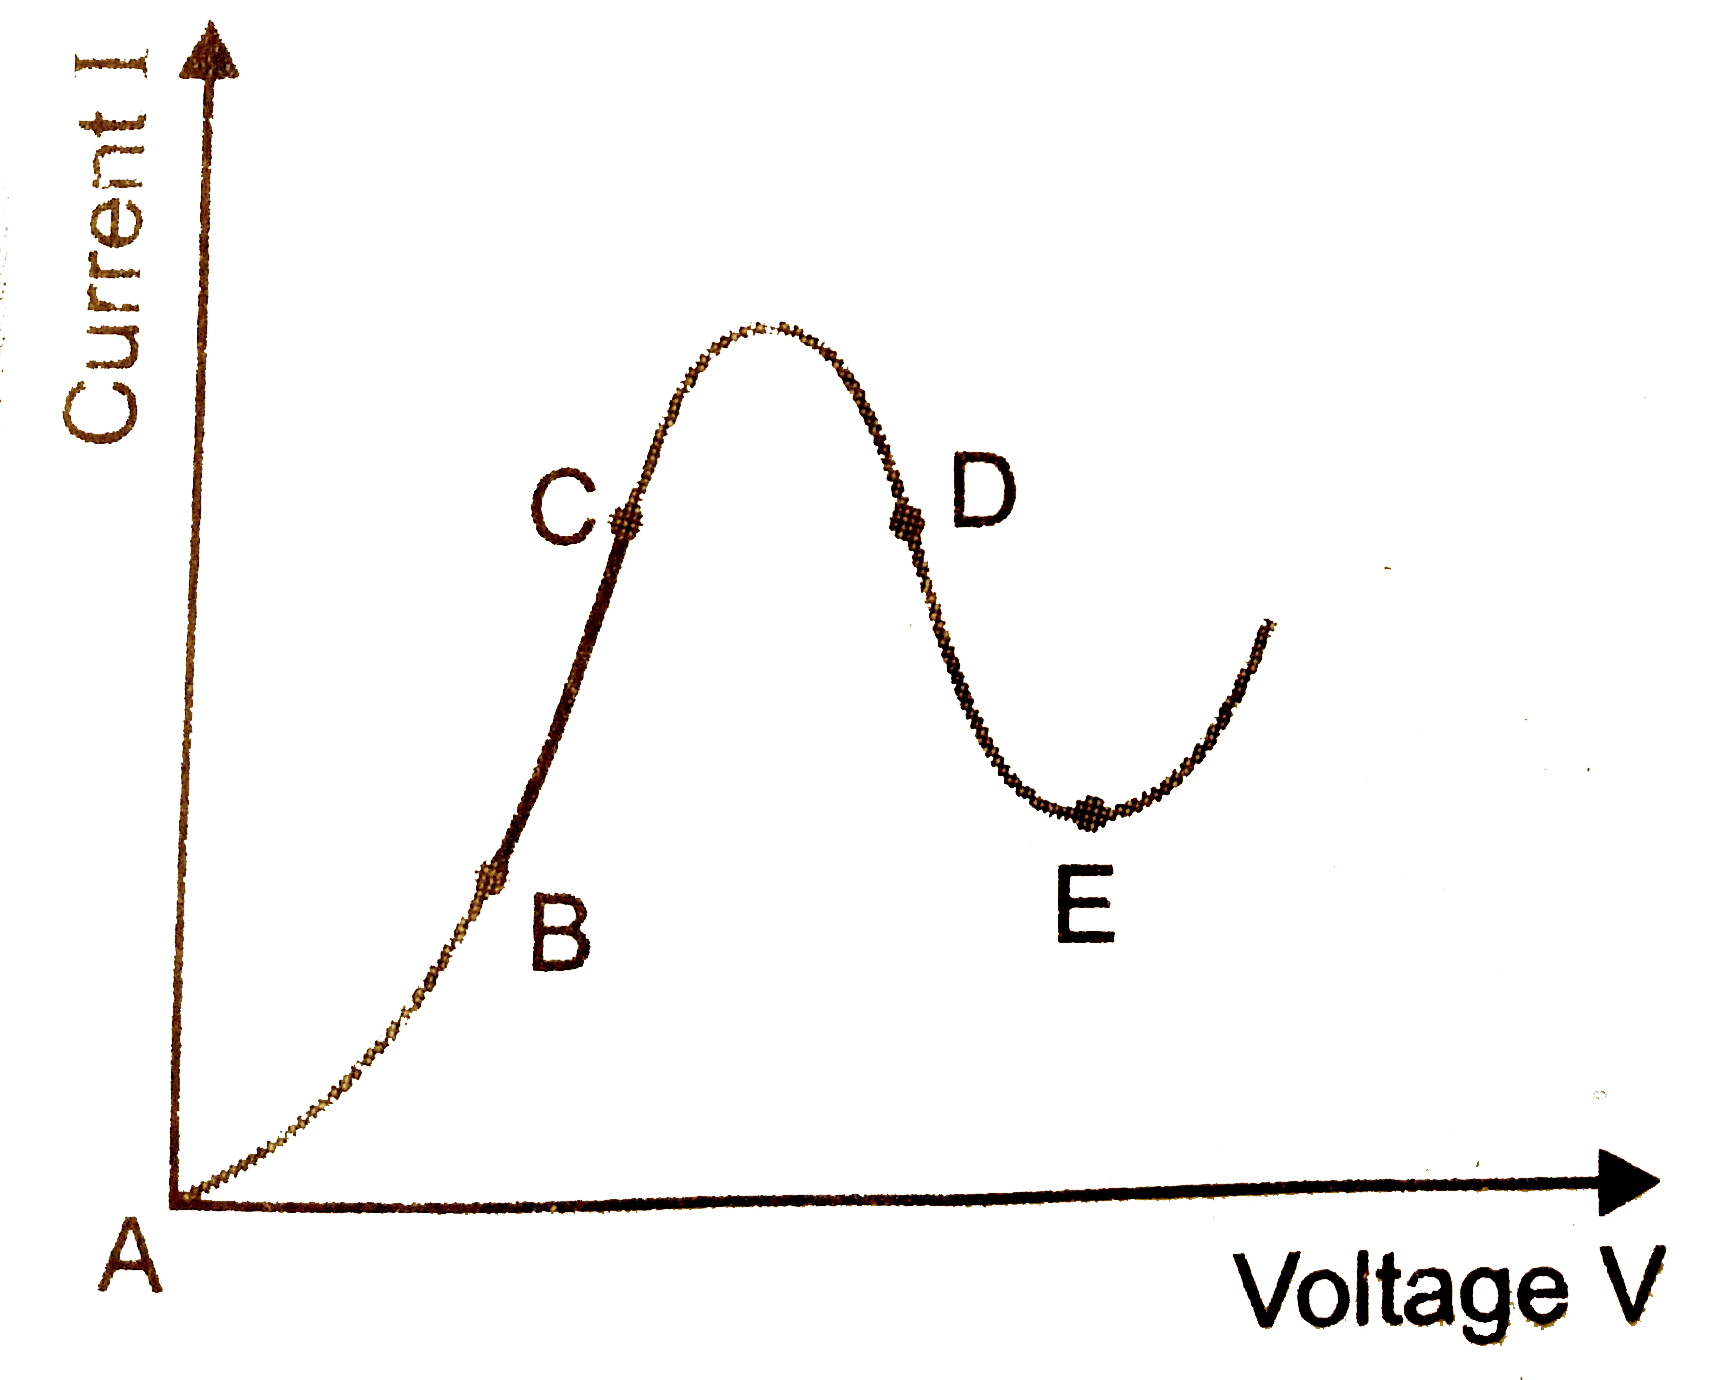
Plot a graph showing variation of current versus voltage for the material Ga.
Current - Voltage characteristics graph for GaAs:

Topper's Solved these Questions
- BOOK - XII BOARDS PREVIOUS YEARCHAPTER - XII BOARDSEXERCISE - section A5videos
XII BOARDS
- BOOK - XII BOARDS PREVIOUS YEARCHAPTER - XII BOARDSEXERCISE - section B5videos
XII BOARDS
- BOOK - XII BOARDS PREVIOUS YEARCHAPTER - XII BOARDSEXERCISE - [SET - II DELHI BOARD]6videos
XII BOARDS
- BOOK - XII BOARDS PREVIOUS YEARCHAPTER - SAMPLE PAPER 2019EXERCISE - SECTION D6videos
SAMPLE PAPER 2019
Similar Questions
Graph showing the variation of current versus voltage for a material GaAs is shown in figure. Identify the region of (i) negative resistance (ii) where Ohm's law is obeyed.
 View Solution
Graph showing the variation of current versus voltage for a material Ga As (a semiconductor) is shown in the Fig. Identify the region of (i) negative resistance, (ii) where Ohm's law is obeyed.
 View Solution
Graph showing the variation of current versus voltage for a material GaAs is shown in figure. Identify the region of (i) negative resistance (ii) where Ohm's law is obeyed.
 View Solution
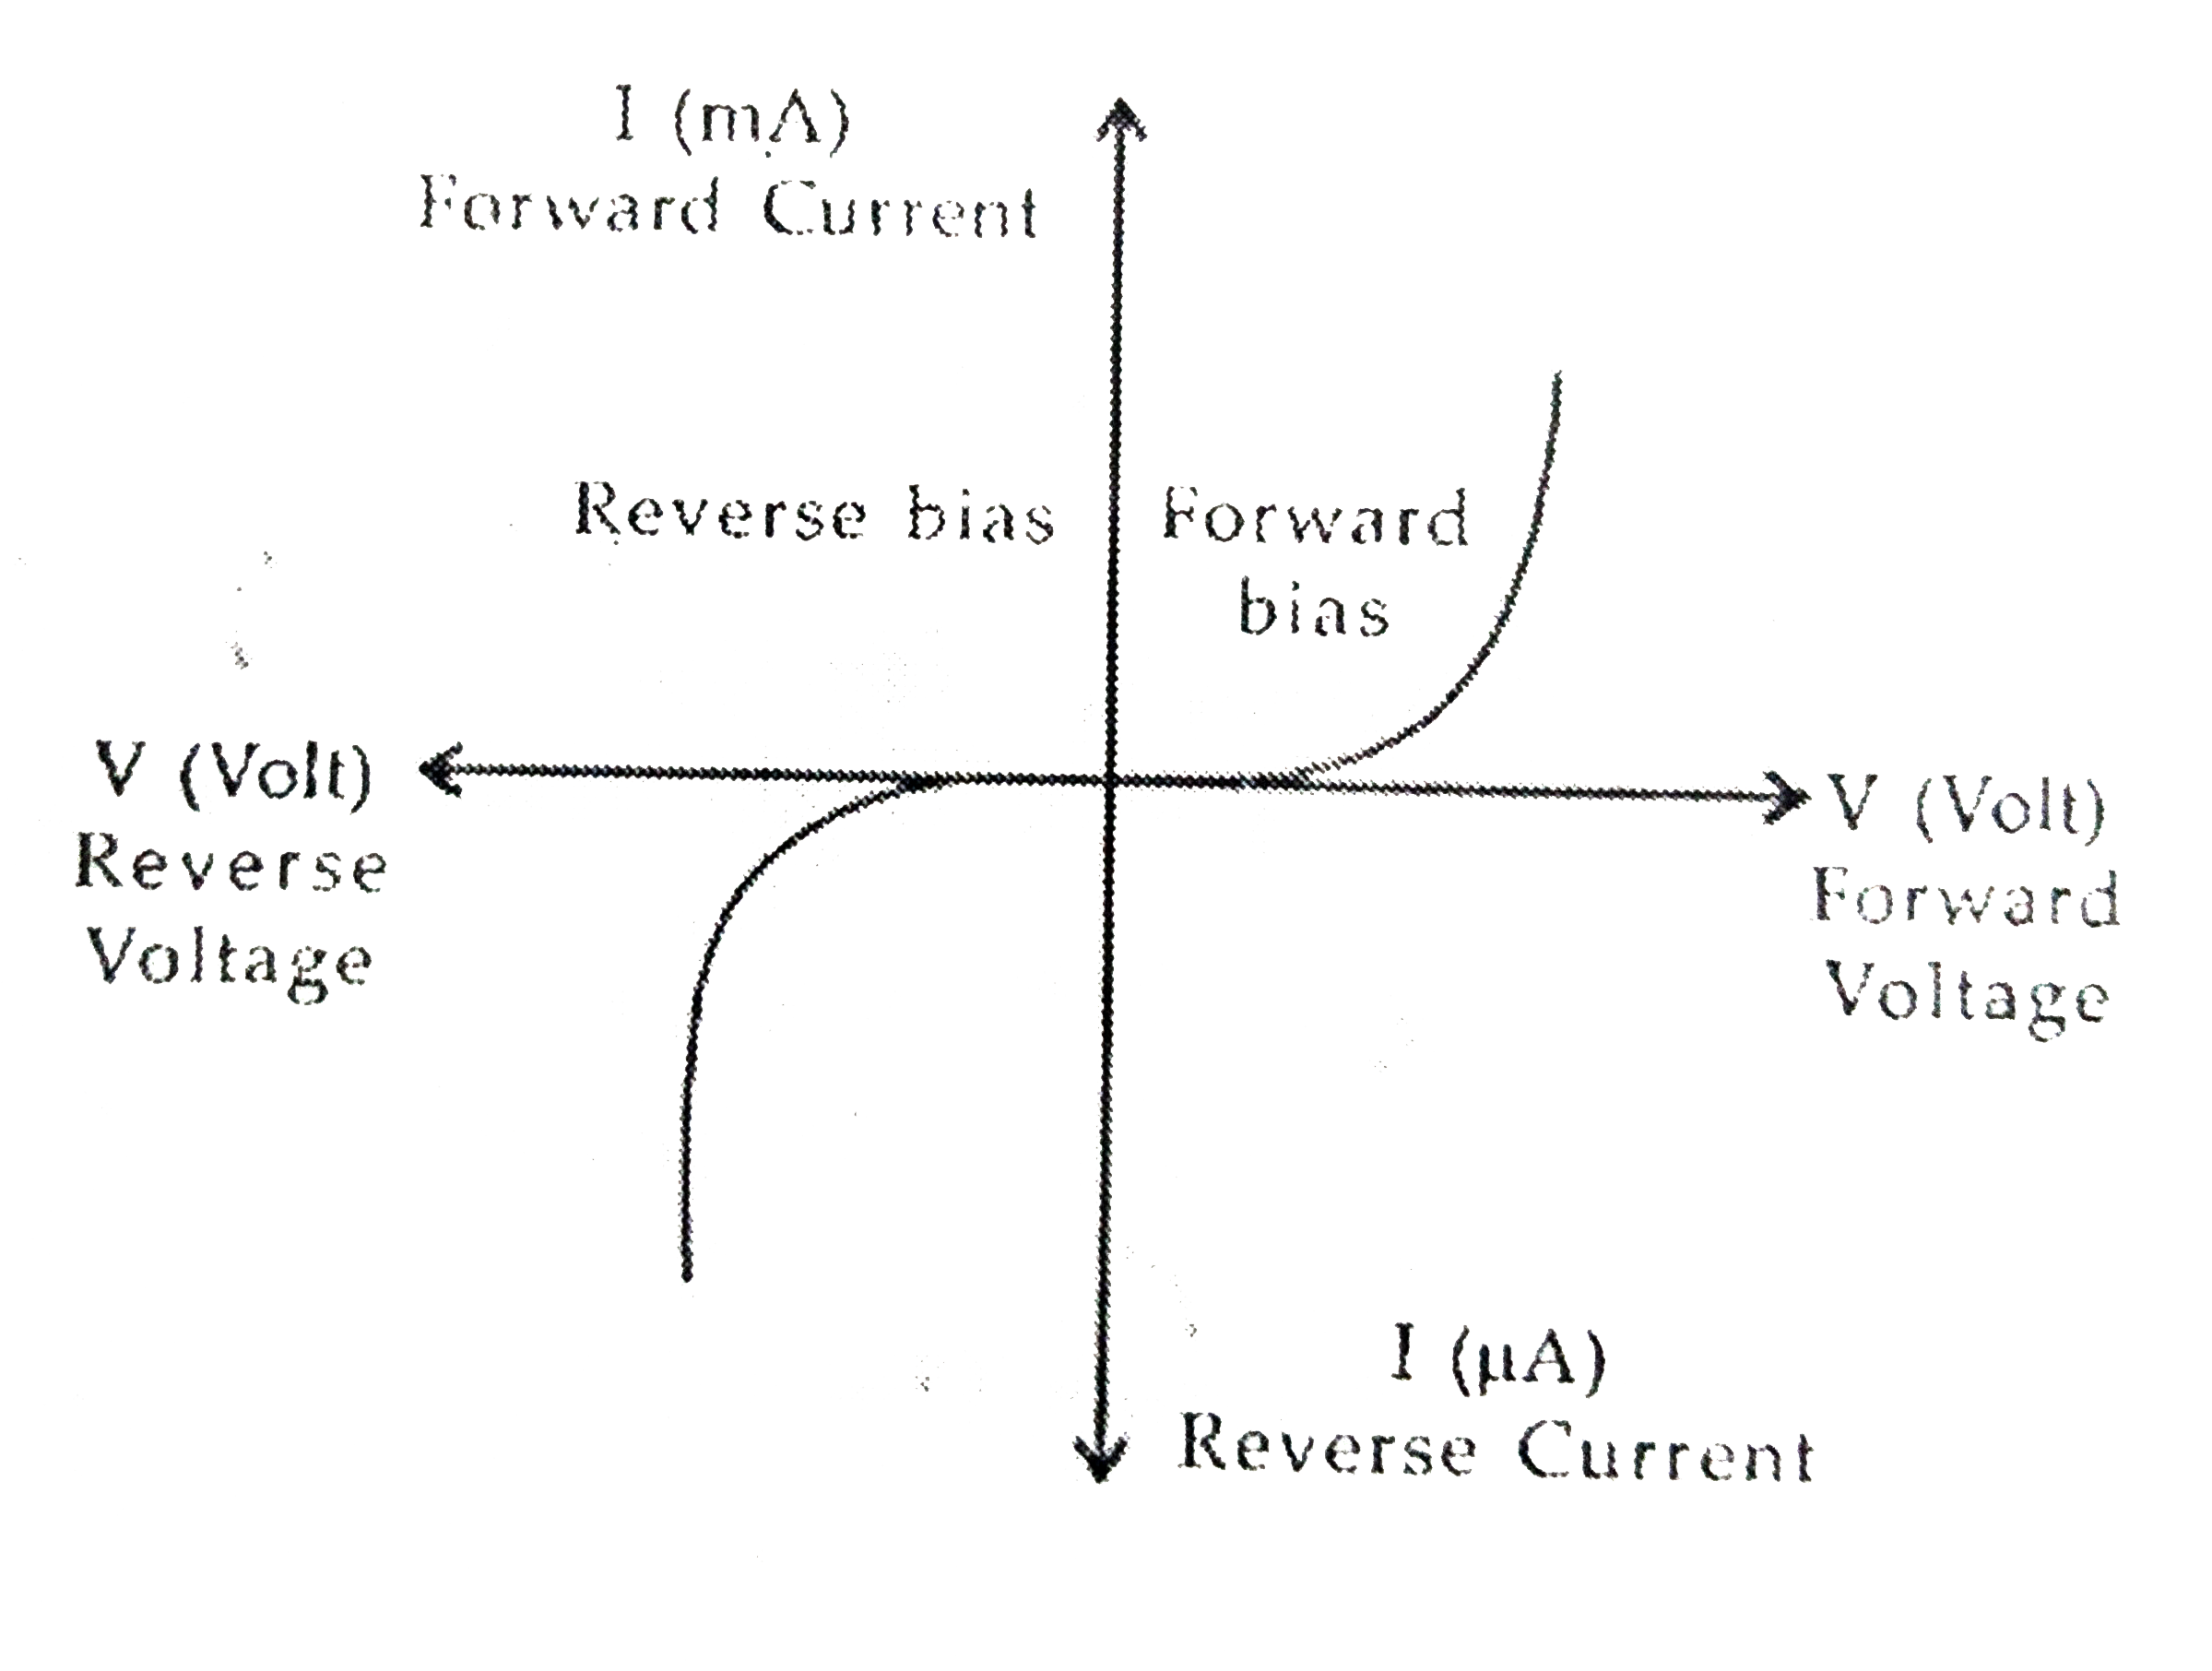
Is the graph showing variation of current versus voltage for a diode linear or non-linear?
View Solution(a) Draw graph showing the variation of current versus voltage in an electroyte when an external resistance is also connceted.
(b) (i) The graph between resistance (R ) and temperature (T) for Hg is shown in the figure (a). Explain the behaviour of Hg near 4k.
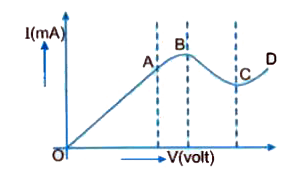
(ii) In which region of the graph shown in the figure (b) is the resistance negative and why?
 View Solution
Plot a graph showing the variation of current density (J) versus the electric field ( E ) For two conductors of different materials. What information from this plot regarding the properties of the conducting material, can be obtained which can be used to select suitable materials for use in making (i ) standard resistance and (ii) connecting wires in electric circuit?
View SolutionA cell of emf 'ε' and internal resistance 'r' is connected across a variable resistor 'R'. Plot a graph showing variation of terminal voltage 'V' of the cell versus the current 'l'. Using the plot, show how the emf of the cell and its internal resistance can be determined.
View SolutionA cell of emf ε and internal resistance r is connected across a variable resistor R. Plot a graph showing variation of terminal voltage V of the cell versus the current I. Using the plot, show how the emf of the cell and its internal resistance can be determined.
View SolutionDerive an expression for the impedance of a series LCR circuit connected to an a.c. supply of variable frequency. Plot a graph showing variation of current with the frequency of the applied voltage. Explain briefly how the phenomenon of resonance in the circuit can be used in the tuning mechanism of a radio or TV set.
View Solution.A cell of emf E and internal resistance r is connected across a variable resistor. Plot a graph showing variation of terminal voltage V of cell versus the current.
View Solution

