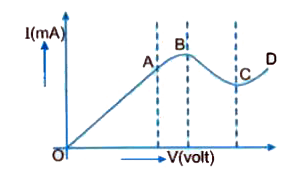
The graph shown in the figure represents a plot of current versus voltage for a given semi-conductor. Identify the region, if any, over which the semicondutor has a negative resistance.
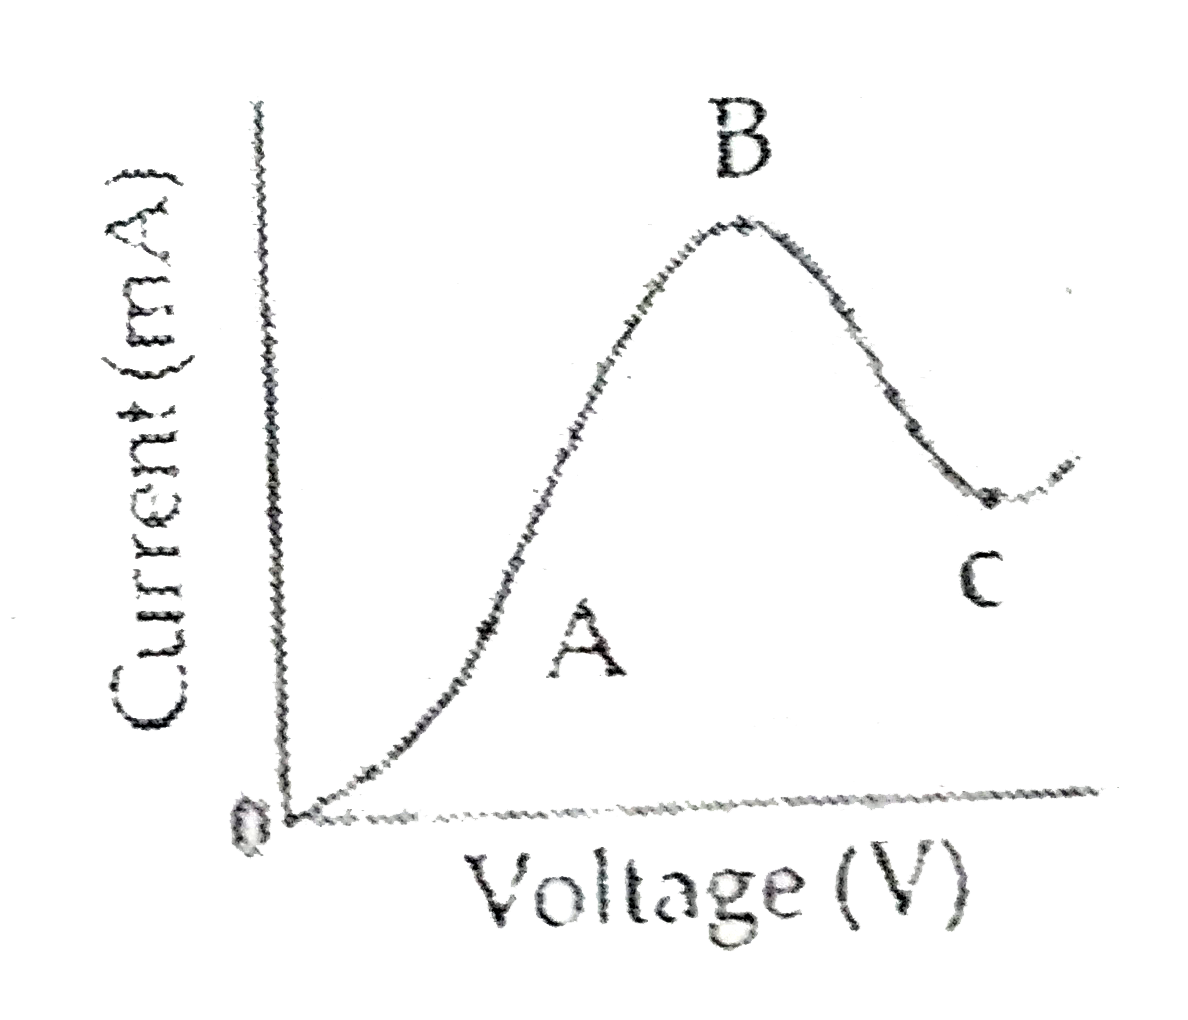
Region identified = B and C, the semi-conductor has a negative resistance.
Related Playlists
- BOOK - XII BOARDS PREVIOUS YEARCHAPTER - XII BOARDSEXERCISE - SET-II35videos
XII BOARDS
- BOOK - XII BOARDS PREVIOUS YEARCHAPTER - XII BOARDSEXERCISE - SET-III25videos
XII BOARDS
- BOOK - XII BOARDS PREVIOUS YEARCHAPTER - XII BOARDSEXERCISE - SET III9videos
XII BOARDS
- BOOK - XII BOARDS PREVIOUS YEARCHAPTER - SAMPLE PAPER 2019EXERCISE - SECTION D6videos
SAMPLE PAPER 2019
Similar Practice Problems
- Question 1 - Select One
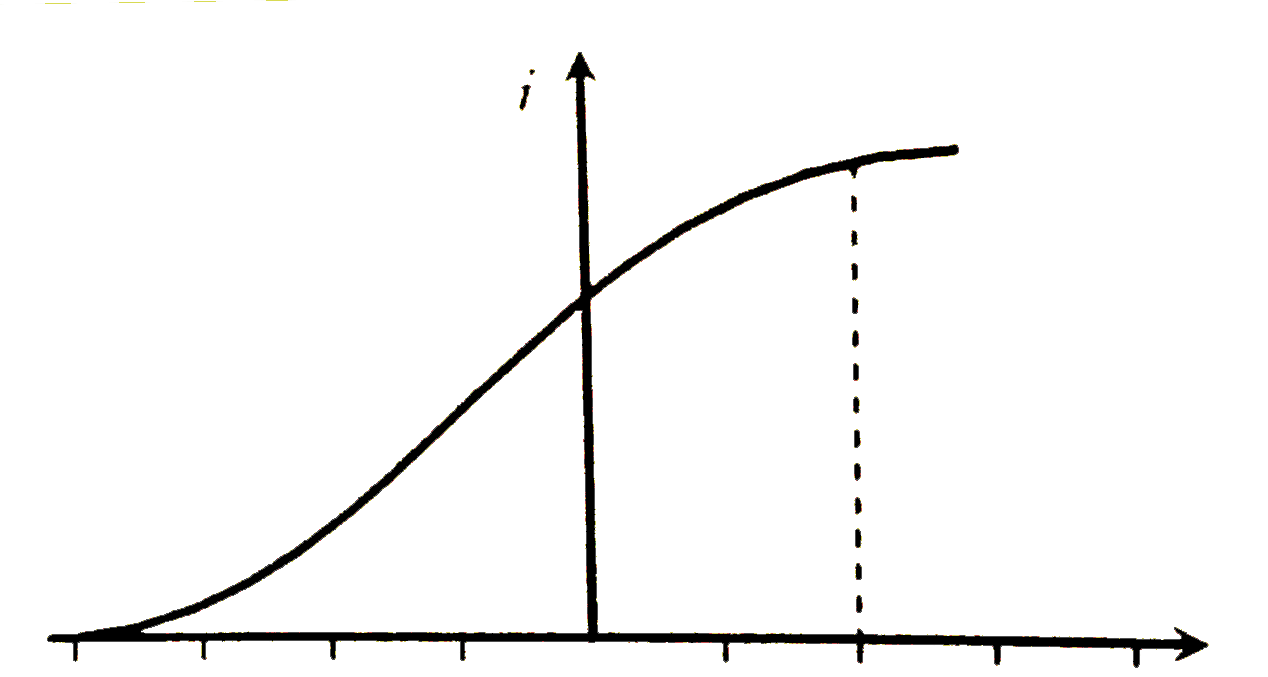
Figure represents the graph of photo current l versus applied voltage (V). The minimum energy of emitted photoelectrons is
 A2 eVB4 eVC0 eVD4 J
 - Question 1 - Select One
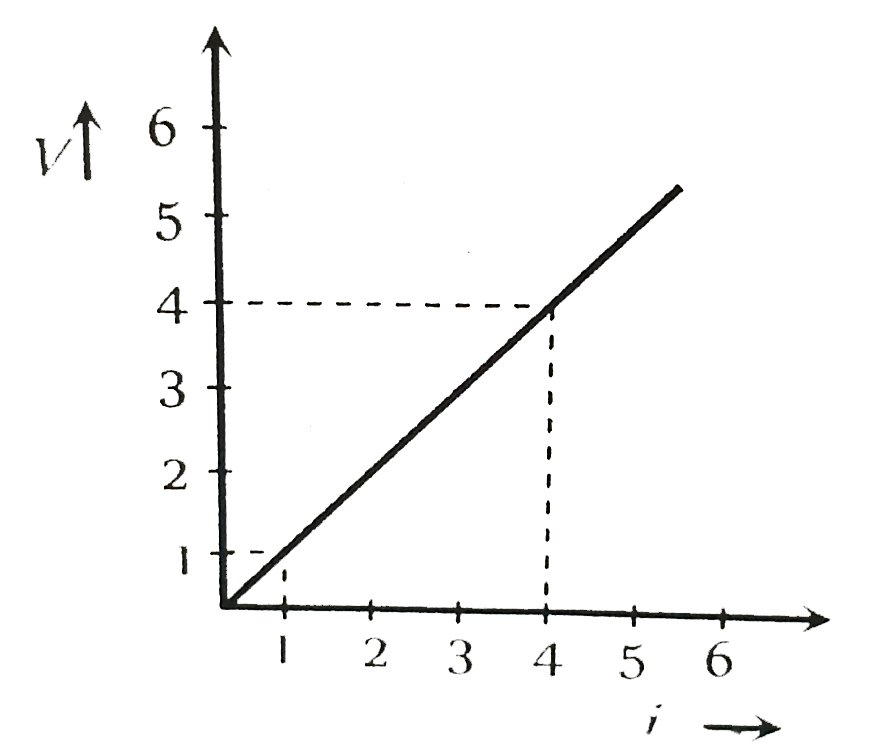
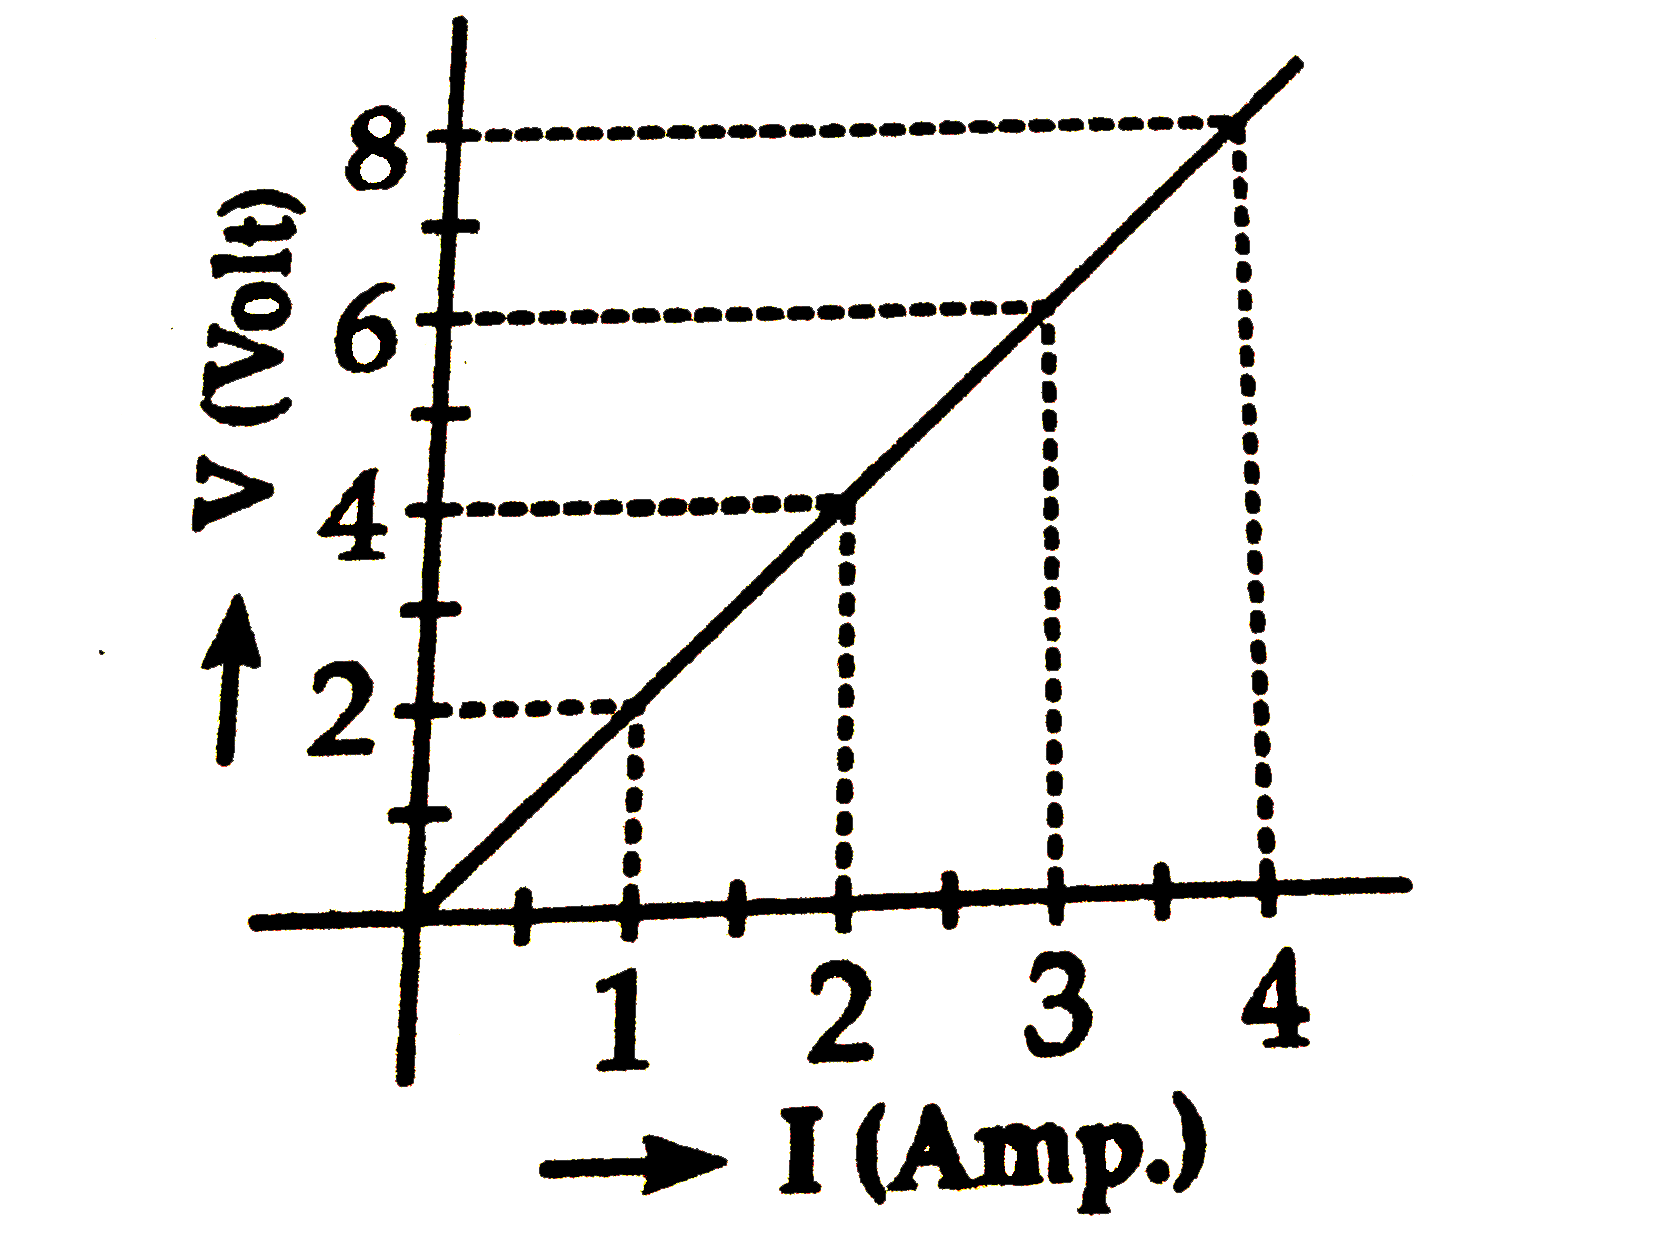
Variation of current and voltage in a conductor has been shown in the diagram below. The resistance of the conductor is.
 A4 ohmB2 ohmC3 ohmD1 ohm
 - Question 1 - Select One
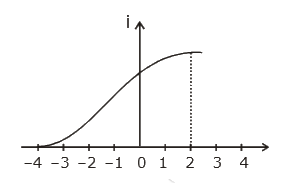
Figure represents the graph of photo current I versus applied voltage (V). The maximum kinetic energy of the emitted photoelectrons is
 A2 eVB4 eVC0 eVD4 J
Similar Questions
Graph showing the variation of current versus voltage for a material Ga As (a semiconductor) is shown in the Fig. Identify the region of (i) negative resistance, (ii) where Ohm's law is obeyed.
 View Solution
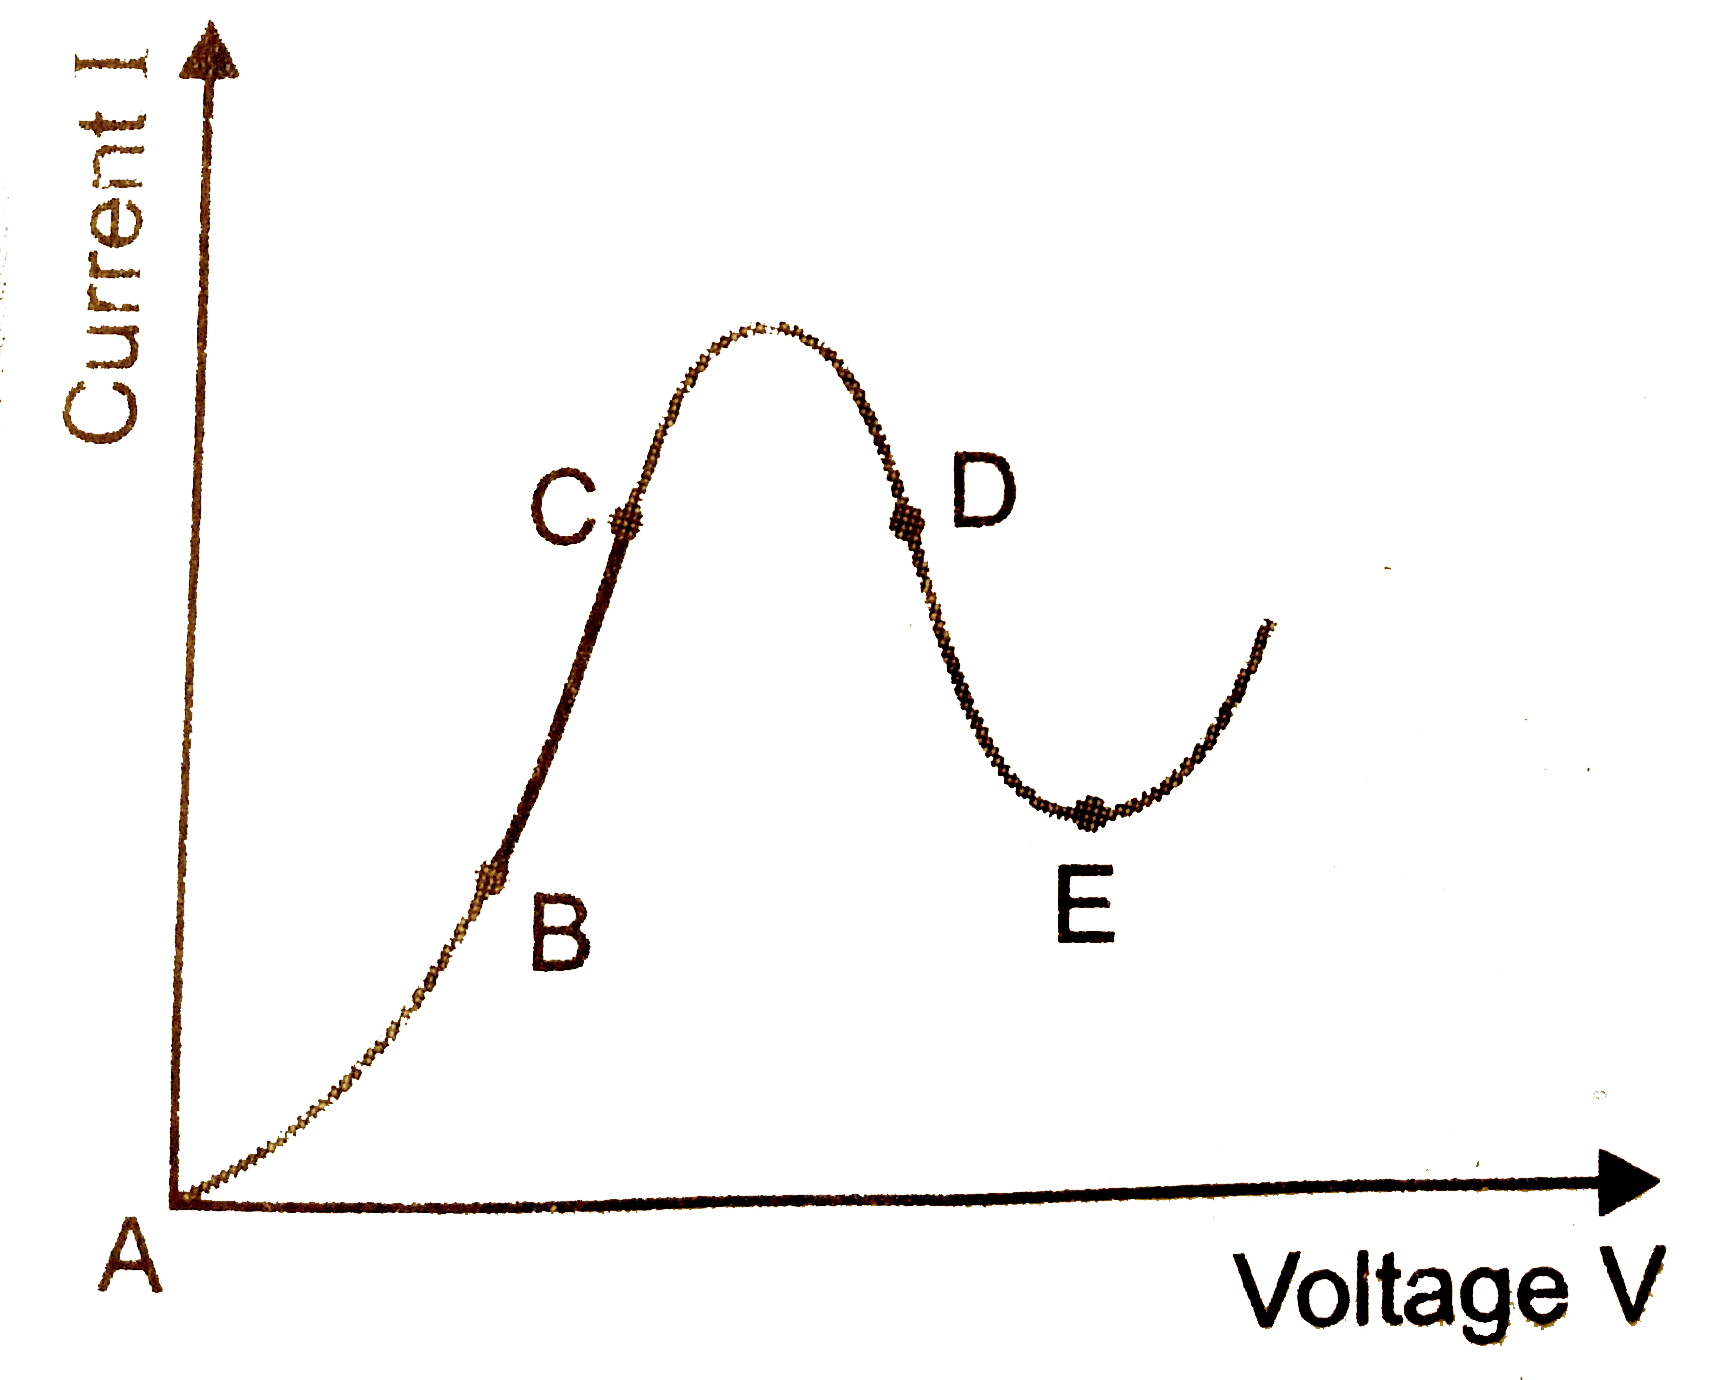
Graph showing the variation of current versus voltage for a material GaAs is shown in figure. Identify the region of (i) negative resistance (ii) where Ohm's law is obeyed.
 View Solution
Graph showing the variation of current versus voltage for a material GaAs is shown in figure. Identify the region of (i) negative resistance (ii) where Ohm's law is obeyed.
 View Solution
In an electric circuit shown alongside, find
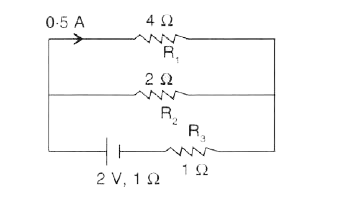
terminal voltage of the batteryView SolutionVariation of current and voltage in a conductor is shown in the adjoining figure. The resistance of the conductor is
 View Solution
The graph of current versus voltage drop across the three resistors P,Q,R is shown above. Find the ratio of their resistances.
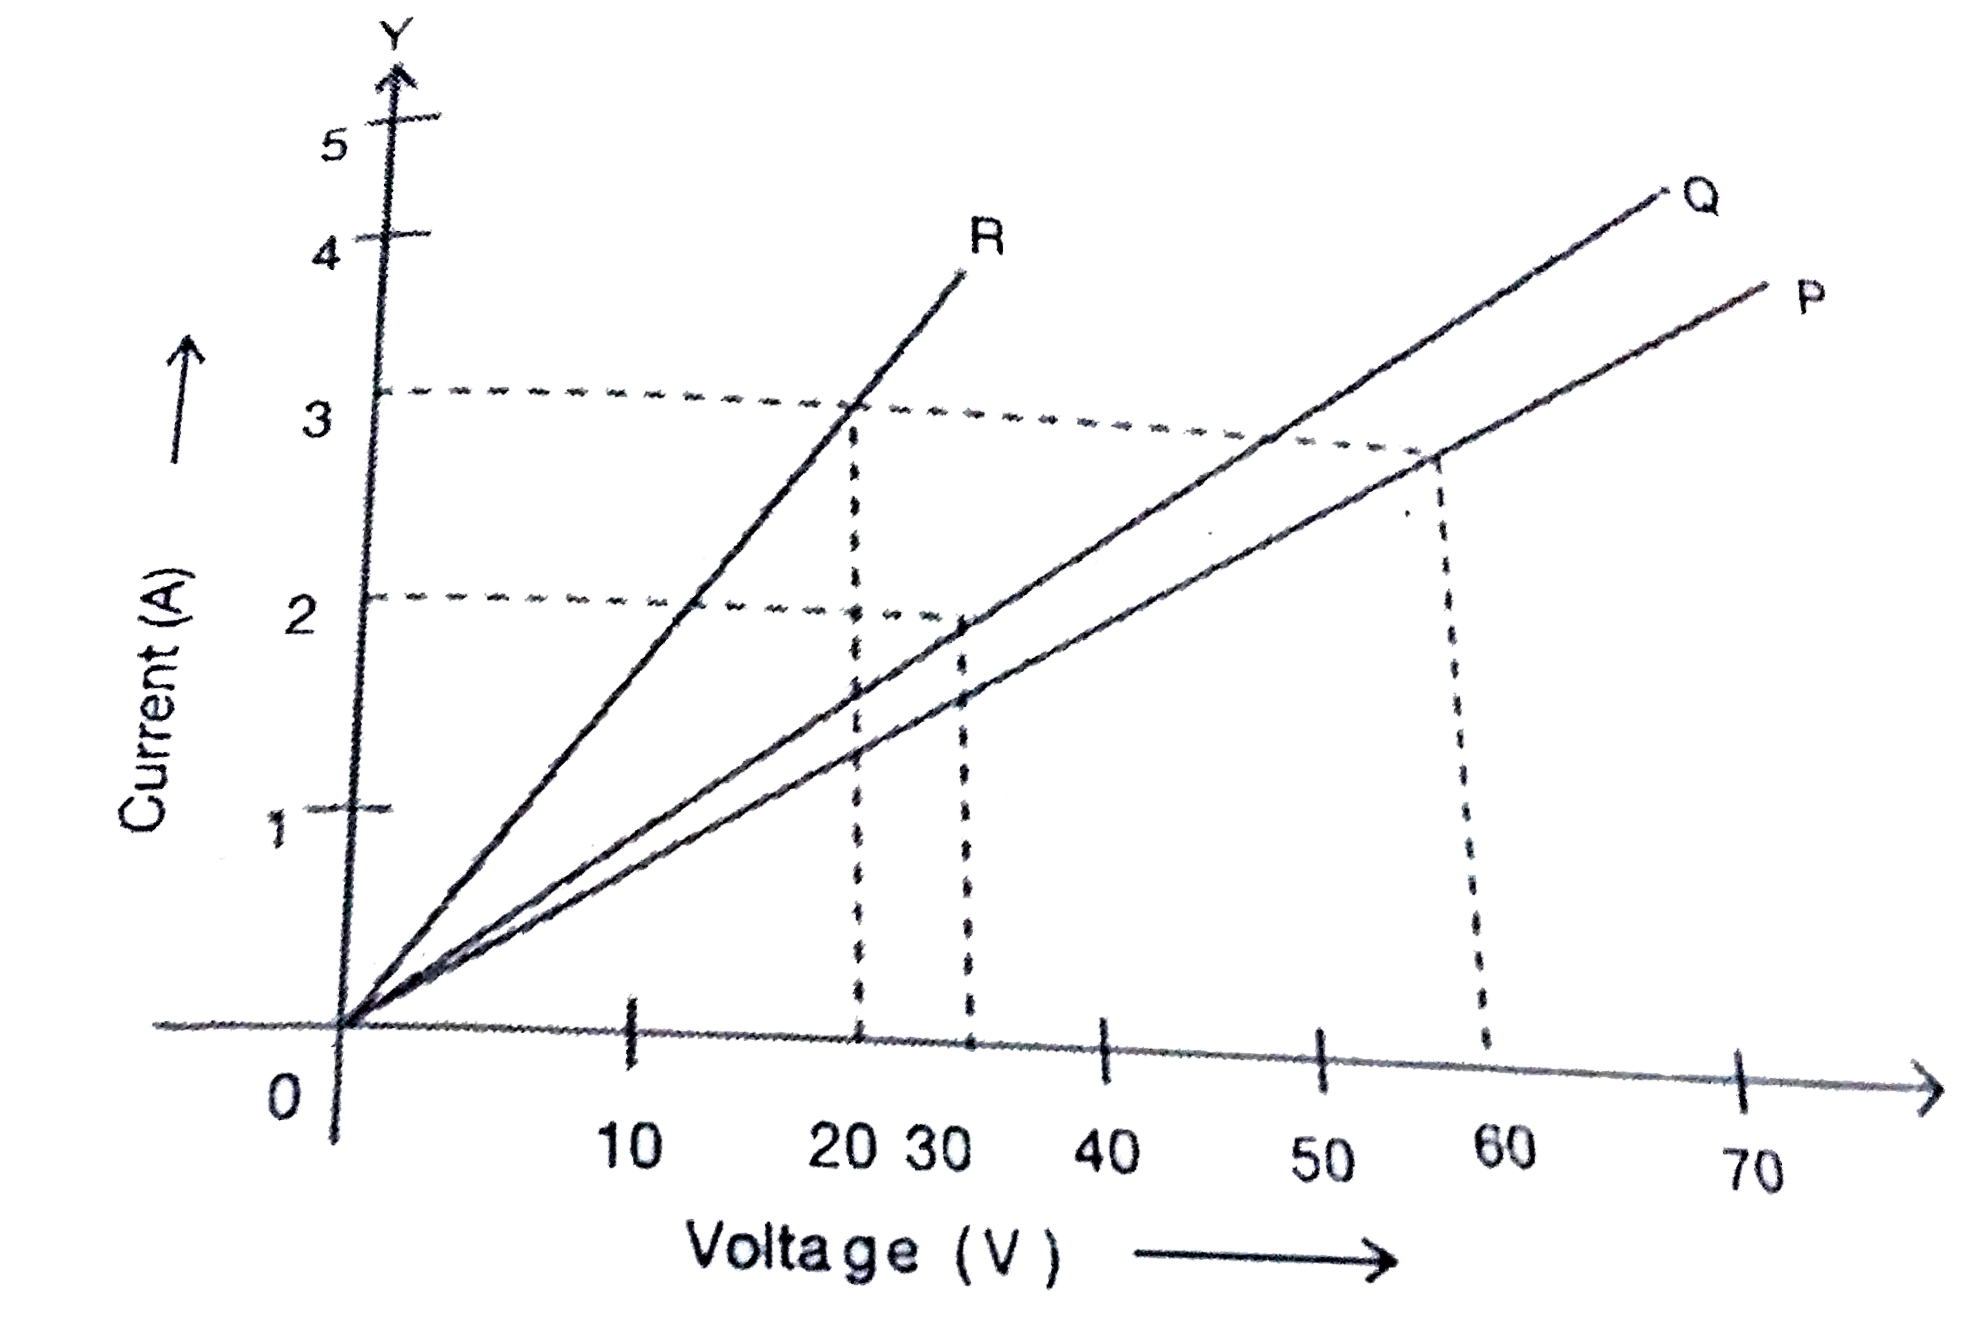 View Solution
The following figure represents the temperature versus time plot for a given amount of a substance when heat energy is supplied to it at a fixed rate and at a constant pressure. Which part of plot represent a phase change?
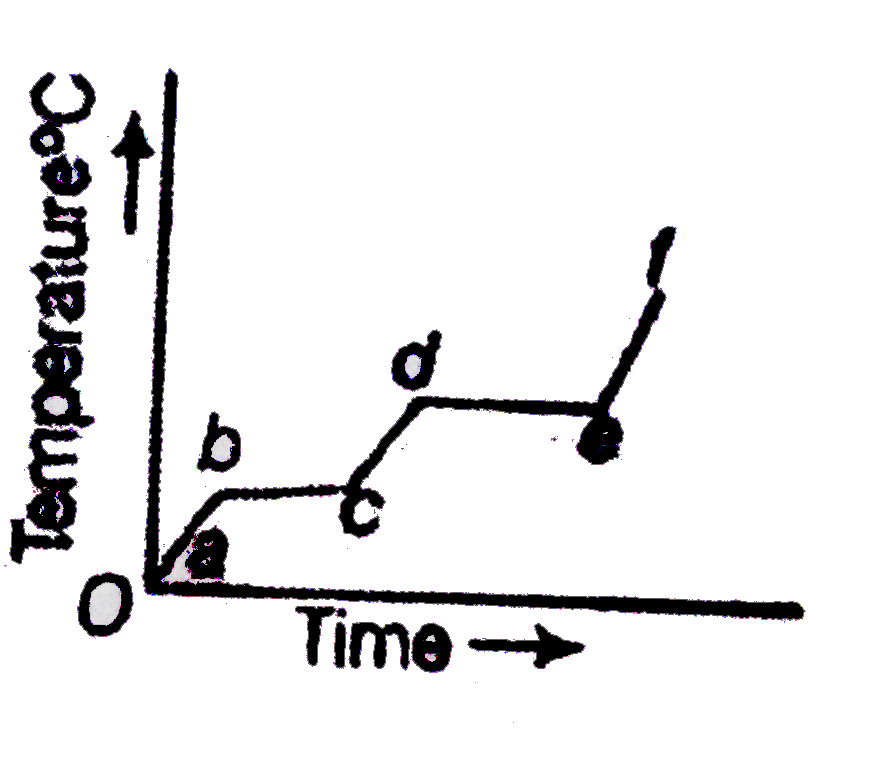 View Solution

