Draw a plot showing the variation of binding energy per nucleon versus the mass number A. Explain with the help of this plot the release of energy in the processes of nuclear fission and fusion.
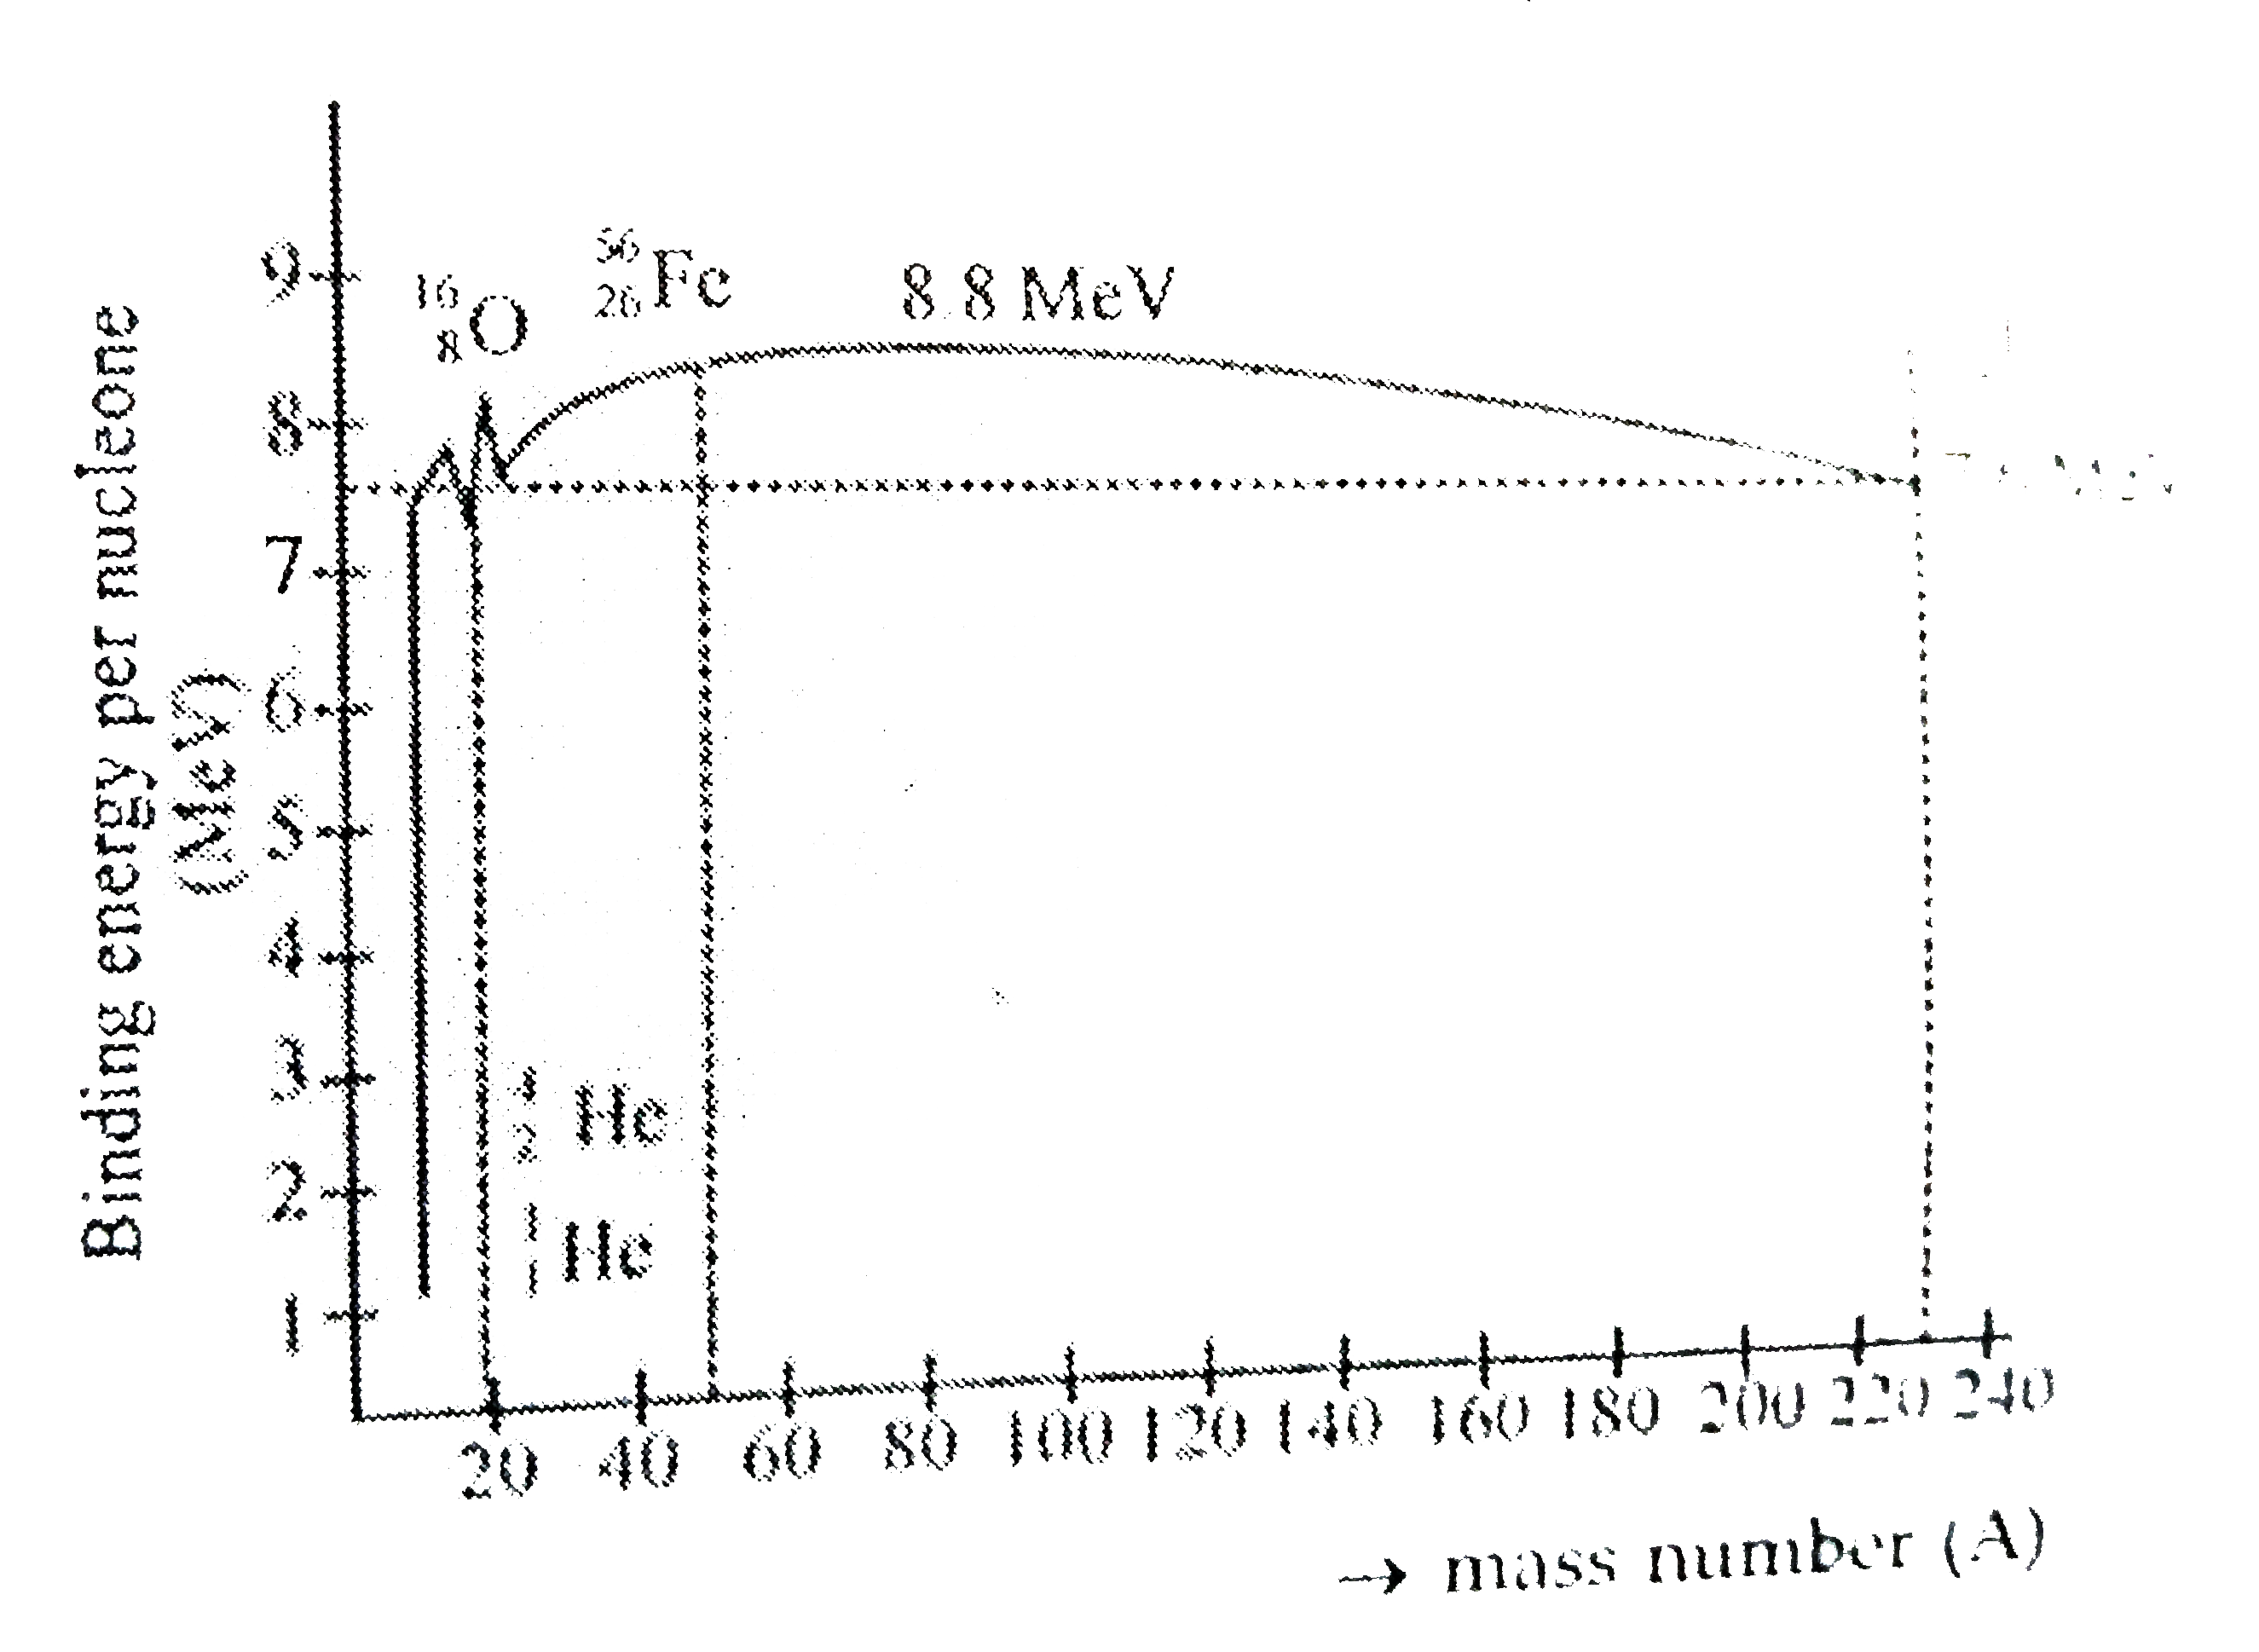
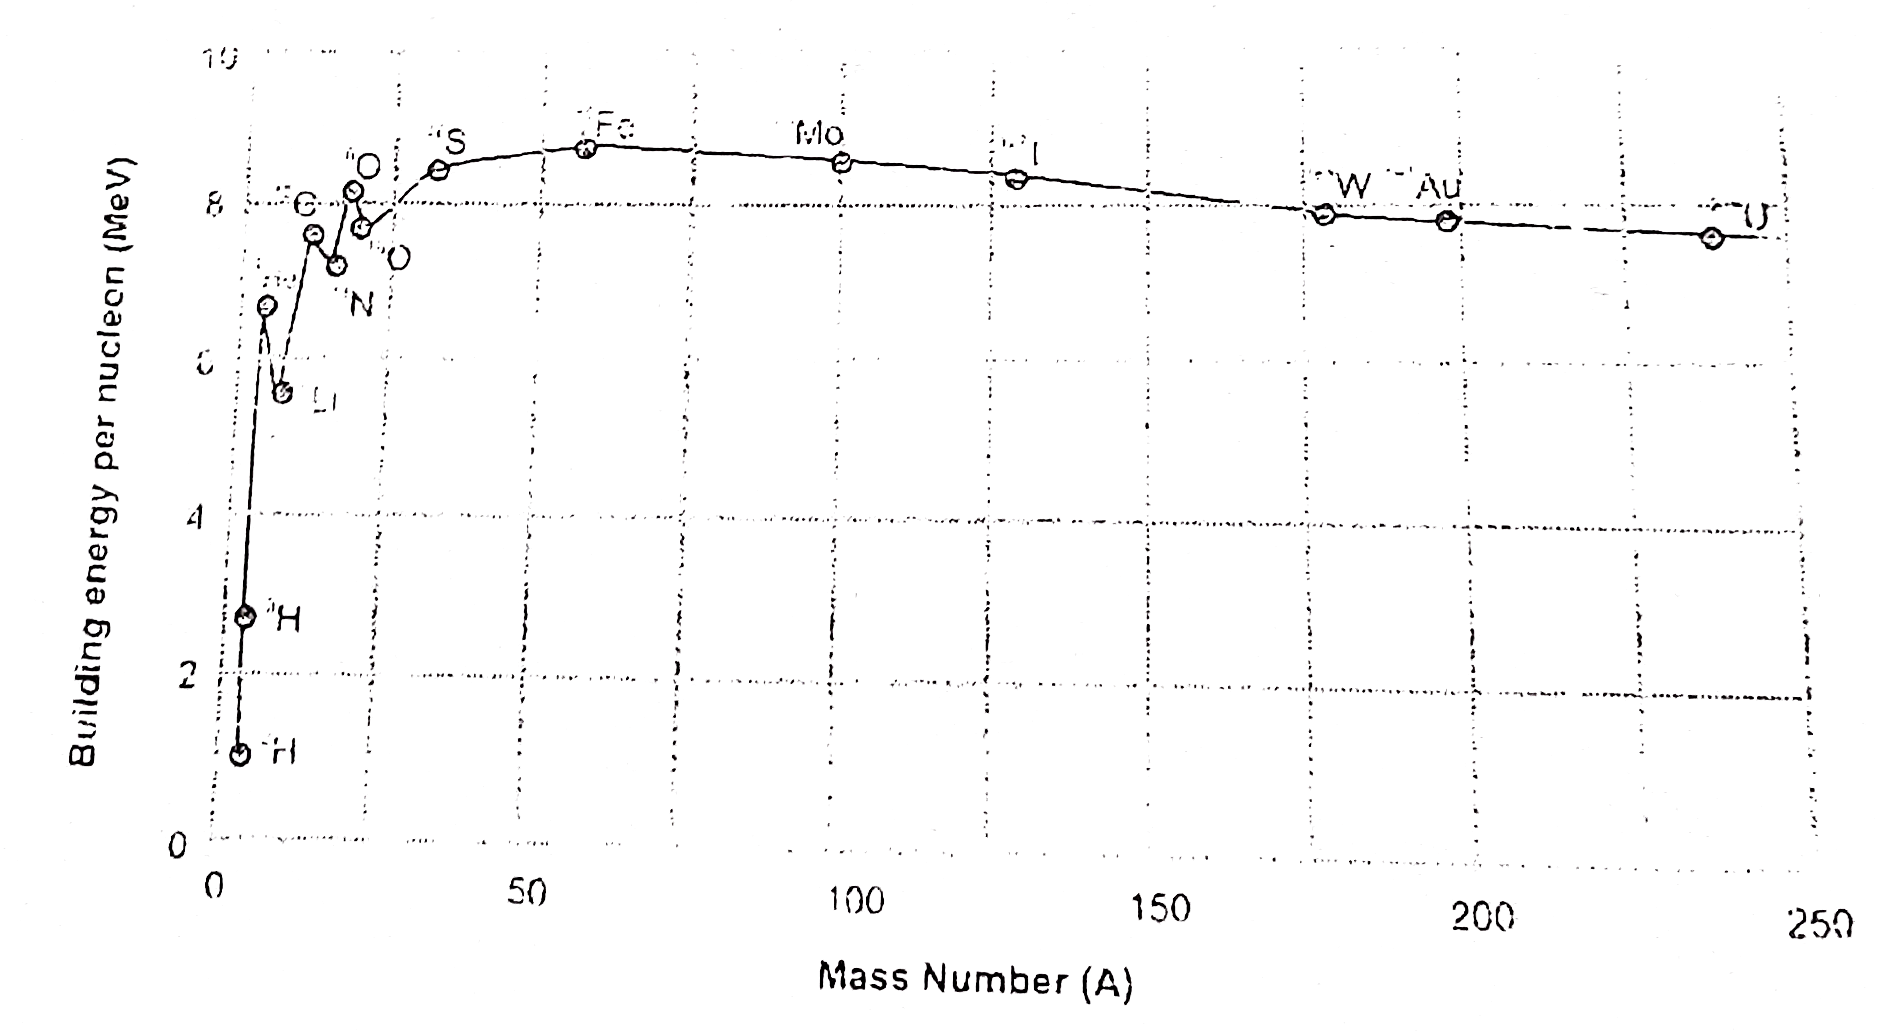
Binding Energy Curve : The variation of average B. E. per nucleon with mass number A is shown in fig.
Inferences :
(i) Average B.E. per nucleon for light nuclei like .11H and .21H small.
(ii) For mass number 2 to 20, the peaks are sharply defined. So that, .42He,.126C,.168O,.2010Ne etc, are more stable than the nuclei in their neighbourhood..
(iii) The nuclei having intermediate mass number 56 have maximum binding energy as 8.8 Me V/N e.g. .5626Fe. Such nuclei are most stable.
(iv) The BE/nucleons decreases gradually after mass number .5626Fe to .23892U. the heavy nuclei are relatively less stable.
(v) Binding energy per nucleons is small for both light and heavy nuclei.
When light nuclei fuse to form a heavy nucleus, high value of binding energy energy is released in nuclear fusion.
When a heavy nucleus splits into a light nuclei, high value of binding energy is released in nuclear fission.

Topper's Solved these Questions
- XII BOARDSBook:XII BOARDS PREVIOUS YEARChapter:XII BOARDSExercise:SET-II
Explore 35 Videos
- XII BOARDSBook:XII BOARDS PREVIOUS YEARChapter:XII BOARDSExercise:SET-III
Explore 25 Videos
- XII BOARDSBook:XII BOARDS PREVIOUS YEARChapter:XII BOARDSExercise:SET III
Explore 9 Videos
- SAMPLE PAPER 2019Book:XII BOARDS PREVIOUS YEARChapter:SAMPLE PAPER 2019Exercise:SECTION D
Explore 6 Videos
Similar Questions
VARIATION OF BINDING ENERGY OF PER NUCLEON WITH MASS NUMBER
View SolutionDraw the graph showing thervariation of binding energy per nucleon with mass number. Give therason for the decrease of binding energy per nucleon for nuclei with high mass numbers.

The binding energy per nucleon for nuclei with high mass number is low due to the large coulomb repulsion between the protons inside these nuclei.
View Solution
Knowledge Check
Binding energy per nucleon relation with mass number
Afirst decreases then increasesBfirst increases then decreasesCincreasesDdecreases
Variation Of Binding Energy Of Per Nucleon With Mass Number
View Solution(a) Write the relation for binding energy (in MeV) of a nucleus AZX of atomic number ‘Z’ and mass number ‘A’ in terms of the masses of its constituents — neutrons and protons.
(b) Draw a plot of binding energy per nucleon versus mass number ‘A’ for 2≤A≤240. Use this graph to explain the release of energy in the process of nuclear fusion of two light nuclei.
View SolutionUsing the curve for the binding energy per nucleon as a function of mass number A, state clearly how the release in energy in the processes of nuclear fission and nuclear fusion can be explained.
View SolutionUsing the curve for the binding energy per nucleon as a function of mass number A, state clearly how the release in energy in the processes of nuclear fission and nuclear fusion can be explained.
View SolutionDraw a graph showing the variation of binding energy per nucleon with mass number of different nuclei. State two inferences from this graph.
View SolutionDraw a graph showing variation of binding energy per nucleon with mass number. Write two main inferences drawn from the graph.
View SolutionDraw the graph showing the variation of binding energy per nucleon with mass number. Give the reason for the decrease of binding energy per nucleon for nuclei with high mass numbers.
View Solution

