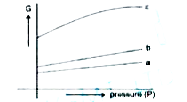
The following curve represents the variation of Gibbs function 'G' with pressure at constant temperature. Correct match of given plots with the physical state of a substance is
 Solution in Telugu
c − solid, a- gas, b- liquid
c- gas, b- liquid, a- solid
a- liquid, b- solid, c- gas
c- gas, b- solid, a - liquid
The correct Answer is:B
Step by step video, text & image solution for The following curve represents the variation of Gibbs function 'G' with pressure at constant temperature. Correct match of given plots with the physical state of a substance is by Chemistry experts to help you in doubts & scoring excellent marks in Class 12 exams.
Updated on:21/07/2023Topper's Solved these Questions
- CHEMICAL THERMODYNAMICSBOOK - AAKASH SERIESCHAPTER - CHEMICAL THERMODYNAMICSEXERCISE - Practice Sheet- Exercise-IV
20 Videos
- CHEMICAL THERMODYNAMICSBOOK - AAKASH SERIESCHAPTER - CHEMICAL THERMODYNAMICSEXERCISE - Additional Practice Exercise
54 Videos
- CHEMICAL THERMODYNAMICSBOOK - AAKASH SERIESCHAPTER - CHEMICAL THERMODYNAMICSEXERCISE - Practice Sheet- Exercise-II
30 Videos
- CHEMICAL KINETICSBOOK - AAKASH SERIESCHAPTER - CHEMICAL KINETICSEXERCISE - Objective Exercise - 4 (Assertion (A) & Reason (R) Type Questions)
44 Videos
- CHEMISTRY IN EVERY DAY LIFEBOOK - AAKASH SERIESCHAPTER - CHEMISTRY IN EVERY DAY LIFEEXERCISE - PRACTICE EXERCISE
29 Videos
Similar Questions
For a perfectly crystalline solid Cp.m=aT3, where a is constant. If Cp.m is 0.42 J/K − mol at 10K, molar entropy at 10K is
View SolutionWhich among the following is not an exact differential?
View SolutionAssertion: Under adiabatic free expansion, (dUdV)T is +ve when attractive forces are dominant between gas molecules [U,V,T respresent internal energy, volume and temperature of gas respectively]
Reason: Internal energy is a state function.
View Solution(A) Spontaneous reaction may be slow or fast.
(R ) Spontaneous nature deals with feasibility of the reaction but not rate.
View SolutionAnti allergy drugs are
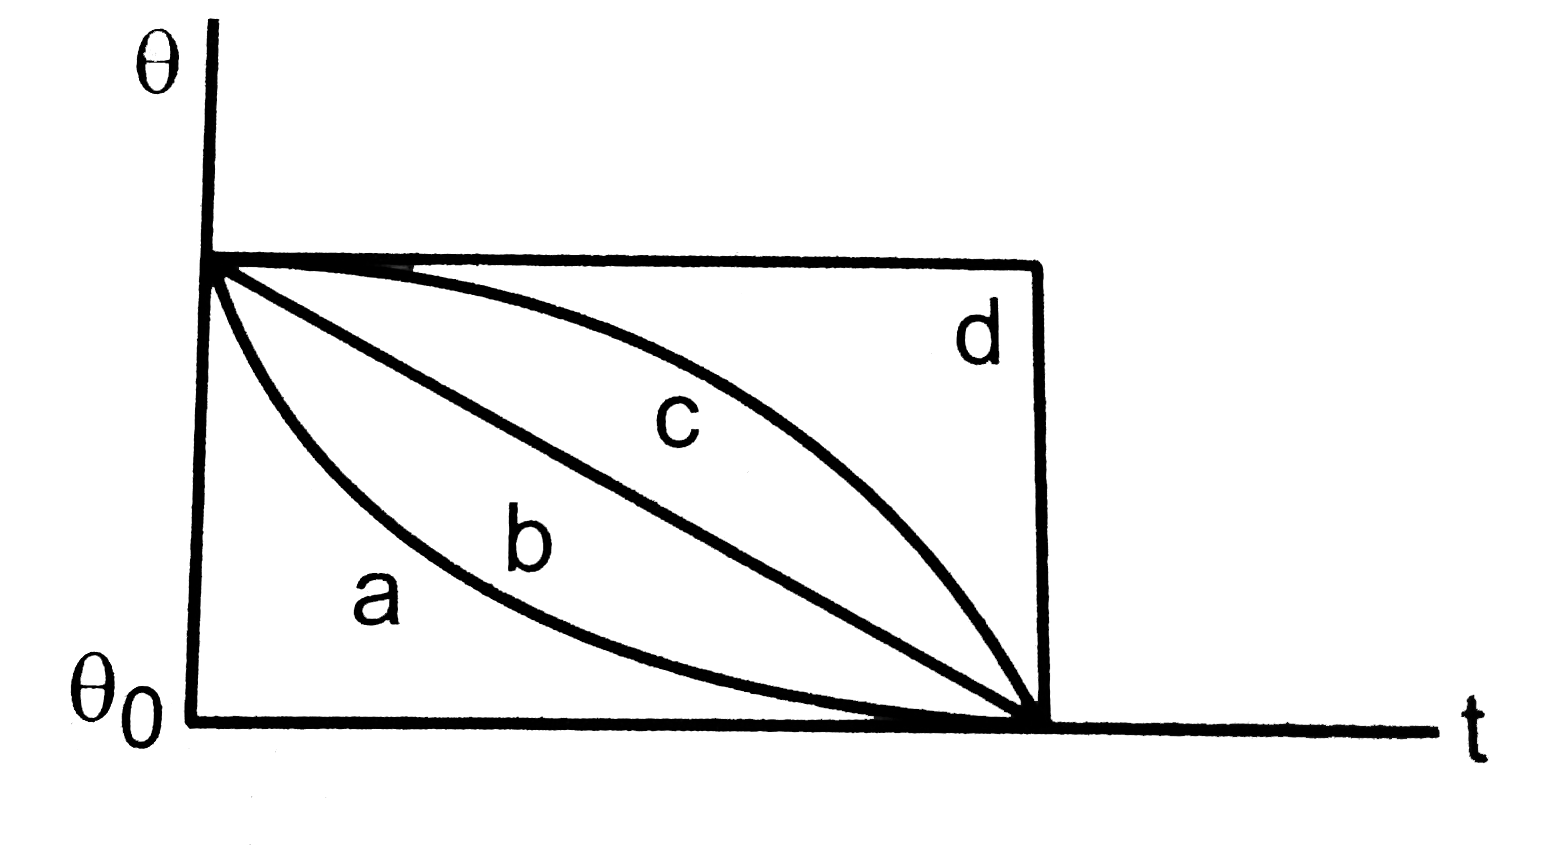
View SolutionA hot liquid is kept in a big room. Its temperature is plotted as a function of time. Which of the following curves may represent the plot?
View SolutionIdentify the correct statement for change of Gibbs energy for a system (ΔsysG) at constant temperature and pressure:
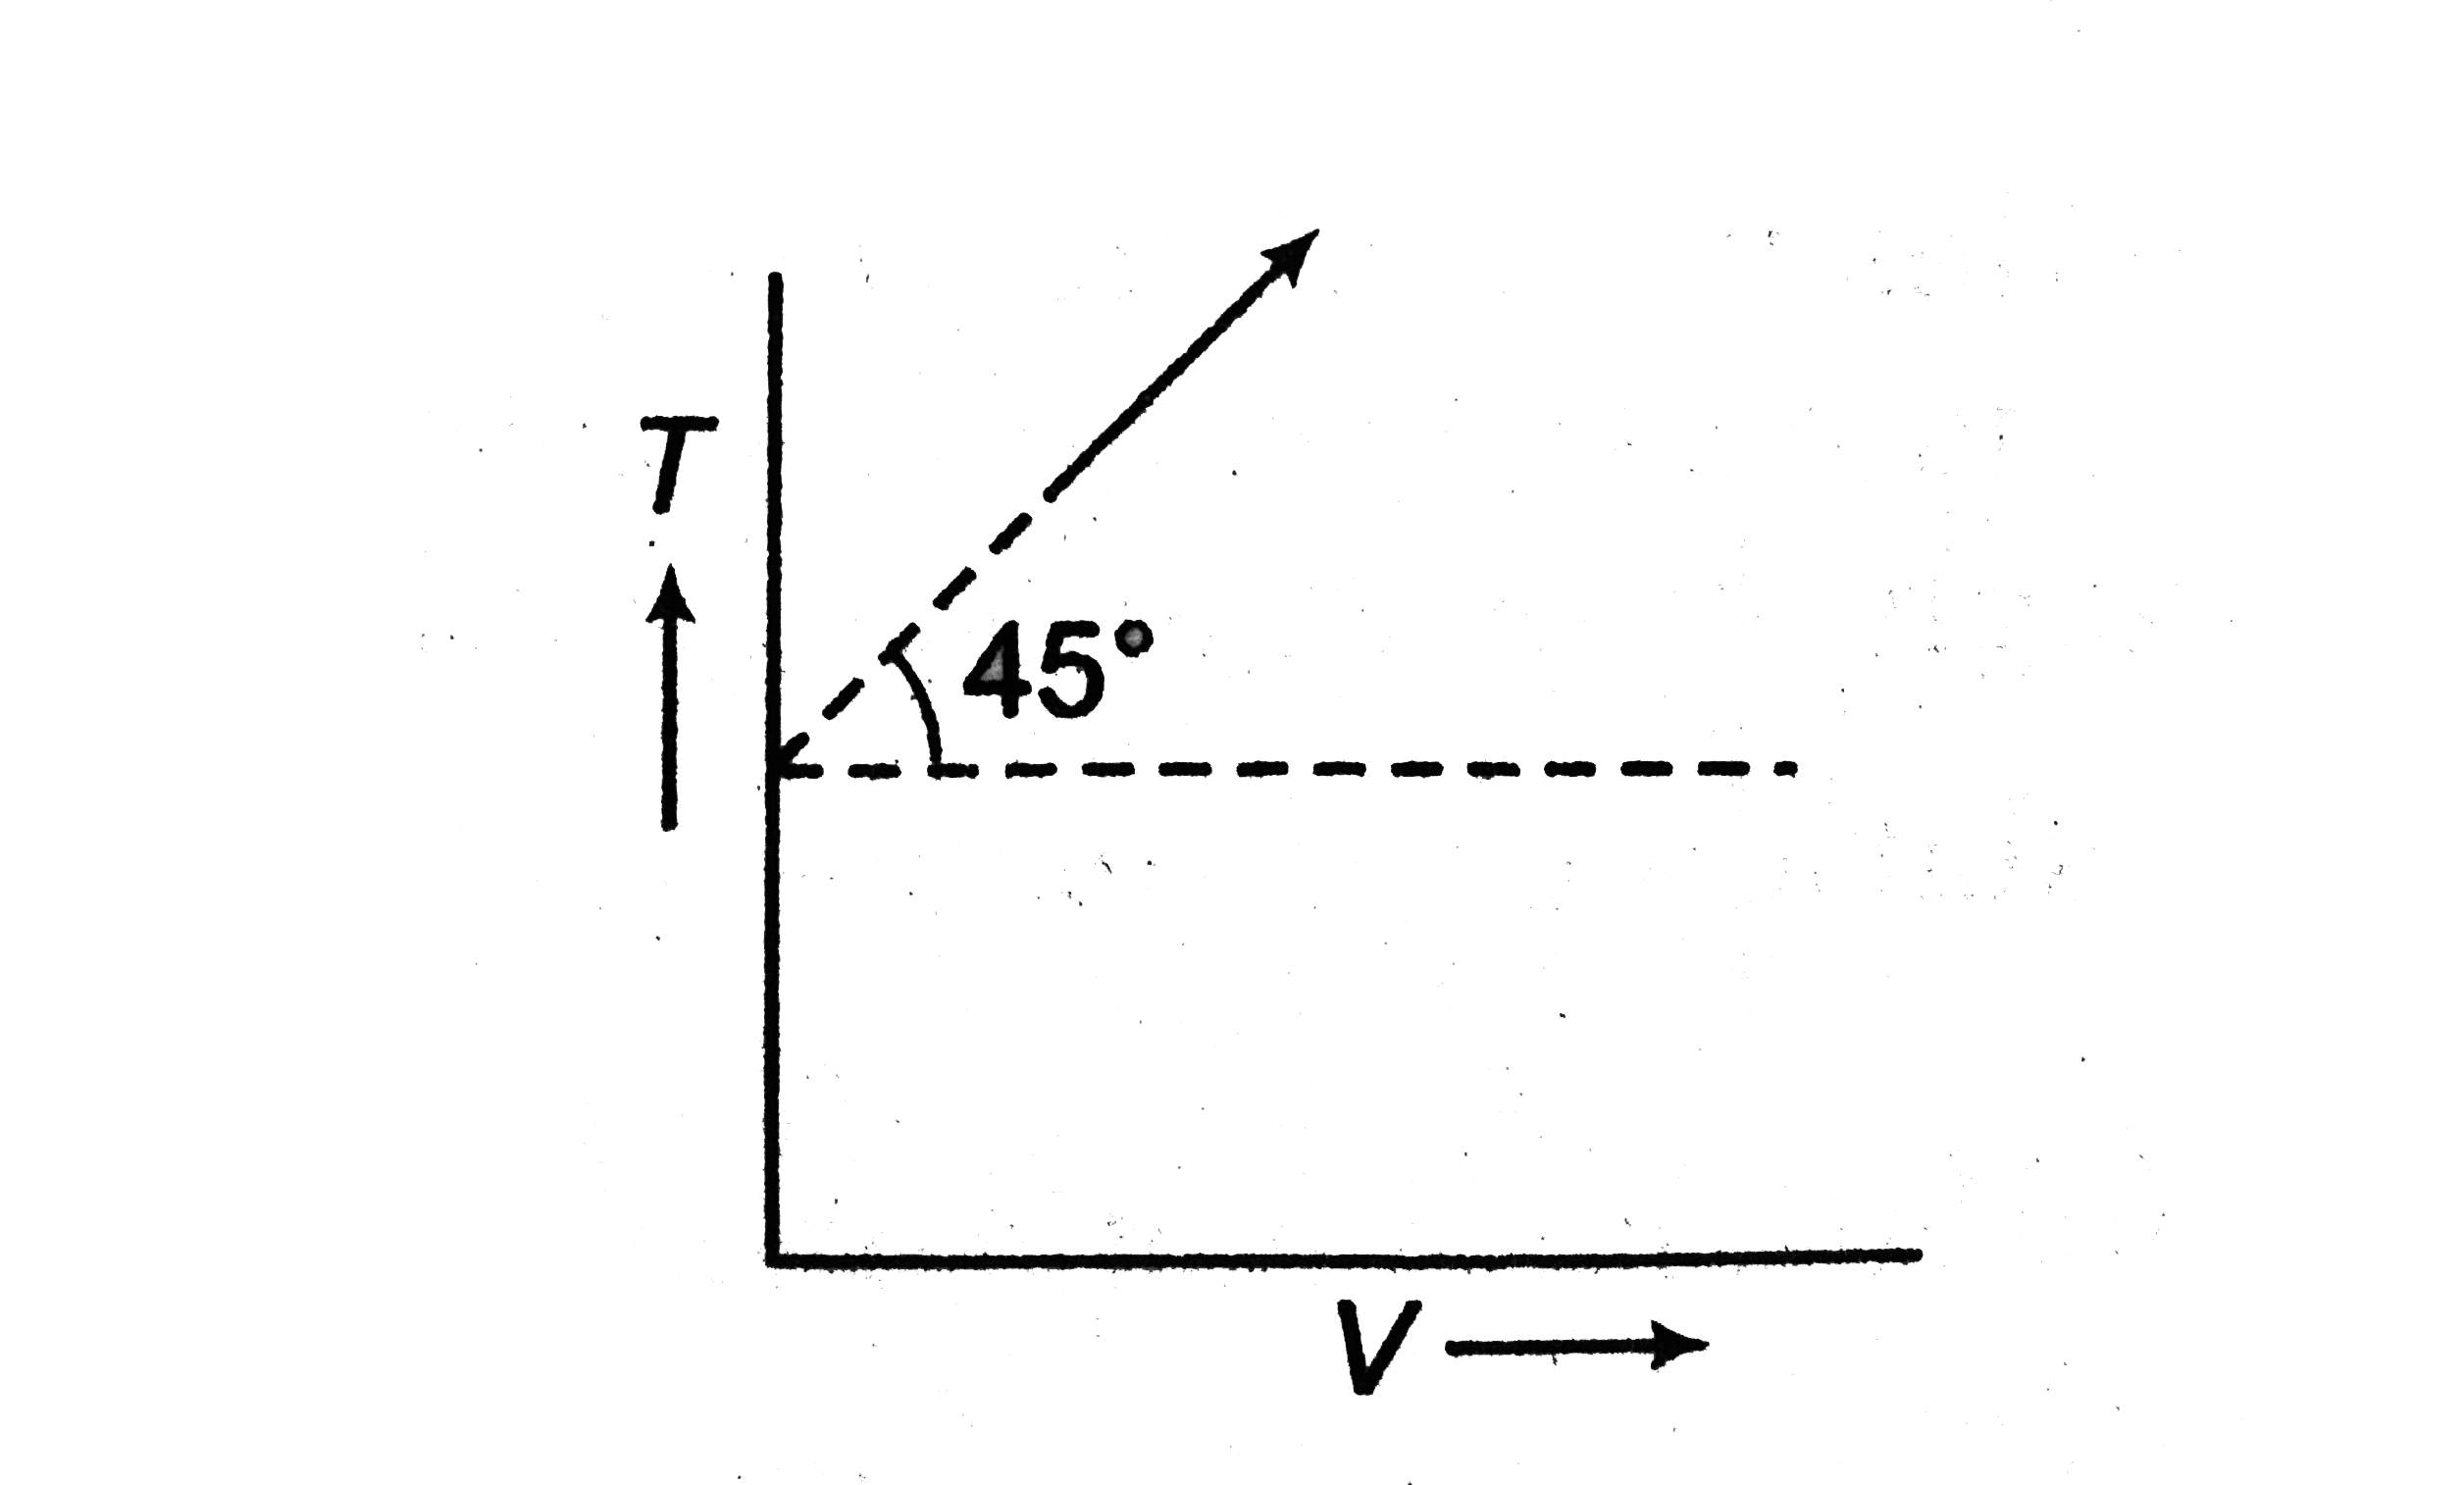
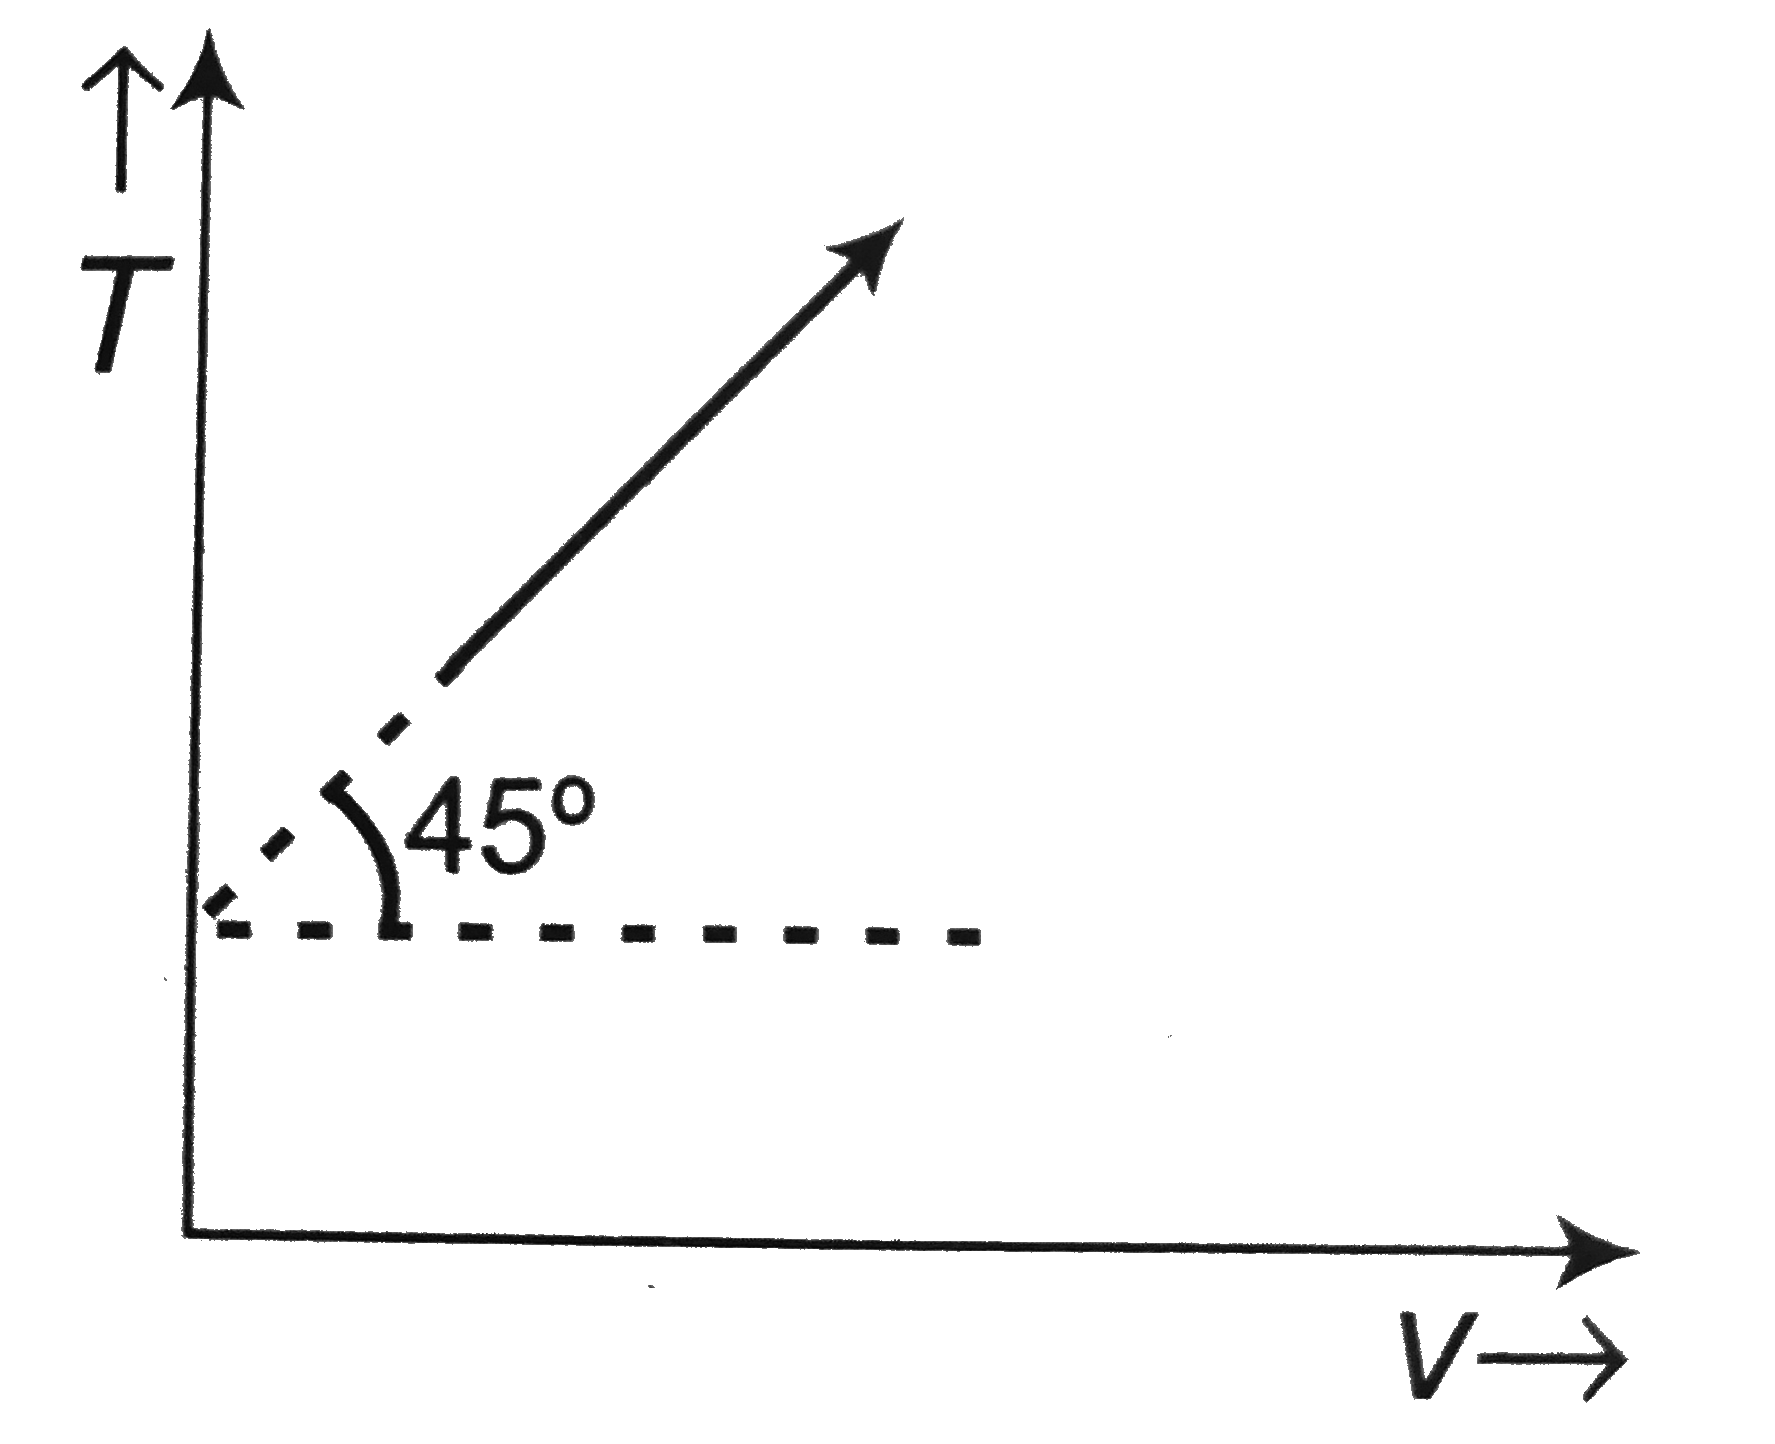
View SolutionThe given curve represents the variation of temperature as a function of volume for one mole of an ideal gas. Which of the following curves best represents the variation of pressure as a function of volume?
View SolutionThe changes in gibbs energy (Delta G) of a system for a process at constant temperature and pressure is
View SolutionThe following figure represents the temperature versus time plot for a given amount of a substance when heat energy is supplied to it at a fixed rate and at a constant pressure. Which part of plot represent a phase change?
View SolutionThe following curve represnets the variation of Gibbs function 'G' with pressure at constant temperature.
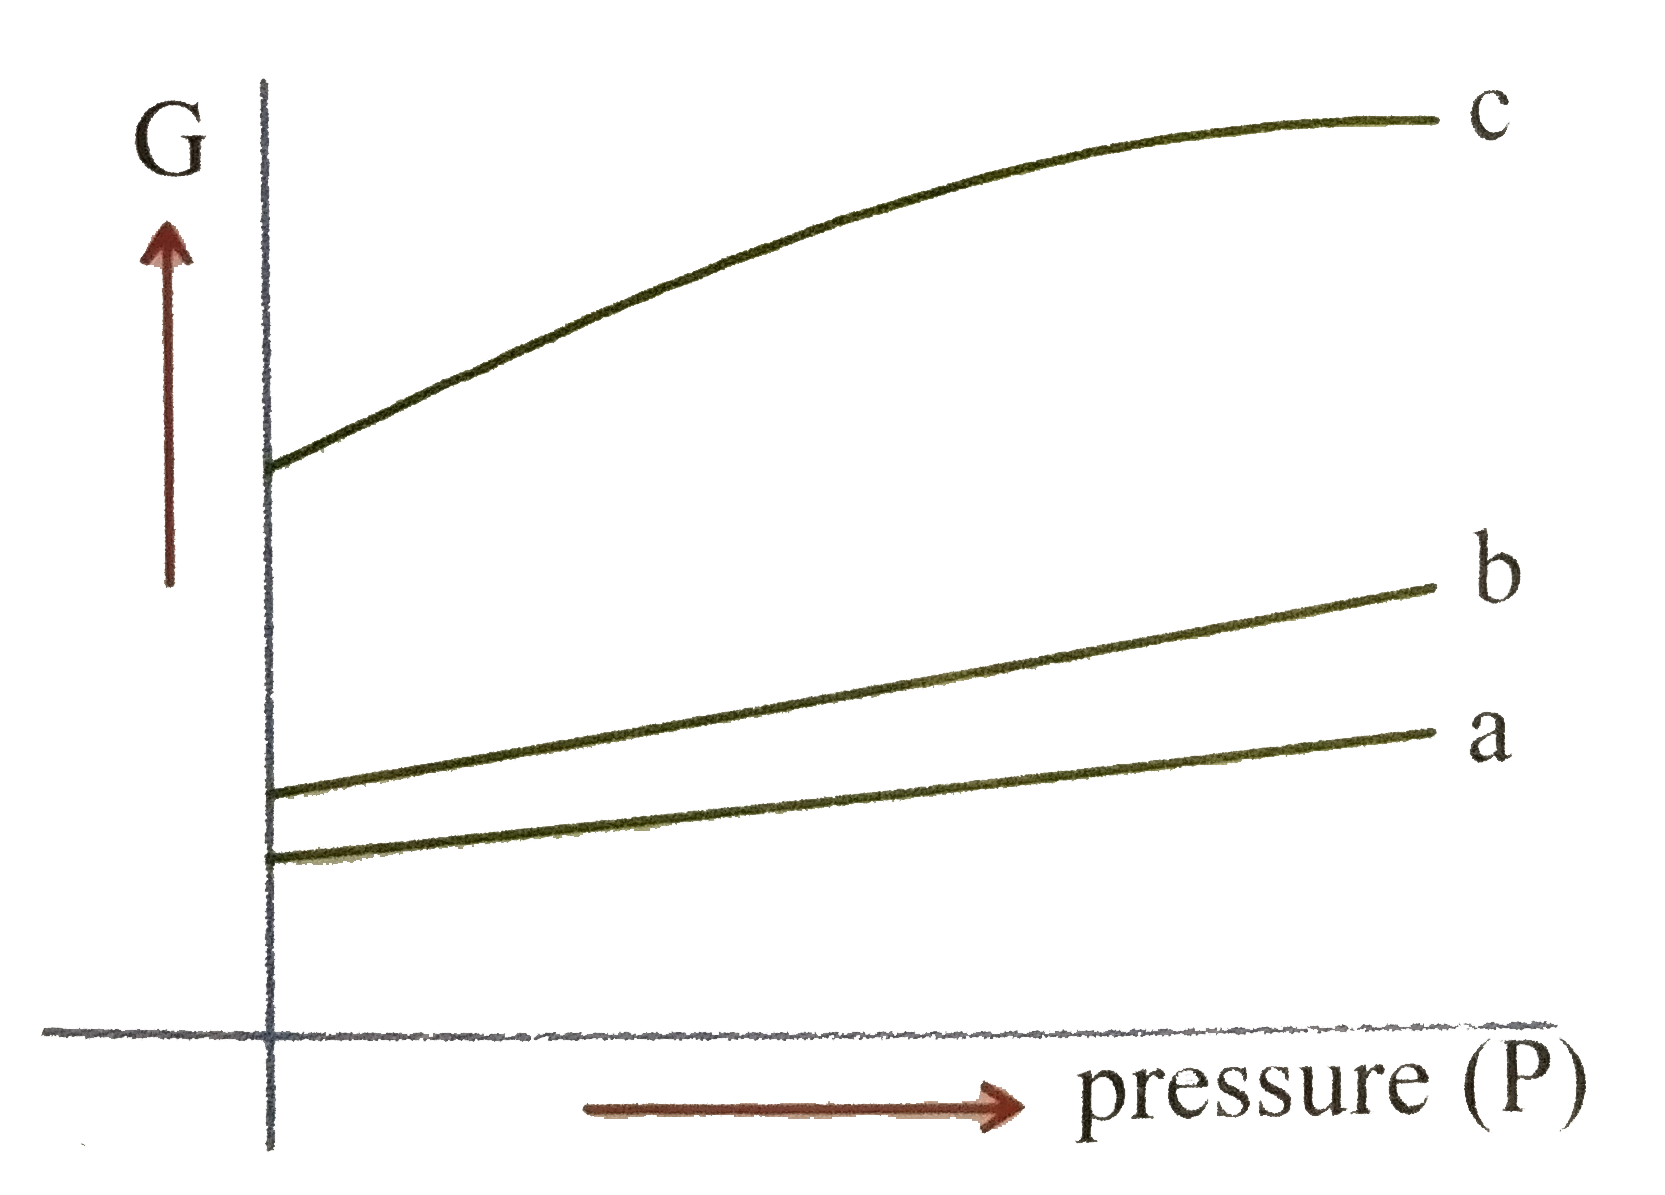
Correct match of given plots with the physical state of a substance is
View SolutionA hot liquid is kept in a big room. Its temperature is plotted as a function of time. Which of the following curves may represent the plot?

View SolutionThe given curve represents the variation of temperatue as a function of volume for one mole of an ideal gas. Which of the following curves best represents the variation of pressure as a function of volume ?
 .
.
View SolutionThe given curve represents the variation of temperature as a function of volume for one mole of an ideal gas. Which of the following curves best represents the variation of pressure as a function of volume?
View SolutionVariation of enthalpy and entropy of reaction with Temperature || Gibbs function || Condition for spontaneity || Physical significance of Gibbs free energy
View Solution
