Read the bar graph (Fig 3.4) and answer the questions that follow:Number of books sold by a bookstore during five consecutive years.
(i) About how many books were sold in 1989? 1990? 1992?
(ii) In which year were about 475 books sold? About 225 books sold?
(iii) In which years were fewer than 250 books sold?
(iv) Can you explain how you would estimate the number of books sold in 1989? 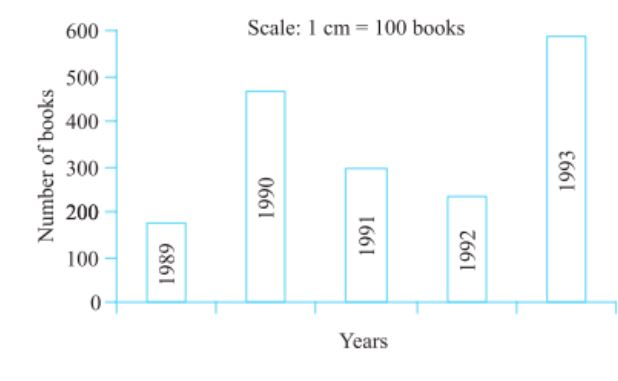
<imga≤ocr_imageload∈g=lazysrc=https://d10lpgp6xz60nq.cloudfront.net/physics_images/VII_03_E03_02_s01.pngwh=80%mx-autosty≤=background:white;>
We use the given bar graph to answer the given questions accurately.
From the given bar graph, we have
(i) In 1989, about 180 books were sold. In 1990, about 480 books were sold. In 1992, about 230 books were sold.
(ii) In 1990 about 475 books were sold and in 1992, about 225 books were sold.
(iii) In 1989 and 1992 fewer than 250 books were sold.
(iv) From the graph, we can conclude that 180 books were sold in 1989. This can be estimated by drawing a line from the top of 1989 bar to the y-axis.
Topper's Solved these Questions
Similar Questions
Read the bar graph which shows the number of books sold by a bookstore during five consecutive years and answer the following questions
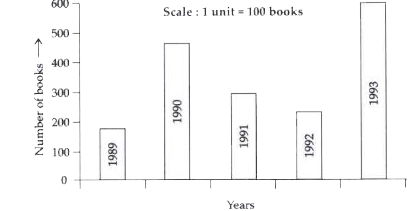
In which year lowest books were sold ?
View SolutionRead the bar graph which shows the number of books sold by a bookstore during five consecutive years and answer the following questions
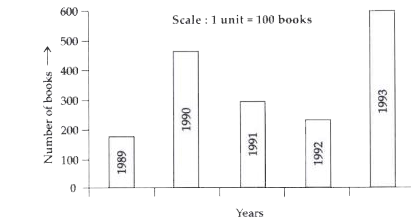
In which year highest books were sold ?
View Solution
Knowledge Check
The Bar graph given below presents the number of books sold by a bookseller during different months of a year.
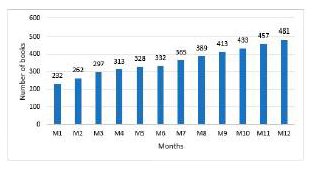
What is the total number of books sold by the bookseller in the year?A4032B4132C4302D4202The Bar graph given below presents the number of books sold by a bookseller during different months of a year.
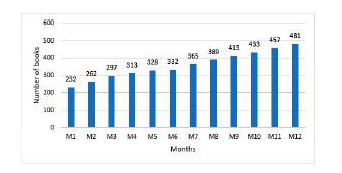
The number of books sold in month M8 is how much more than the average number of books sold per month?A34.5B22.5C30.5D26.5
Read the bar graph which shows the number of books sold by a bookstore during five consecutive years and answer the following questions
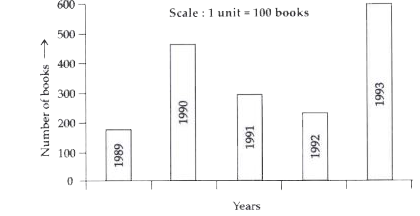
Can you give an appropriate name to the bar graph shown above ?
View SolutionRead the bar graph which shows the number of books sold by a bookstore during five consecutive years and answer the following questions
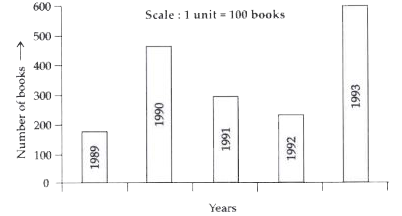
In which years were fewer than 200 books sold ?
View SolutionStudy the following graph and answer the question that follows.
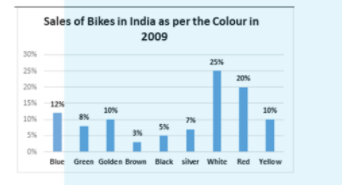
If the total number of bikes sold in 2009 was 10000 how many more yellow bikes were sold than green ones?
View SolutionThe following bar graph represents the number of cold drink bottles sold by a shopkeeper on six consecutive days.
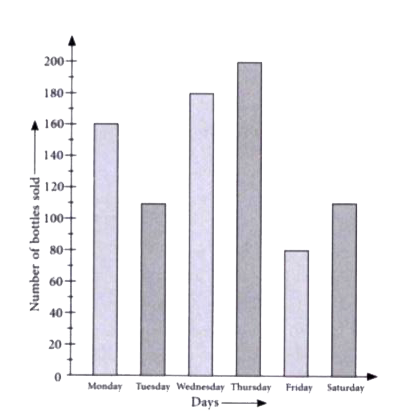
On which day minimum number of bottles were sold?
View SolutionThe following bar graph represents the number of cold drink bottles sold by a shopkeeper on six consecutive days.
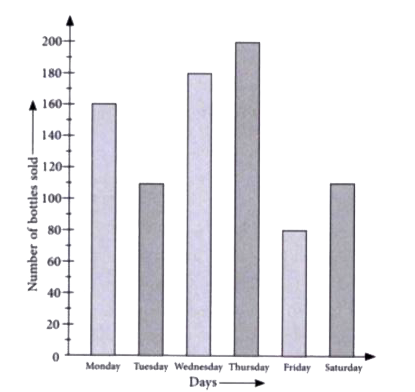
On which two days same number of bottles were sold?
View Solution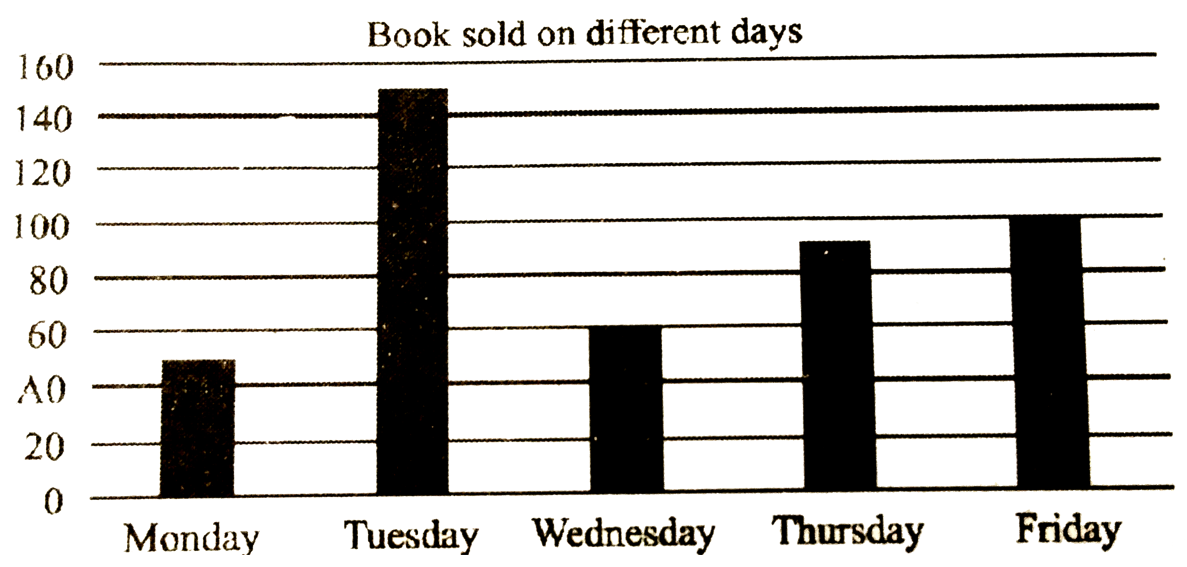
Total number of books sold on Tuesday are 25% more than total number of books sold on Sunday. Find total number of books sold on Sunday ?
View Solution