In what type of graph comparison among the class frequencies is possible?
Histogram
Topper's Solved these Questions
- GRAPHICAL REPRESENTATION OF DATABOOK - FULL MARKSCHAPTER - GRAPHICAL REPRESENTATION OF DATAEXERCISE - TEST ASSIGNMENT
3 Videos
- GRAPHICAL REPRESENTATION OF DATABOOK - FULL MARKSCHAPTER - GRAPHICAL REPRESENTATION OF DATAEXERCISE - ADDITIONAL QUESTIONS SOLVED (LONG ANSWER QUESTIONS)
3 Videos
- DATA-ITS SOURCE AND COMPLIATIONBOOK - FULL MARKSCHAPTER - DATA-ITS SOURCE AND COMPLIATIONEXERCISE - ADDITIONAL QUESTION SOLVED (IV. VIVA-VOCE QUESTIONS)
8 Videos
- HUMAN DEVELOPMENTBOOK - FULL MARKSCHAPTER - HUMAN DEVELOPMENTEXERCISE - Worksheet (Based on Chapter -4)
12 Videos
Similar Questions
When we take class intervals on the x-axis and corresponding frequencies on the y-axis, and draw rectangles with the areas proportional to the frequencies of the respective class intervals, the graph so obtained is called
View SolutionDraw a comparison among petrol, LPG and CNG as automobile fuels.
View Solution
Knowledge Check
What type of atmosphere is good for class room teaching ?
ASuppressedBDemocraticCPeacefulDLessez faireAmong the following which reactions are possible
AF2+H2O→HF+O2BCl2+H2O→HCl+HClOCBr2+H2O→HBr+HBrODI2+H2O→HI+HIOA meaningful comparison between two countries is possible on the basis of :
ACommon currencyBCommon price levelCBoth (a) and (b)DAny other
Draw a comparison among petrol, LPG and CNG as automobile fuels.
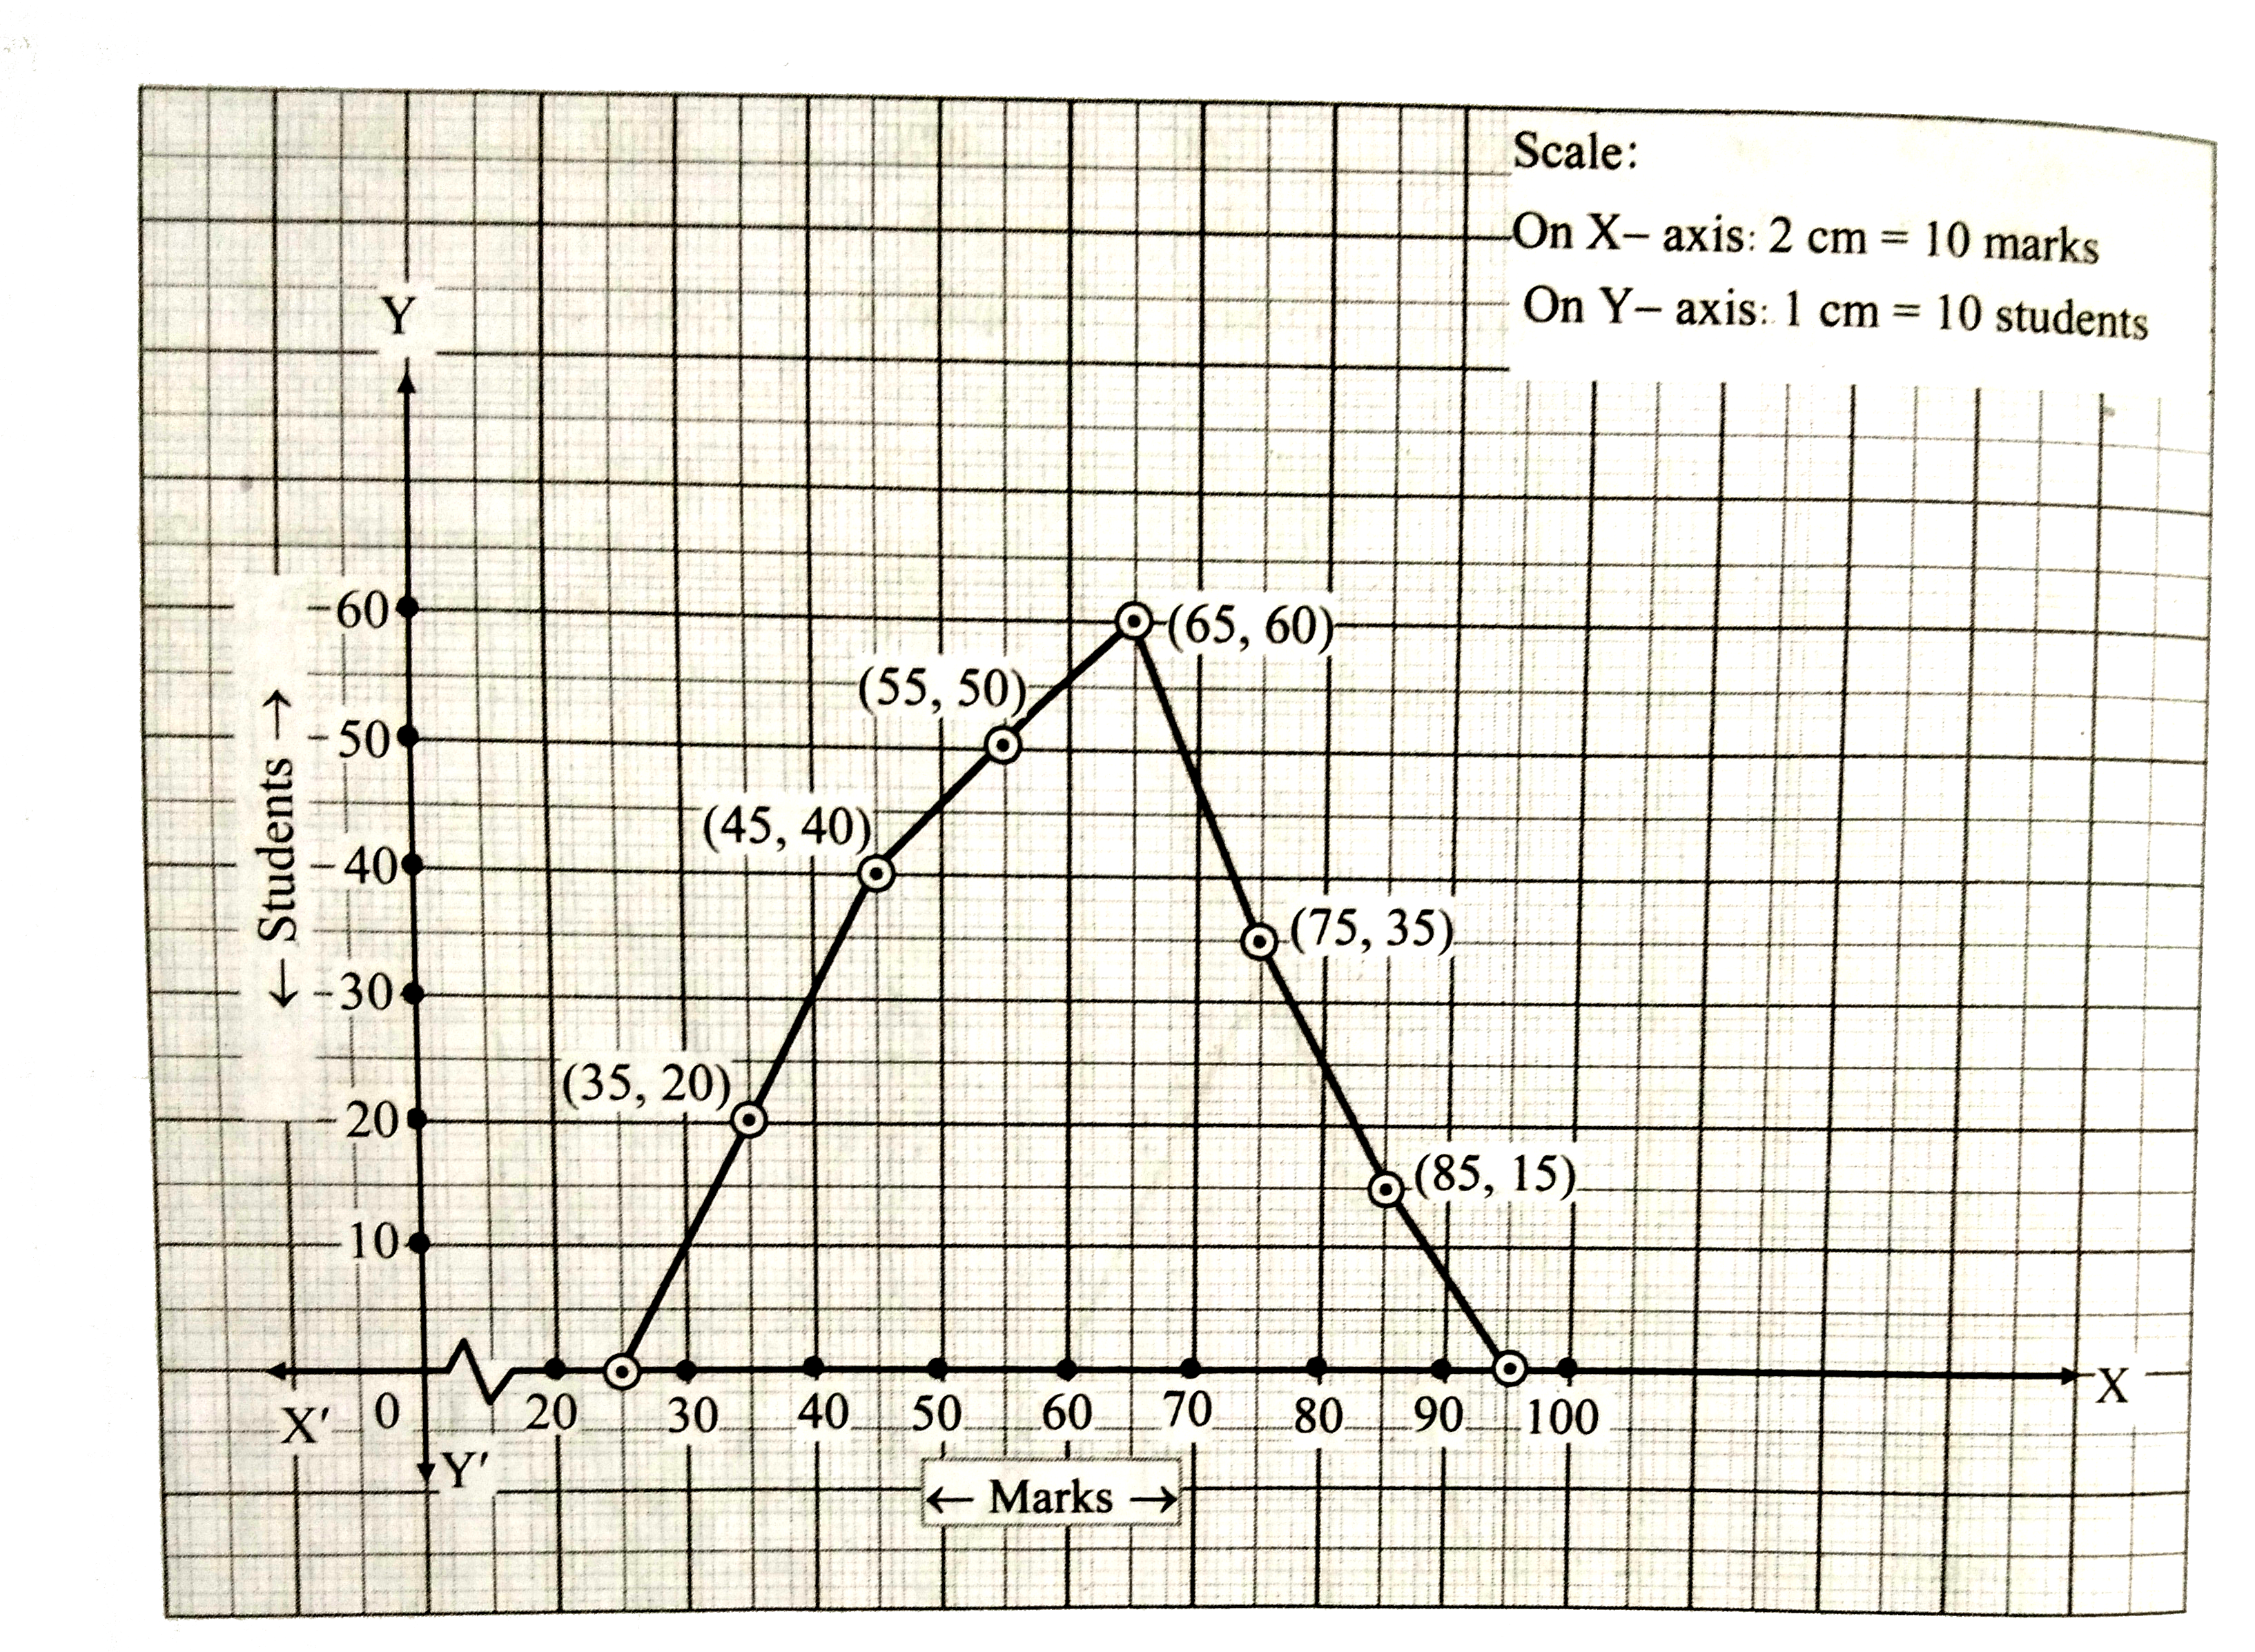
View SolutionObserve the following frequency polygon and write the answers of the questions below it.
i. Which class has the maximum number of students?
ii. Write the classes having zero frequency.
iii. What is the class mark of the class, having frequency of 50 students ?
iv. Write the lower and upper class limits of the class whose class mark is 85.
v. How many students are in the class 80−90?

View SolutionIf the width of each of the ten classes in frequency distribution is 2.5 and the lower class boundary of the lowest class is 5.1, then the upper class boundary of the highest class IS
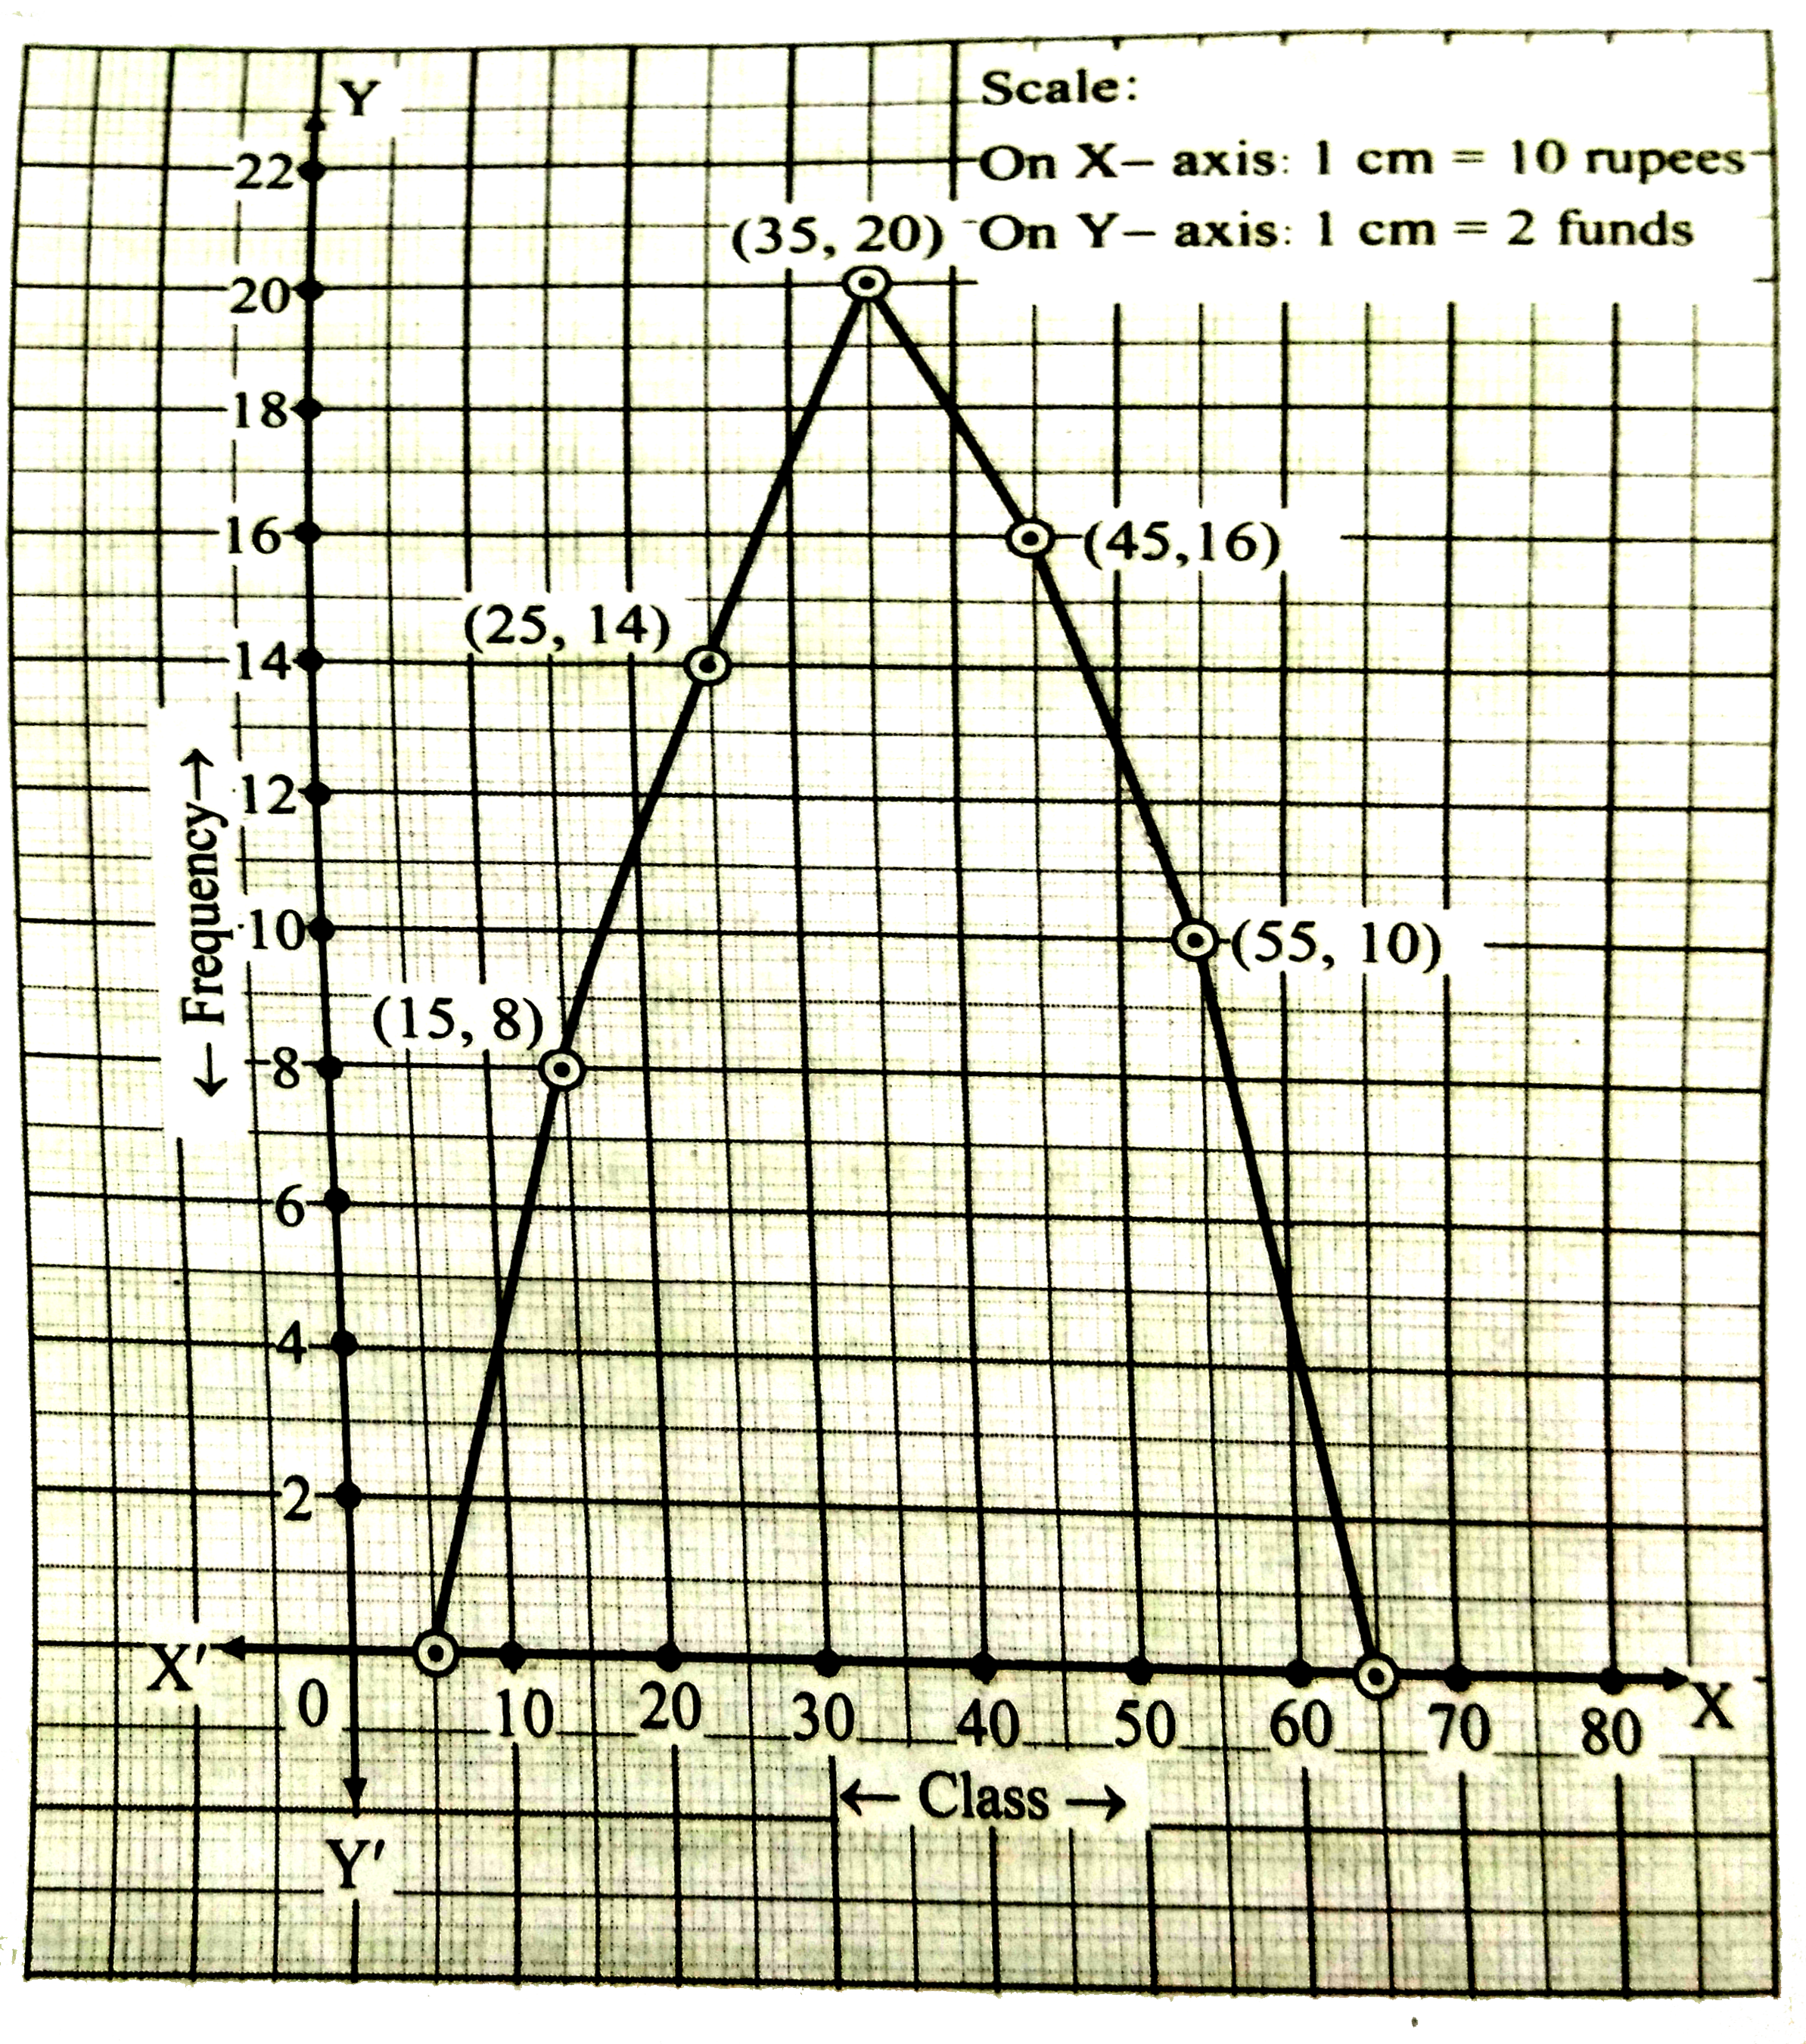
View SolutionAnswer the following questions based on the frequency polygon given in the figure.
i. Write frequency of the class 50−60.
ii State the class whose frequency is 14.
iii. State the class whose class mark is 55.
iv. Write the class in which the frequency is maximum.
v. Write the classes whose frequencies are zero.

View SolutionIf there is a lack of money supply in comparison to the supply of goods and services, then the possible consequence would be_____.
View Solution
