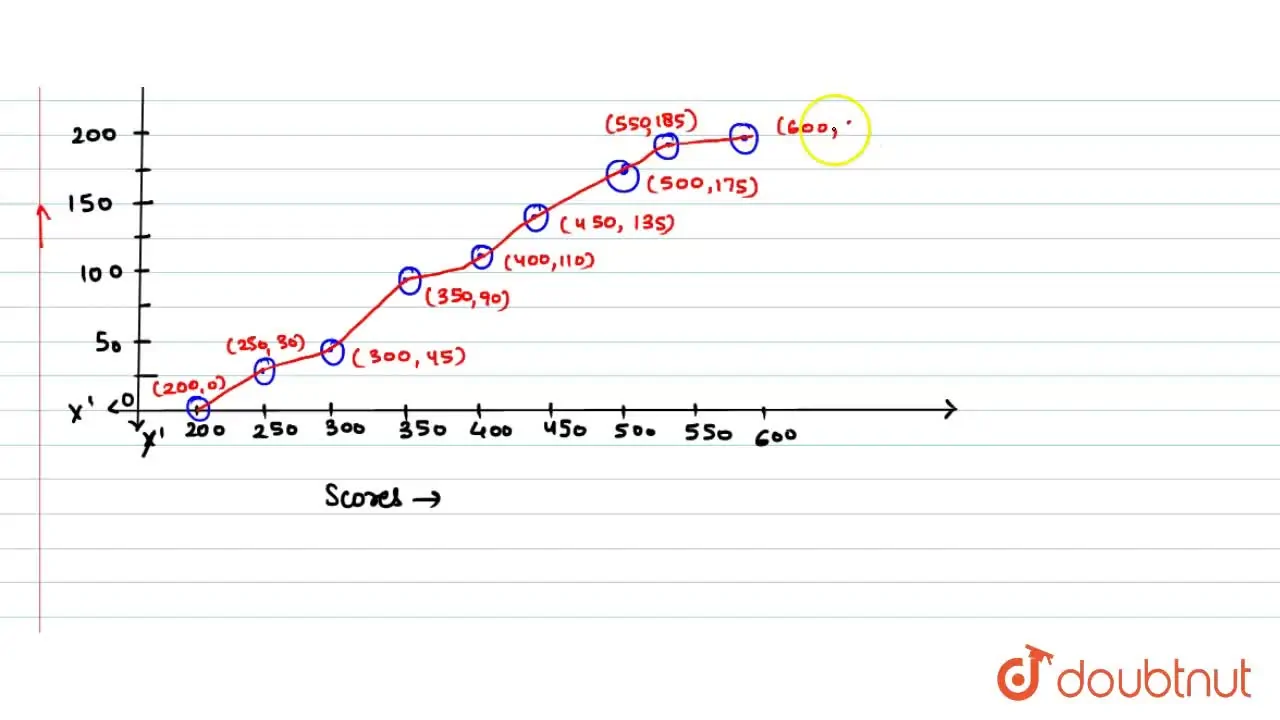
The table given below shows the frequency distribution of the scores obtained by 200 candidates in an entrance examination:

Draw cumulative frequency curve using 'less than series'.
Step by step video & image solution for The table given below shows the frequency distribution of the scores obtained by 200 candidates in an entrance examination: Draw cumulative frequency curve using 'less than series'. by Maths experts to help you in doubts & scoring excellent marks in Class 10 exams.
Related Playlists
Similar Questions
The following table shows frequency distribution of marks secured by 100 students in a particular examination. Find the mean of the marks.
 View Solution
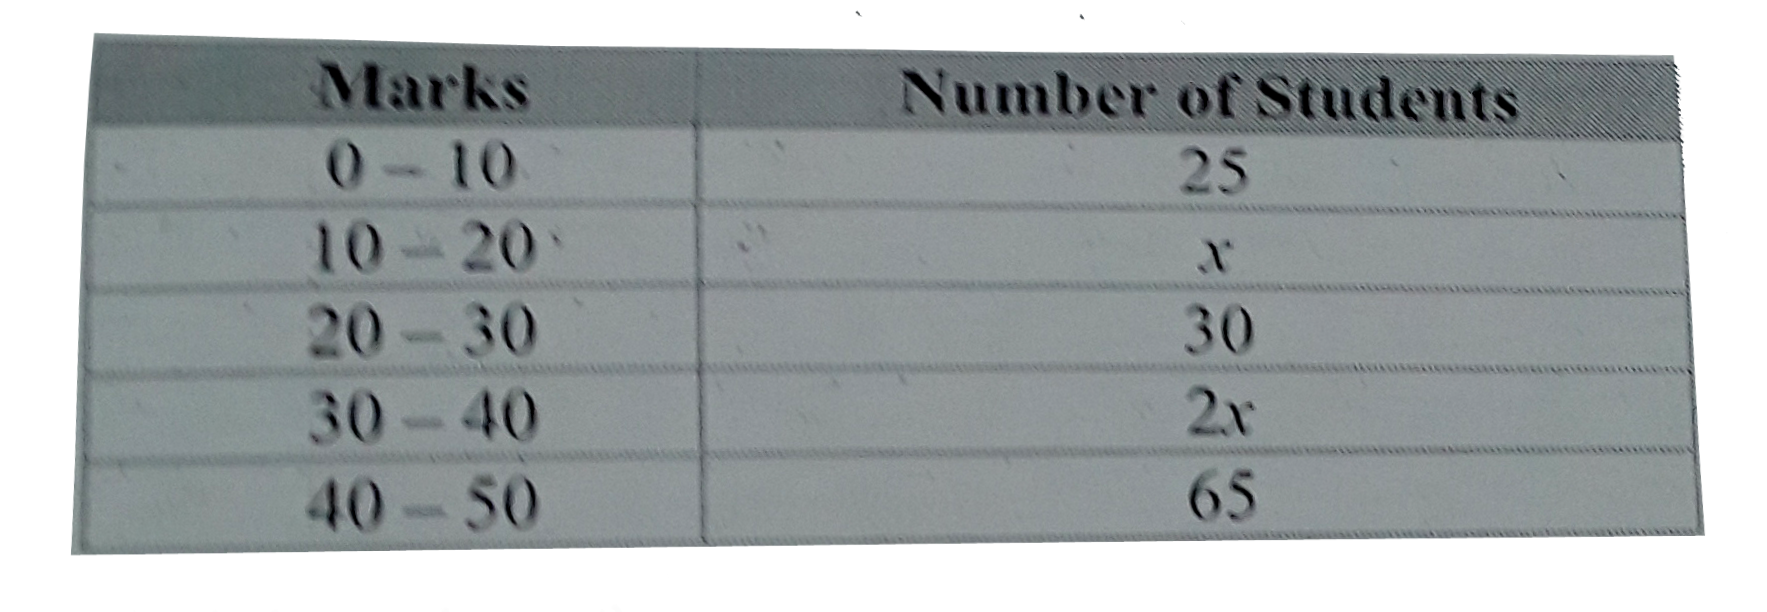
The following frequency distbution table shows marks obtained by 180 students in Mathematics examination

Find the value of x .View SolutionIn 'Less than' cumulative frequency distribution the omitted limit is
View SolutionThe frequency distribution of marks obtained by students in a class test is given below .
Draw frequency polygon and ogive.
 View Solution
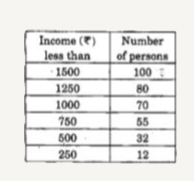
The following table gives less than' type frequency distribution of income per day:

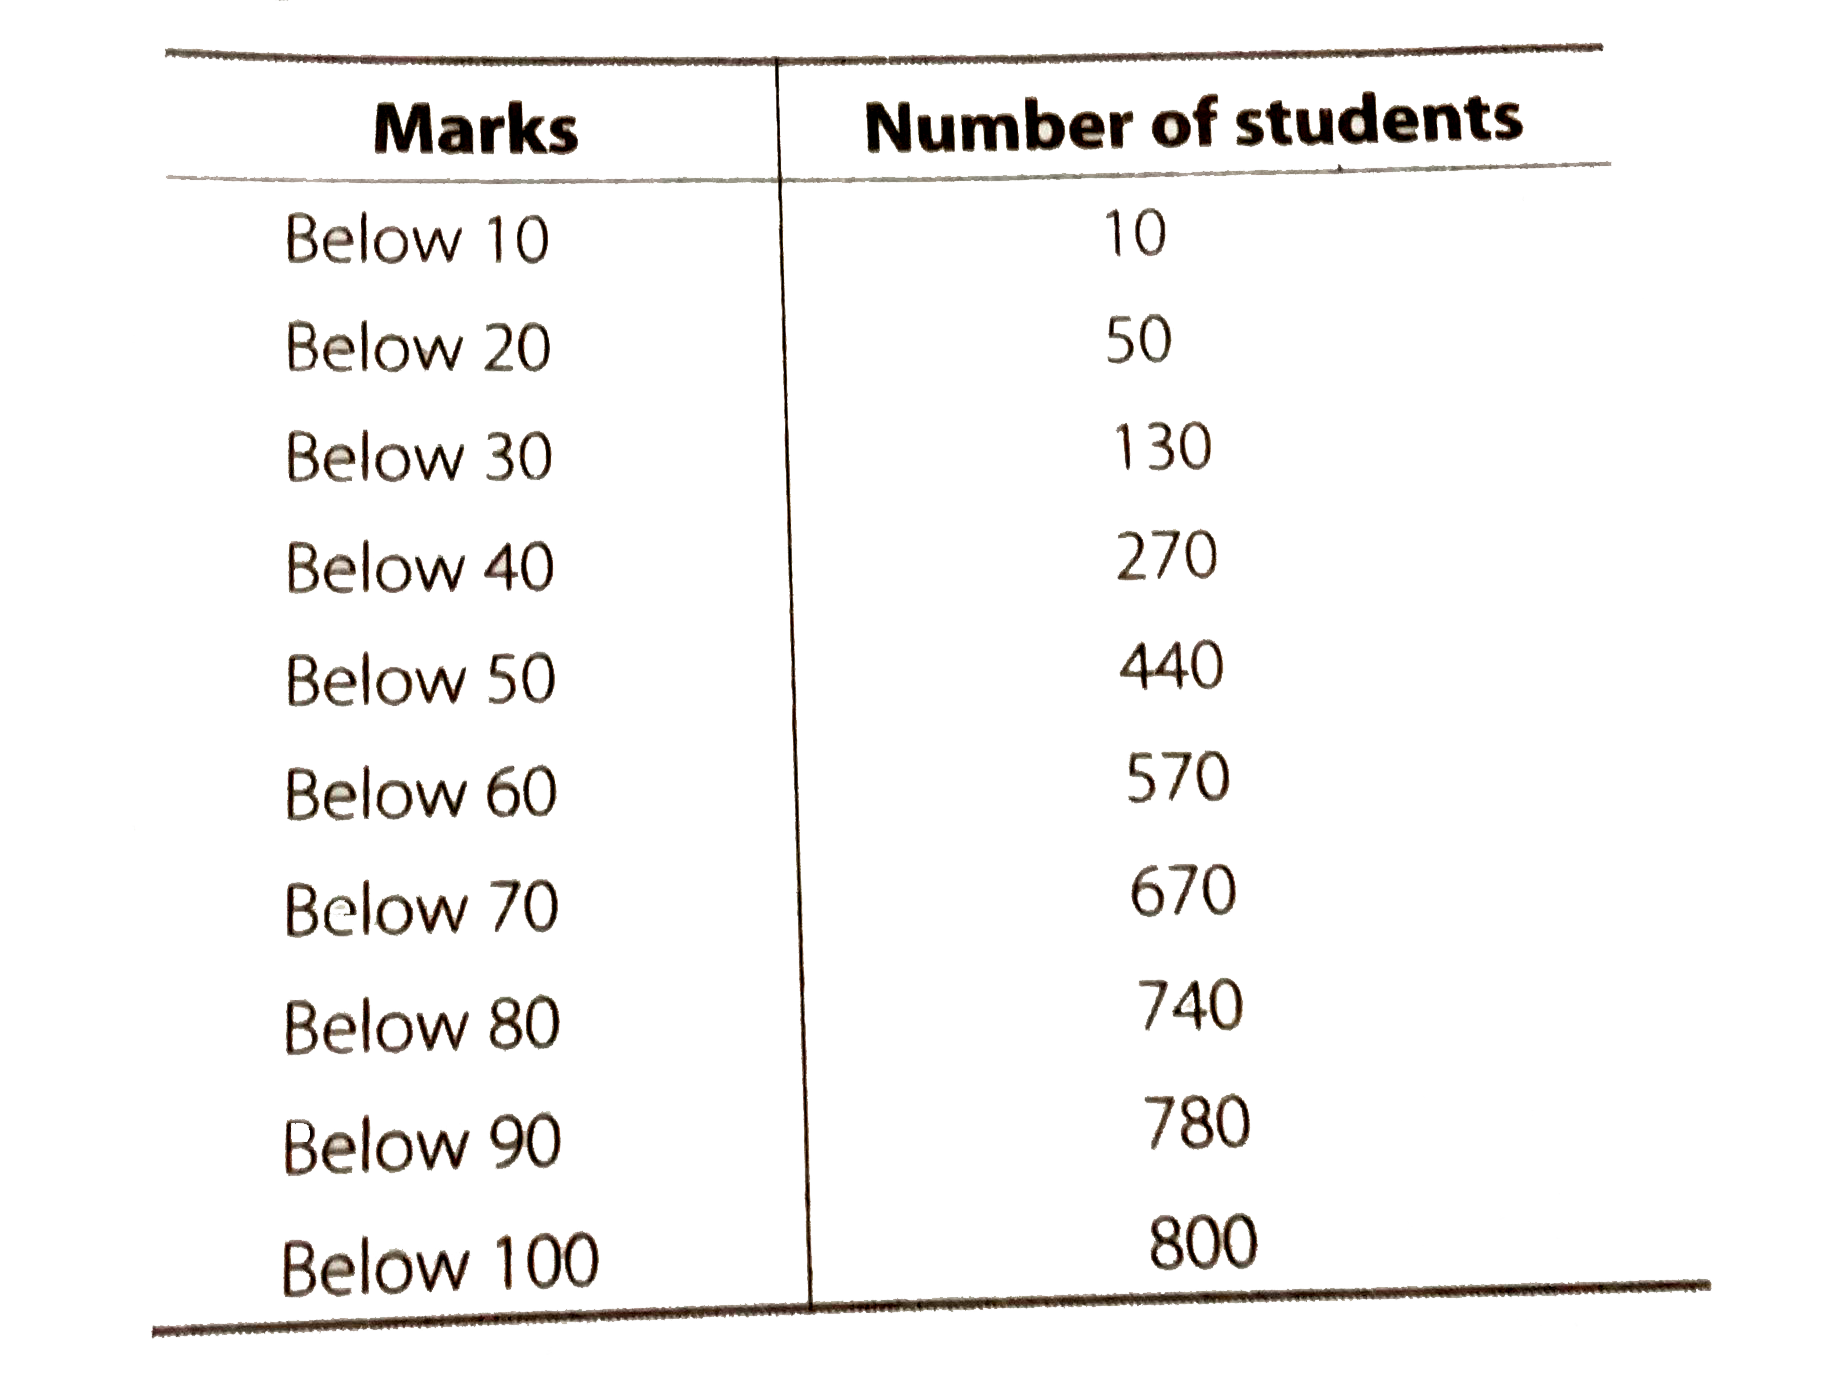
What is the modal class ?View SolutionThe following table show tha cumulative frequency distribution of marks of 800 students in an examination.

Construct a frequency distribution table for the data above.View SolutionDraw a less than ogive for the following frequency distribution.
View SolutionIn Case Of Less Than Cumulative Frequency Series
View SolutionDraw a 'less than' ogive for the following frequency distribution:
View SolutionWrite the following data into less than cummulative frequency distribution table.
 View Solution


