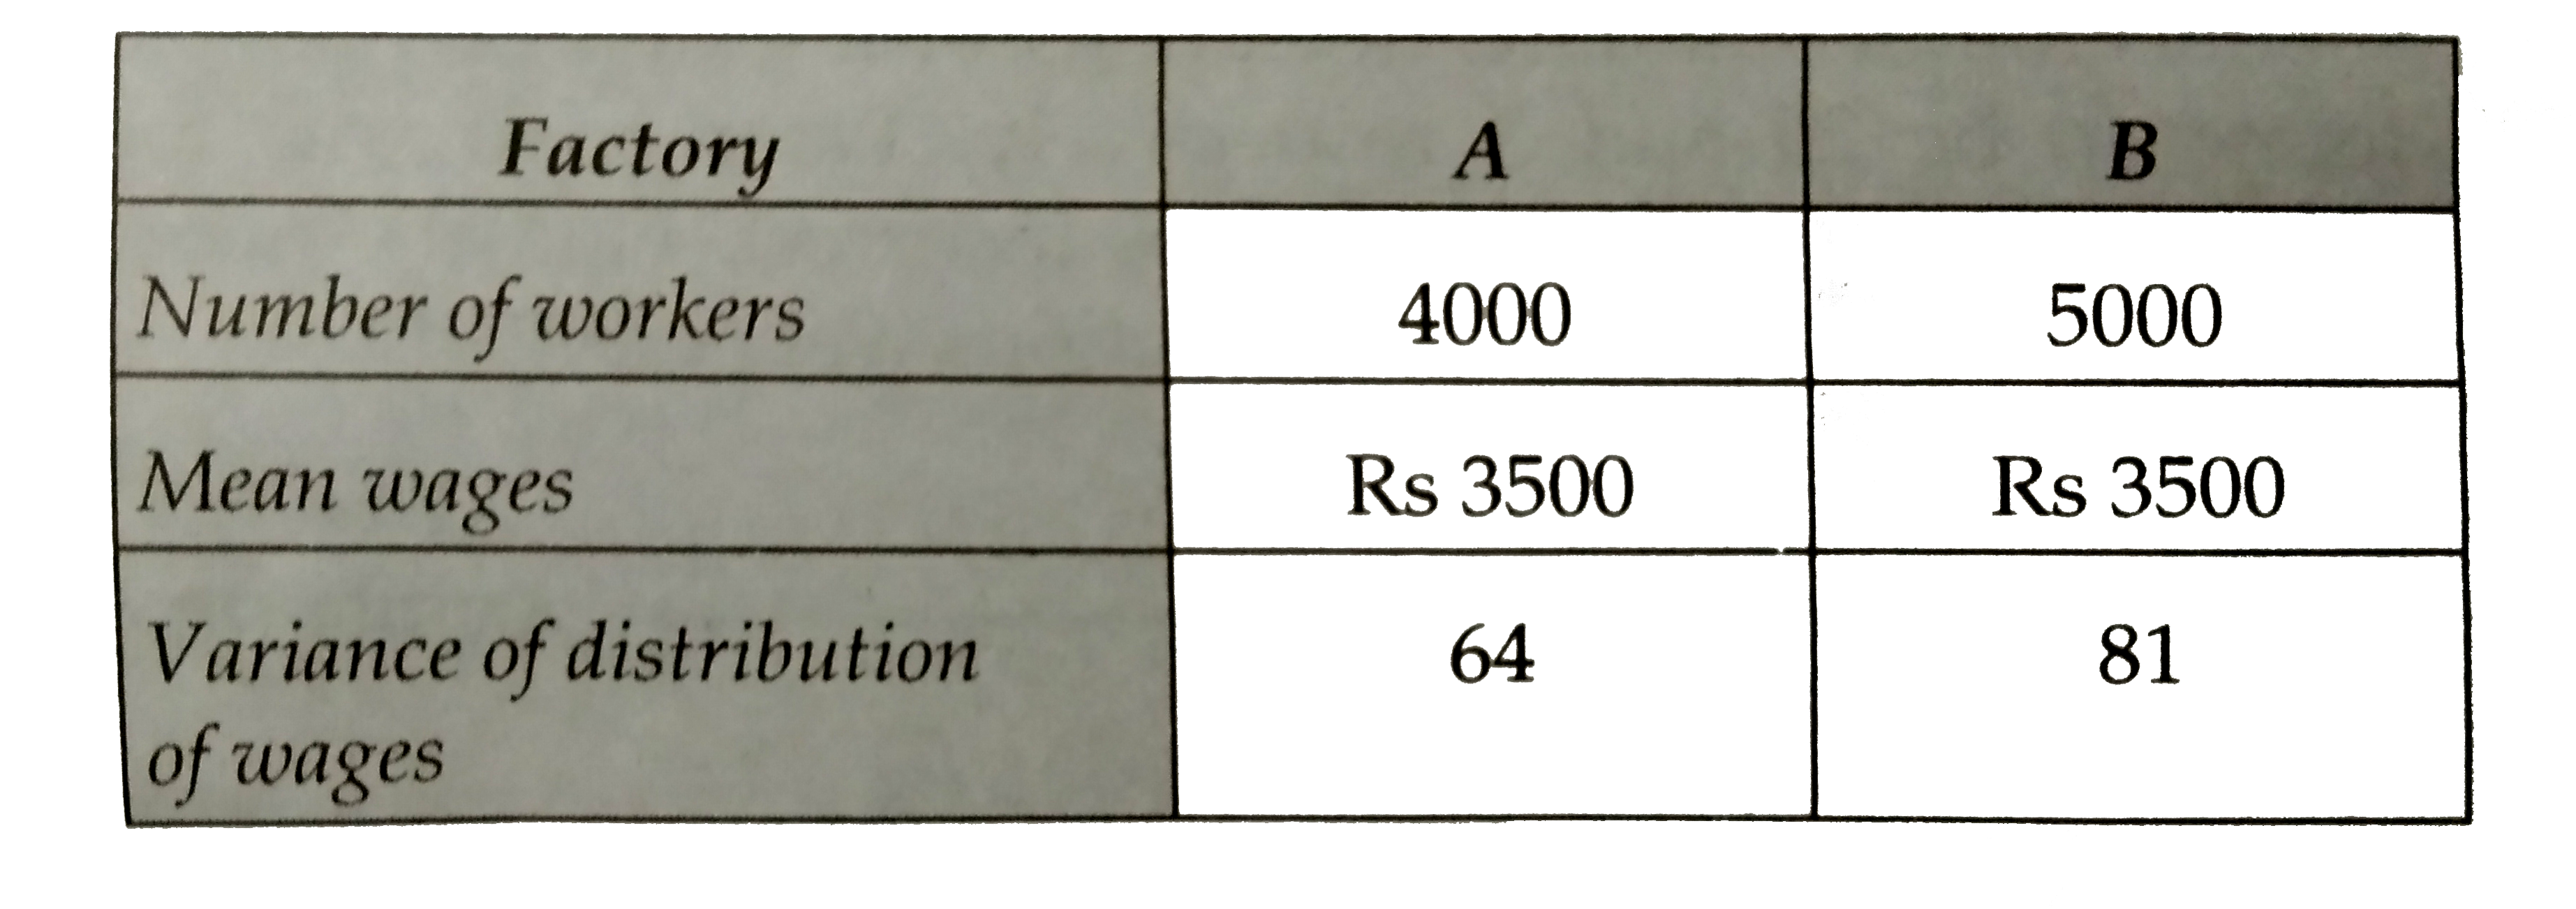
The following results show the number of workers and the wages paid to them in two factories A and B.

Which factory has more variation in wages ?
We have :
Variance of distribution of wages in factory A,σ21=64.
Variance of distribution of wages in factory B,σ22=81.
∴ (σ21=64andσ22=81)⇒(σ1=8andσ2=9).
Thus, SD of distribution of wages in factory A= 8.
And, SD of distribution of wages in facotry B=9. ltbvrgt Since the monthly mean wages in two factories are the same and σ1<σ2, hence, the factory B has more variation in wages.
Related Playlists
- BOOK - RS AGGARWALCHAPTER - STATISTICSEXERCISE - Miscellaneous word problems (EXAMPLE)6videos
STATISTICS
- BOOK - RS AGGARWALCHAPTER - STATISTICSEXERCISE - EXERCISE 30A18videos
STATISTICS
- BOOK - RS AGGARWALCHAPTER - SOME SPECIAL SERIESEXERCISE - EXERCISE 13B (Very short Answer Questions)9videos
SOME SPECIAL SERIES
- BOOK - RS AGGARWALCHAPTER - STRAIGHT LINES EXERCISE - EXERCISE 20K10videos
STRAIGHT LINES
Similar Practice Problems
- Question 1 - Select One
The average of daily wages for the workers of the two factories combined is
 A2⋅22B3⋅15C4.10Dnone of these
Similar Questions
Two plants A and B of a factory show following results about the number of workers and the wages paid to them. Plant A Plant B No. of workers 5000 6000 Average monthly wages Rs. 2500 Rs. 2500 Variance of distribution of wages 81 100 In which plant A or B is there greater variability in individual wages?
View SolutionTwo plants A and B of a factory show following results about the number of workers and the wages paid to them.

In which plant, A or B is there greater variability in individual wages?View SolutionThe following table shows the weights of 12 workers in a factory :

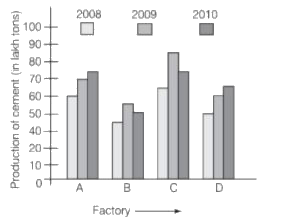
find the mean weight of the workers.View SolutionThe following graph shows the production of cement (in lakh tons) of four factories A, B, C and D over the years

Which of the four factories has recorded the maximum percentage growth in production of cement from 2008 to 2009 ?View SolutionFind the mean of the daily wages of 60 workers in a factory as per given below
View SolutionThe following data shows daily wages of 199 workers of a factory. Find out quartile deviation and the coefficient of quartile deviation.
 View Solution
The following table shows monthly wages of 10 workers:

Calculate first third quartiles and quartile deviation.View SolutionThe following table shows the weights (in kg) of 15 workers in a factory
Calculate the mean weight
 View Solution
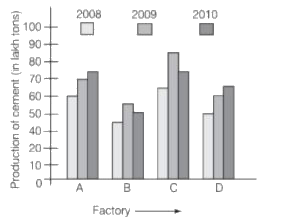
The following graph shows the production of cement (in lakh tons) of four factories A, B, C and D over the years

Which of the given factories has recorded the maximum percentage growth in production of cement from 2009 to 2010 ?View Solution

