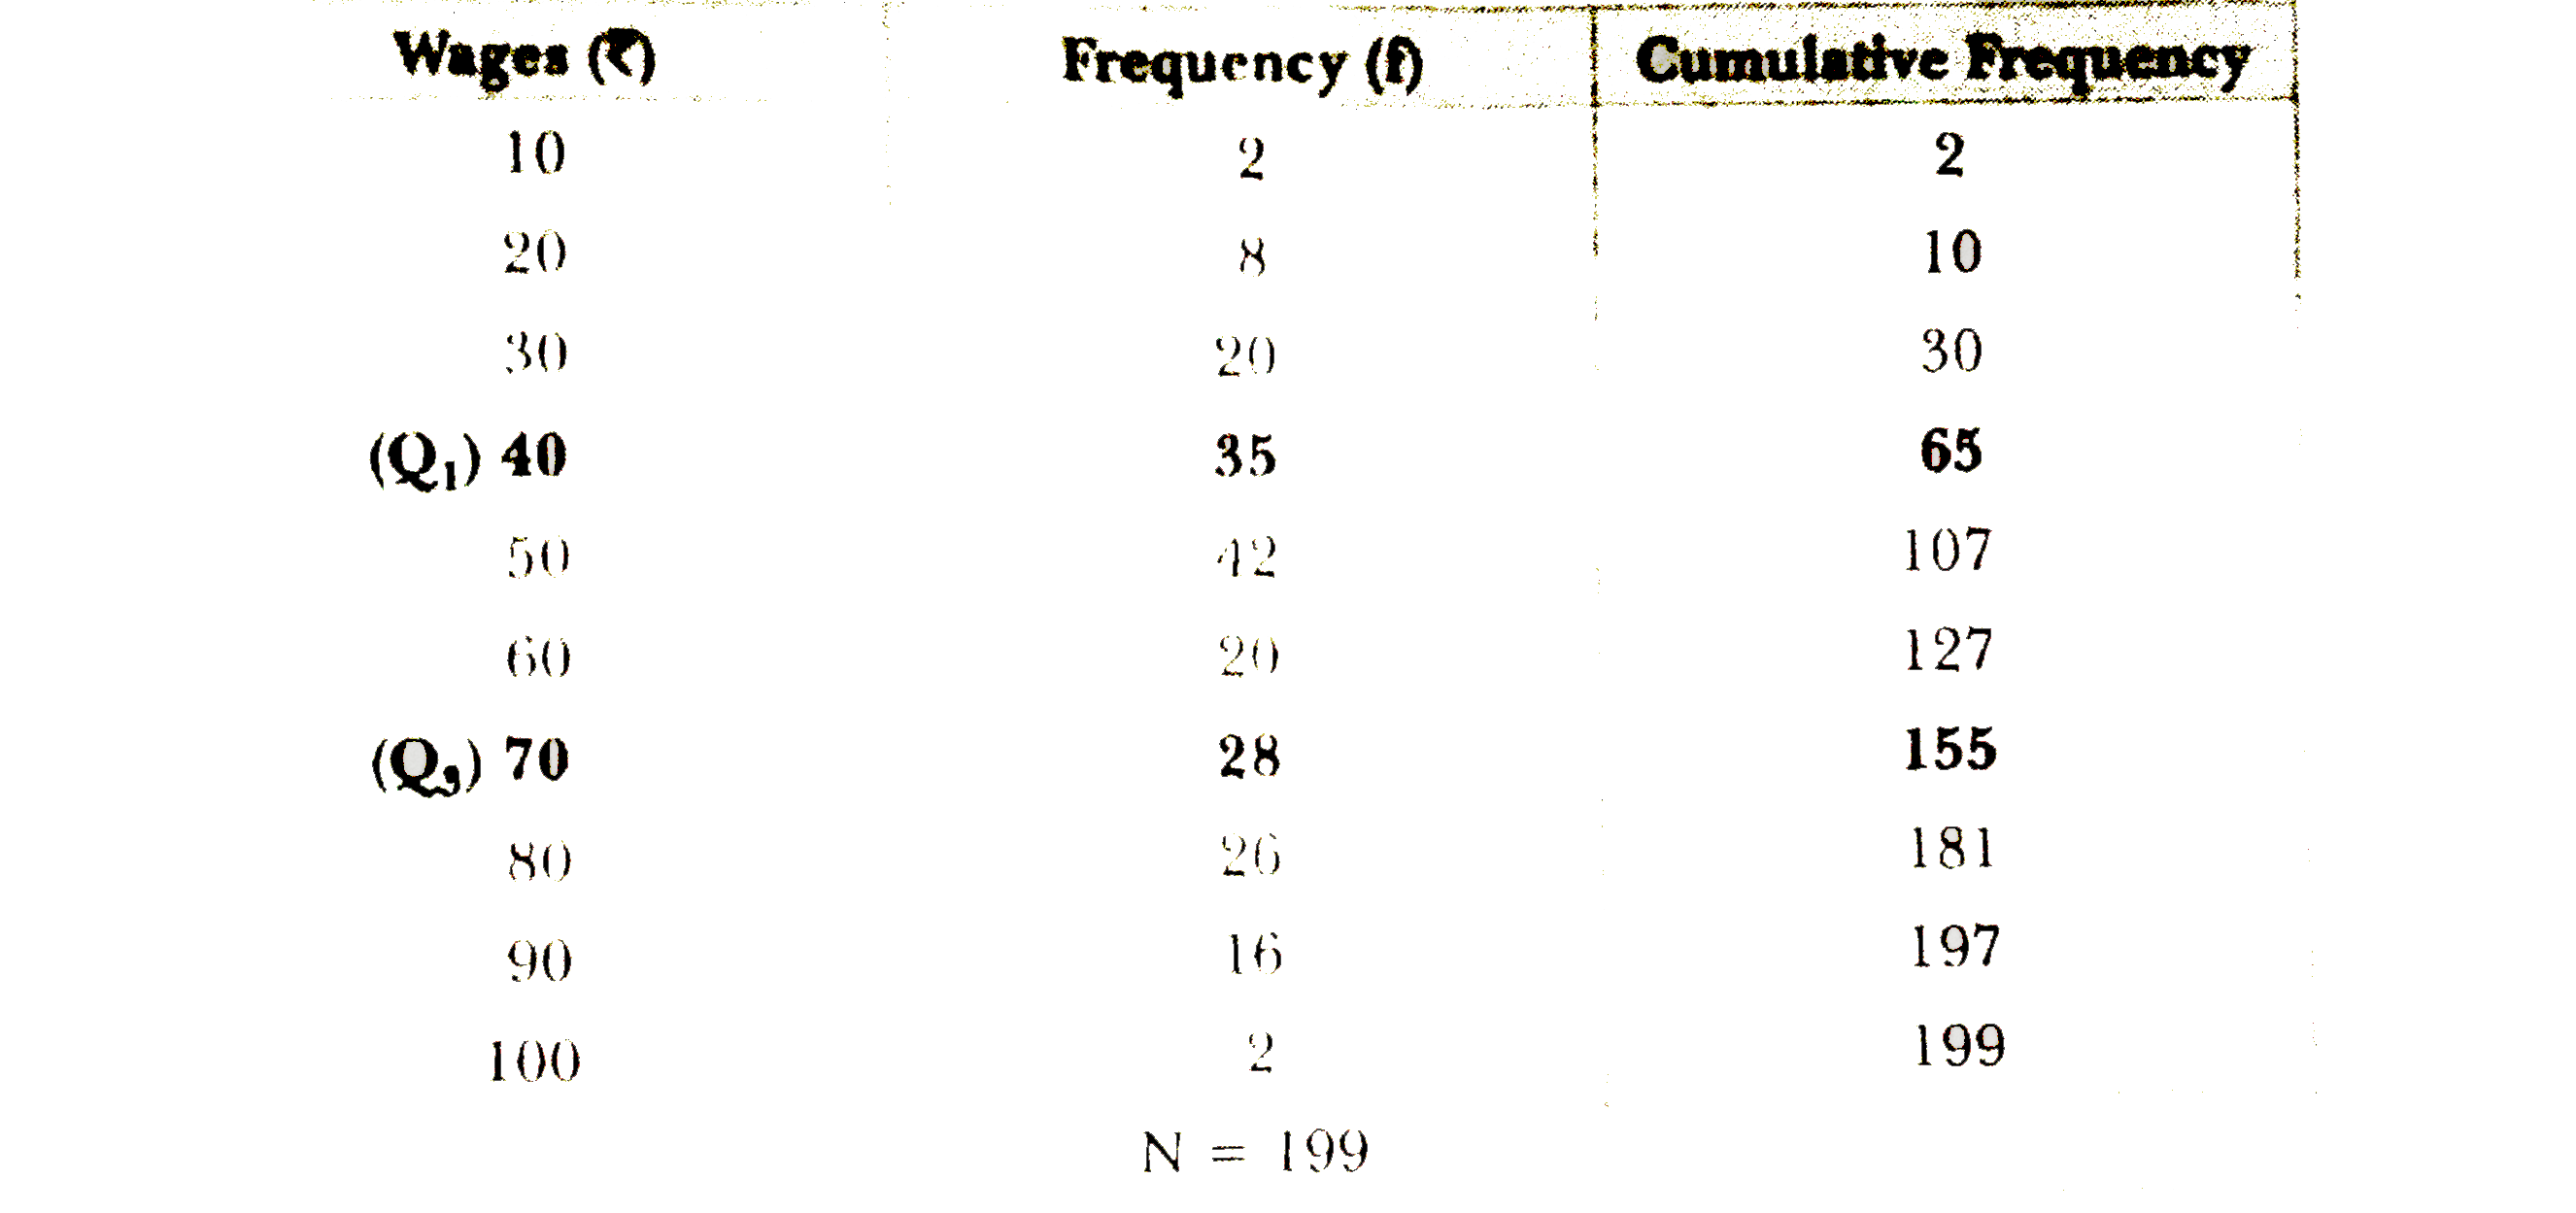
The following data shows daily wages of 199 workers of a factory. Find out quartile deviation and the coefficient of quartile deviation.

The above series is first converted into a cumulative frequency distribution series.

=Size of 150th item
50th item lies falls in 65th cumulative frequency of the series. Wage corresponding to 65th cumulative frequancy is which therefore is first quartile of the distribution. Likewise,
=Size of item =Size of 150th item
150th item falls in 155th cumulative frequency of the series. Wage corresponding to 155th cumulative frequency is which therefore is the third quartile of the series.
Quartile Deviation (QD)
Coefficient of QD
Topper's Solved these Questions
- MEASURES OF DISPERSIONBook:TARUN JAIN & VK OHRIChapter:MEASURES OF DISPERSIONExercise:Miscellaneous Illustrations
Explore 24 Videos
- MEASURES OF DISPERSIONBook:TARUN JAIN & VK OHRIChapter:MEASURES OF DISPERSIONExercise:EXERCISE
Explore 12 Videos
- MEASURES OF CENTRAL TENDENCY MEDIAN AND MODEBook:TARUN JAIN & VK OHRIChapter:MEASURES OF CENTRAL TENDENCY MEDIAN AND MODEExercise:NCERT Questions (With Hints to Answers)
Explore 5 Videos
- ORGANISATION OF DATABook:TARUN JAIN & VK OHRIChapter:ORGANISATION OF DATAExercise:EXERCISE NCERT
Explore 13 Videos
Similar Questions
Find out quartile deviation and the coefficient of quartile deviation of the following data:

View SolutionDefine quartile deviation.
View SolutionGiven the following data, find out quartile deviation and the coefficient of quartile deviation:

View SolutionThe data below gives wages of workers in a factory. Find out mean deviation and its coefficient.

View SolutionFind out quartile deviation and coefficient of quartile deviation from the following data:

View SolutionFind out mean deviation and its coefficient of the following data:

View SolutionGive the formula for coeficient of quartile deviation?
View SolutionMonthly wages of workers of a factory are stated below. Find out the range and the coefficient of range.

View SolutionFind out the quartile deviation and coefficient of quartile deviation of the following series:

View SolutionEstimate quartile deviation and the coefficient of quartile deviation of the following series:

View Solution

