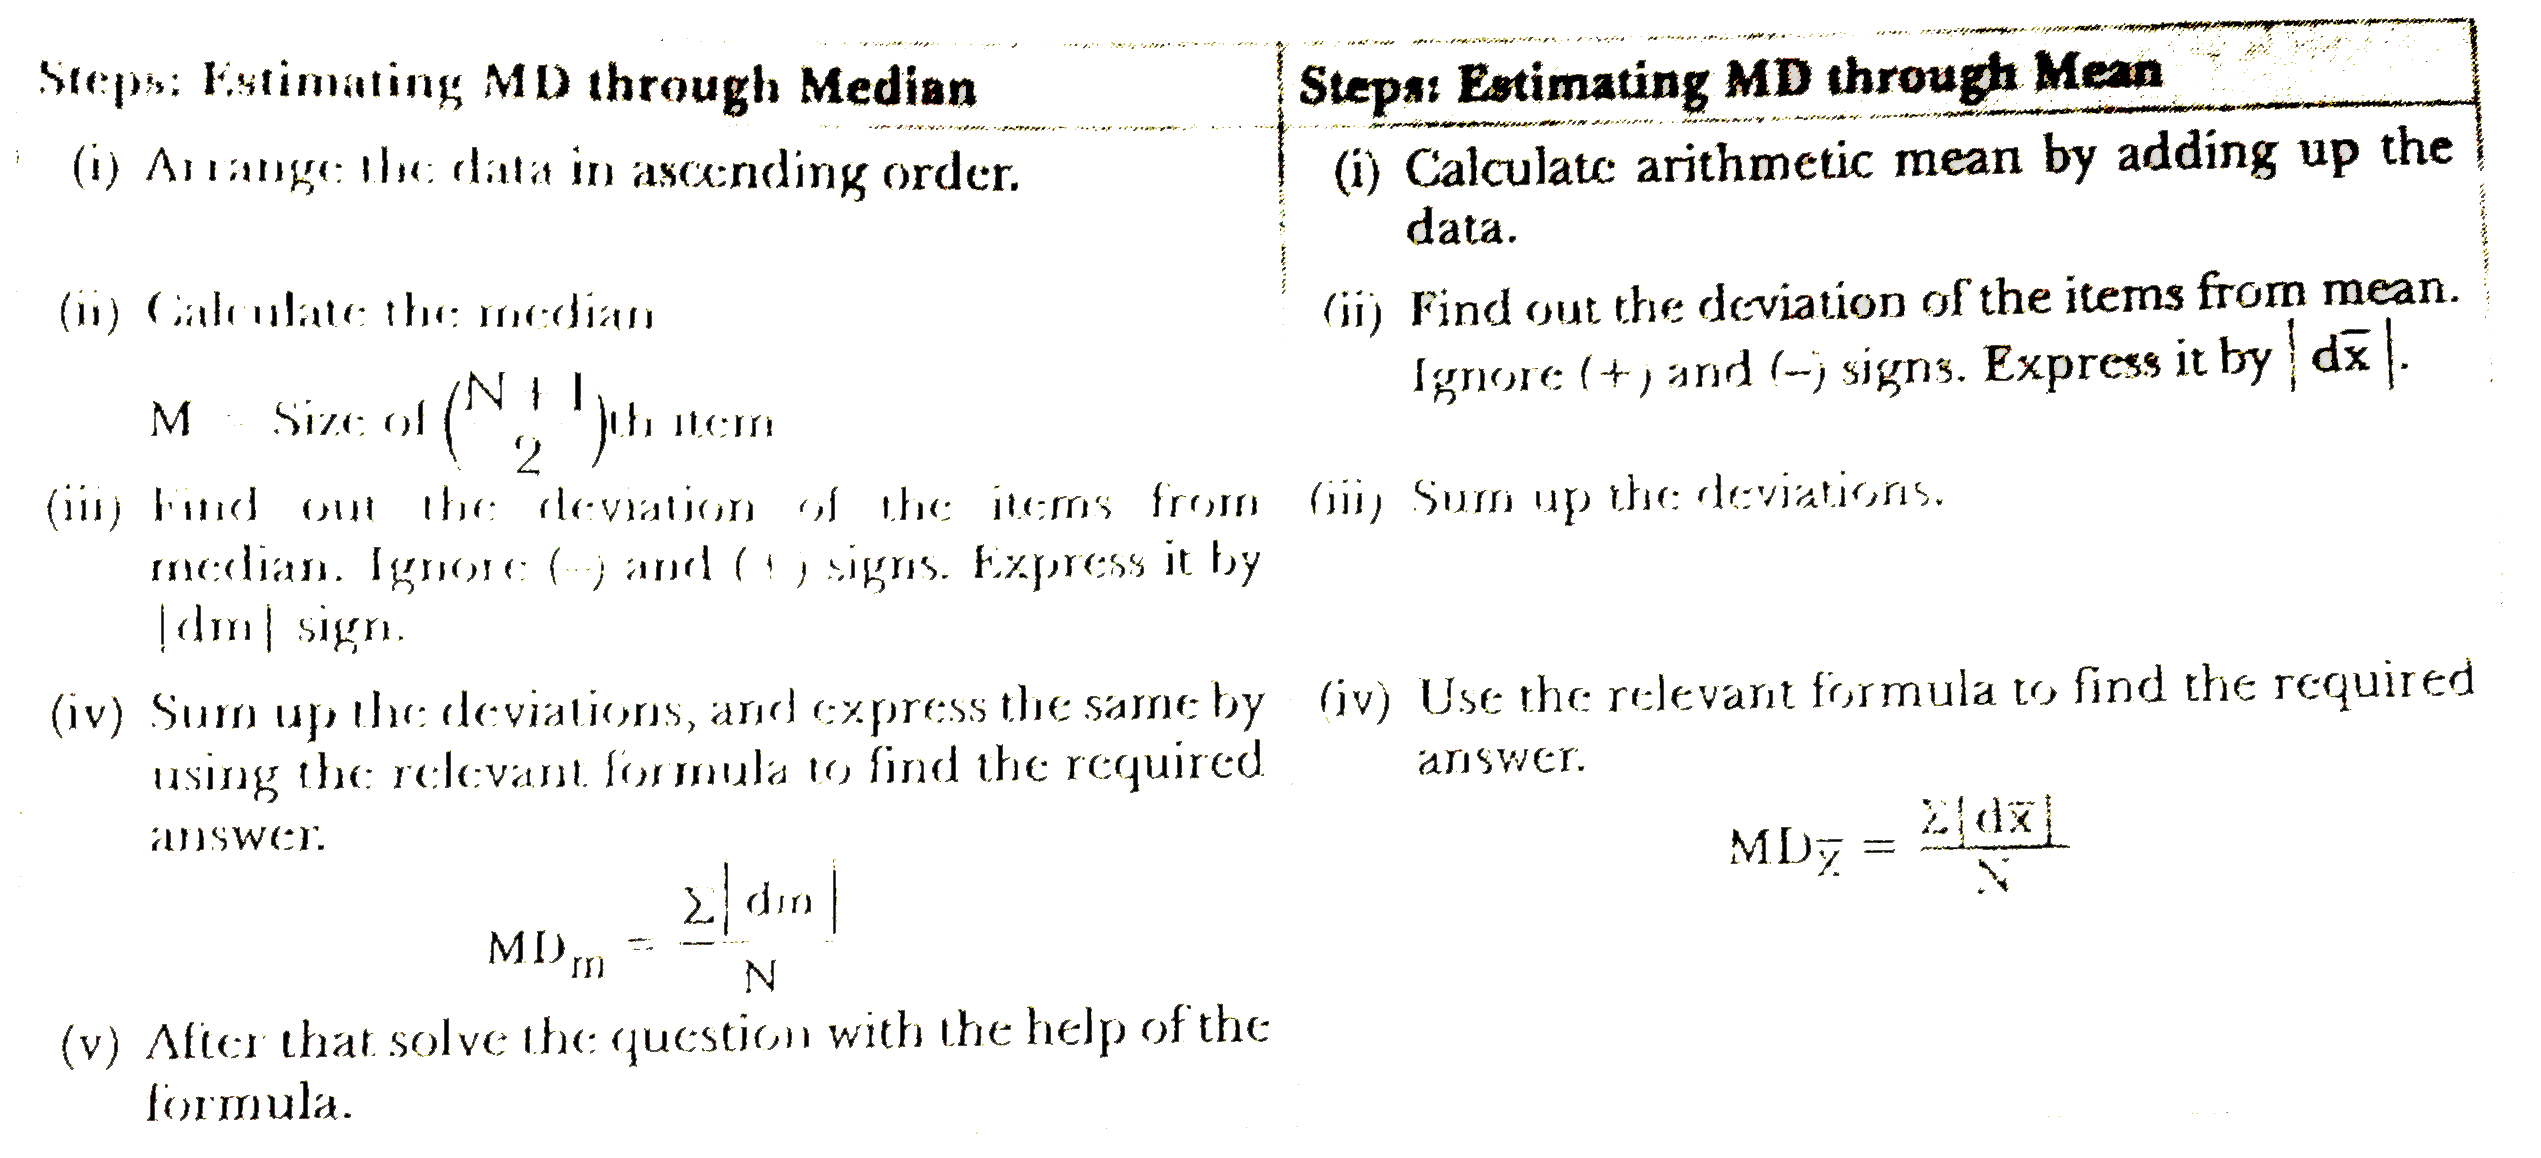
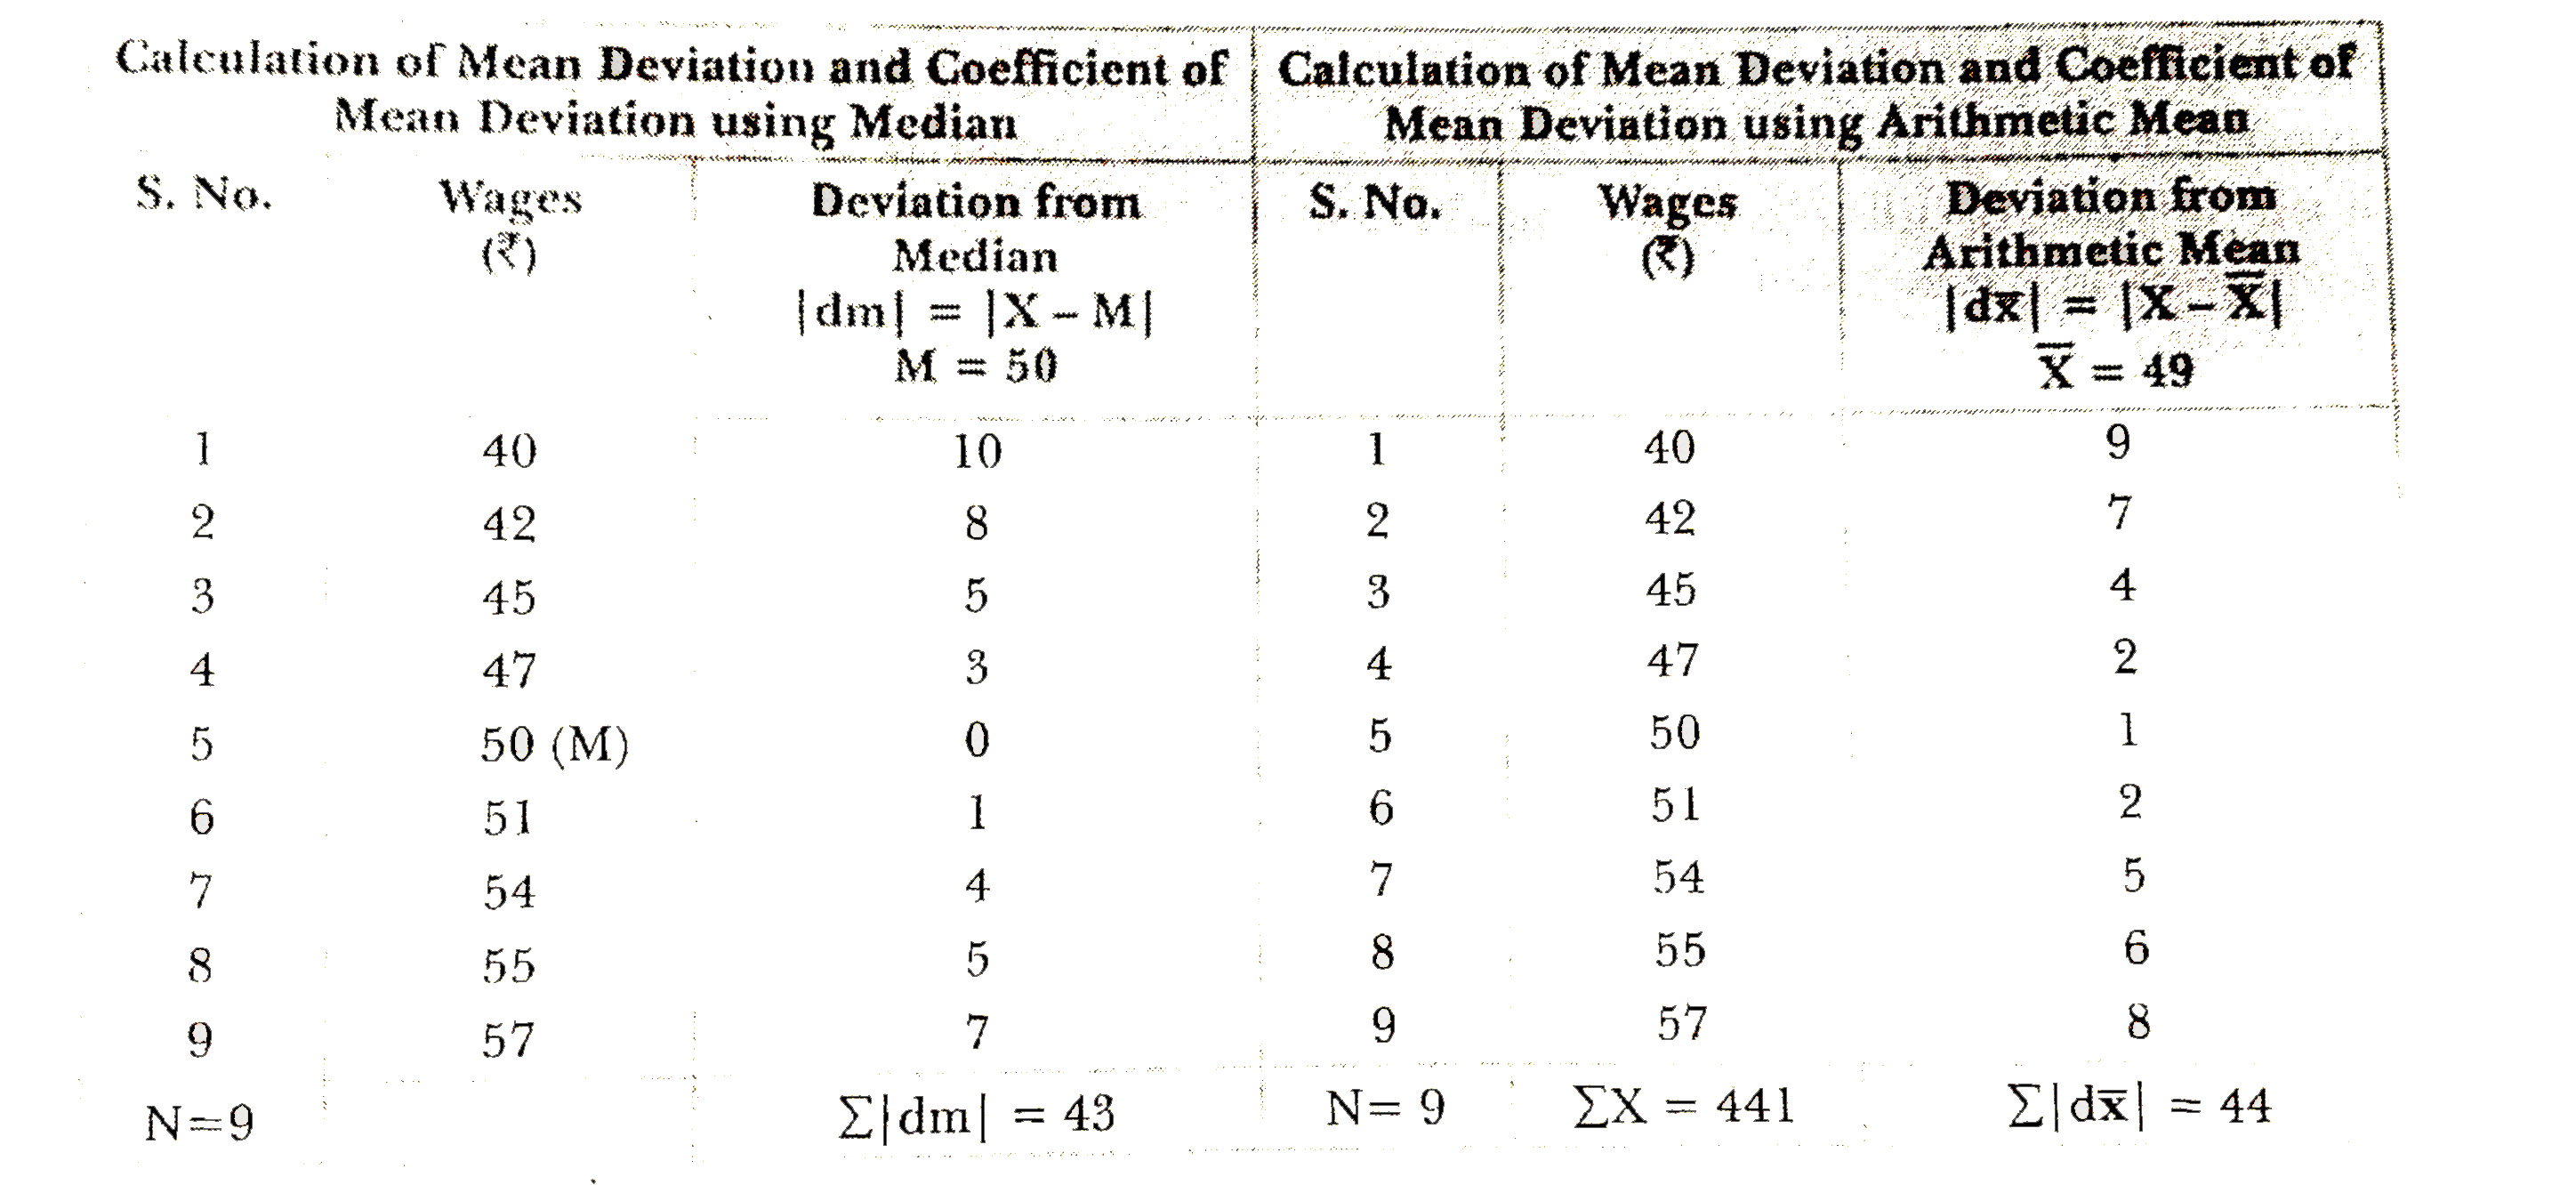
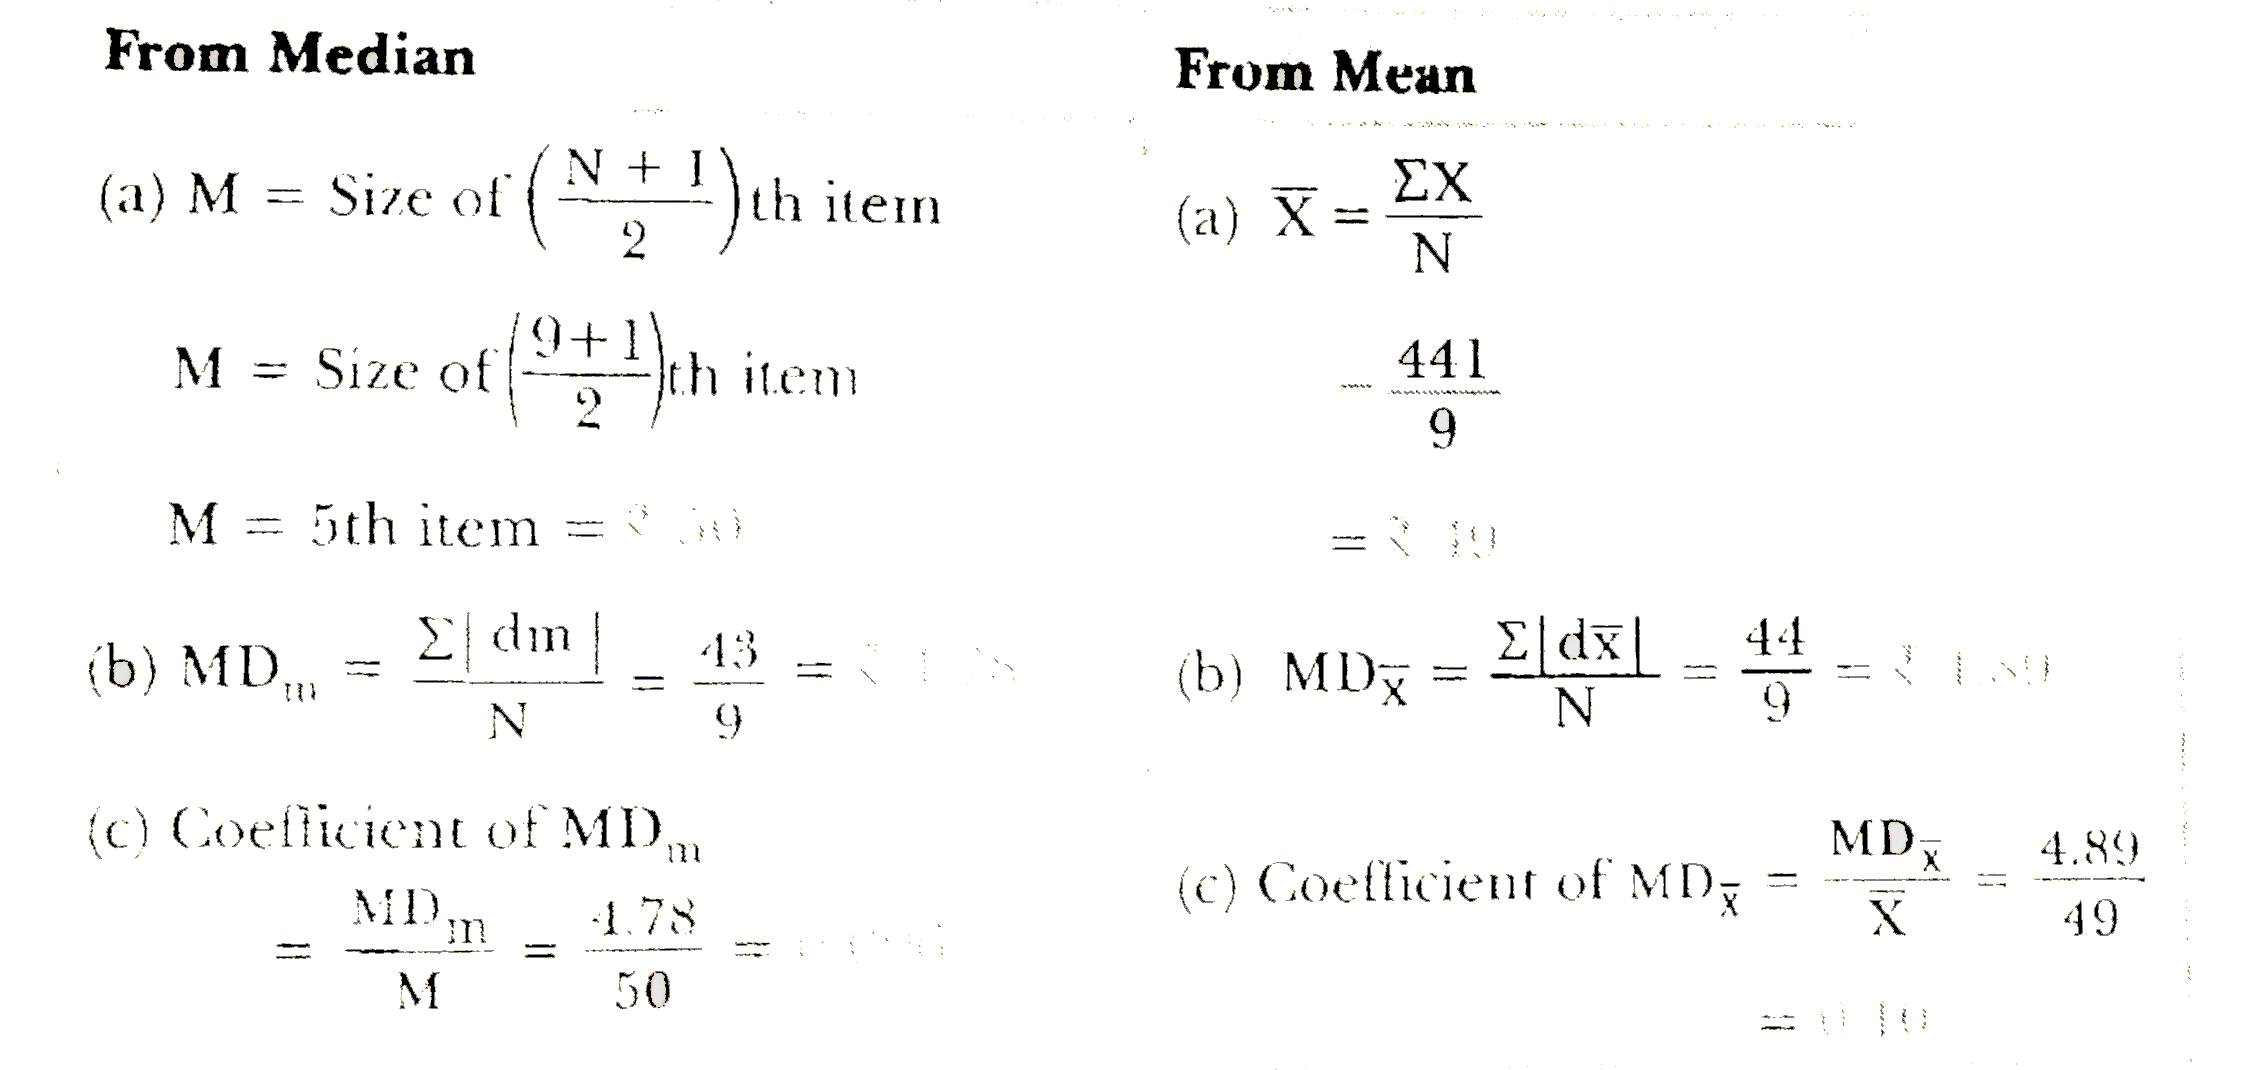
The data below gives wages of workers in a factory. Find out mean deviation and its coefficient.

Topper's Solved these Questions
- BOOK - TARUN JAIN & VK OHRICHAPTER - MEASURES OF DISPERSIONEXERCISE - Miscellaneous Illustrations24videos
MEASURES OF DISPERSION
- BOOK - TARUN JAIN & VK OHRICHAPTER - MEASURES OF DISPERSIONEXERCISE - EXERCISE12videos
MEASURES OF DISPERSION
- BOOK - TARUN JAIN & VK OHRICHAPTER - MEASURES OF CENTRAL TENDENCY MEDIAN AND MODEEXERCISE - NCERT Questions (With Hints to Answers)5videos
MEASURES OF CENTRAL TENDENCY MEDIAN AND MODE
- BOOK - TARUN JAIN & VK OHRICHAPTER - ORGANISATION OF DATAEXERCISE - EXERCISE NCERT13videos
ORGANISATION OF DATA
Similar Questions
Find out mean deviation and its coefficient of the following data:
 View Solution
The following data shows daily wages of 199 workers of a factory. Find out quartile deviation and the coefficient of quartile deviation.
 View Solution
Monthly wages of workers of a factory are stated below. Find out the range and the coefficient of range.
 View Solution
Consider the following distribution of daily wages of 50 workers of a factory.

Find the mean daily wages of the workers of factory by using an appropriate method.View SolutionThe following table gives the weekly wage of workers in a factory:

Find the (i) mean (ii) modal class (iii) the mode.View SolutionConsider the following distribution of daily wages of 50 workers of a factory.Find the mean daily wages of the workers of the factor}- by using an appropriate method.
 View Solution
The following table shows the weights of 12 workers in a factory :

find the mean weight of the workers.View SolutionGiven below are the marks obtained by the students of a class. Calculate mean deviation, and its coefficient, median of data:
 View Solution
Find the mean of daily wages of 40 workers in a factory as per data given below:
 View Solution
Given the following data, find out quartile deviation and the coefficient of quartile deviation:
 View Solution


