Study the chart carefully and answer the questions
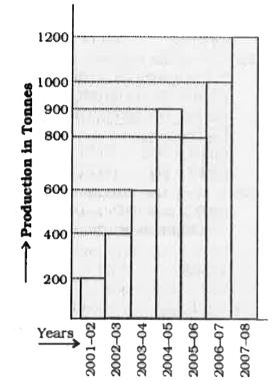
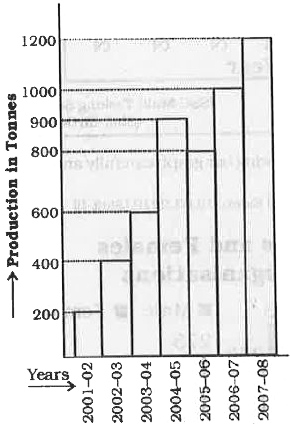
The chart shows production of an item (in tonnes) during certain years .
The production in 2006-2007 in comparison to the production in 2002-03 increased by
150%
110%
120%
125%
The correct Answer is:A
Step by step video, text & image solution for Study the chart carefully and answer the questions The chart shows production of an item (in tonnes) during certain years . The production in 2006-2007 in comparison to the production in 2002-03 increased by by Maths experts to help you in doubts & scoring excellent marks in Class 14 exams.
Updated on:21/07/2023Similar Questions
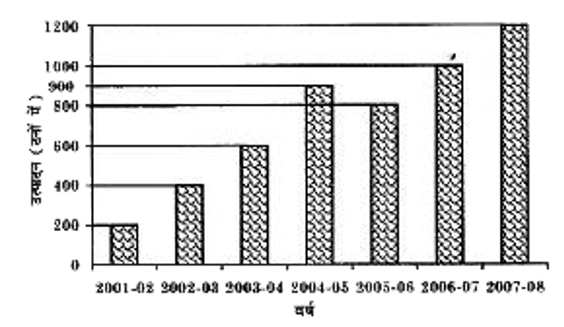
Study the chart carefully and answer the questions.
The chart shows production of an item (in tones) during certain years.
The production in 2006-07 in comparison to the production in 2002-03 increased by.
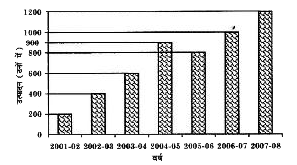
निम्न आरेख का ध्यानपूर्वक अध्ययन कर दिए गए प्रश्नों के उत्तर दें:
आरेख किसी वर्ष के दौरान एक मद का उत्पादन (टनों में) दर्शाता है।
वर्ष 2002-03 की तुलना में 2006-07 में उत्पादन में वृद्धि हुई -
View SolutionStudy the chart carefully and answer the questions.
The chart shows production of an item (in tones) during certain years.
The production from 2003-04 to 2007-08 increased by.
-
View Solution
Knowledge Check
Study the graph carefully and answer the questions.
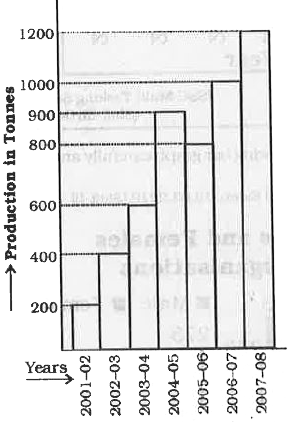
The graph shows production of an item (in tonnes) during certain years
The production in 2006-07 in comparison to the production in 2002-03 increased byA150%B110%C120%D125%Study the chart carefully and answer the questions
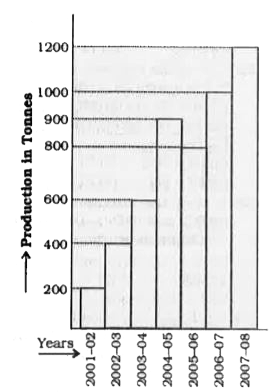
The chart shows production of an item (in tonnes) during certain years .
The production from 2003-04 to 2007-08 increased byA125%B50%C75%D100%Study the chart carefully and answer the questions
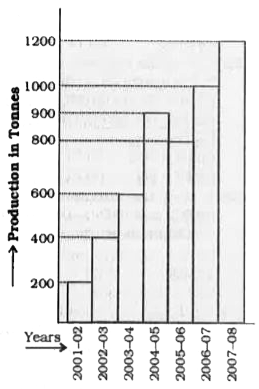
The chart shows production of an item (in tonnes) during certain years .
The production decreased from 2004-05 to 2205-06 byA1119%B819%C919%D1019%
Study the chart carefully and answer the questions.
The chart shows production of an item (in tones) during certain years.
The production decreased from 2004-05 to 2005 - 06 by
निम्न आरेख का ध्यानपूर्वक अध्ययन कर दिए गए प्रश्नों के उत्तर दें:
आरेख किसी वर्ष के दौरान एक मद का उत्पादन (टनों में) दर्शाता है।
वर्ष 2004-05 से 2005-06 में उत्पादन में कितनी कमी हुई ?
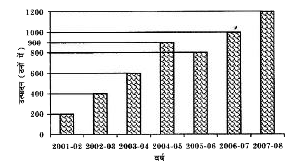
View SolutionStudy the graph carefully and answer the questions.
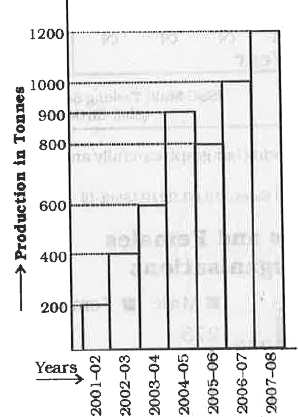
The graph shows production of an item (in tonnes) during certain years
The production from 2003-04 to 2007-08 increased by
View SolutionStudy the graph carefully and answer the questions.
The graph shows production of an item (in tonnes) during certain years
The production decreased from 2004-05 to 2005-06 by
View SolutionStudy the chart carefully and answer the questions
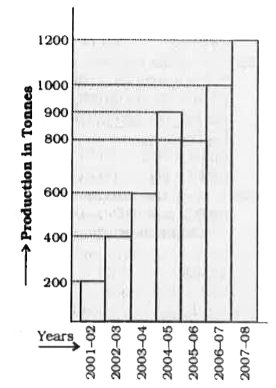
The chart shows production of an item (in tonnes) during certain years .
The year in which production increased the lowest as compared to the previous year is
View SolutionStudy the graph carefully and answer the questions.
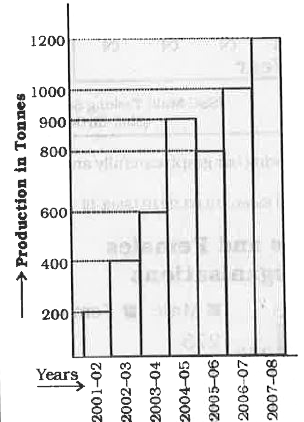
The graph shows production of an item (in tonnes) during certain years
The year in which productions increased the lowest as compared to the previous year is
View Solution
