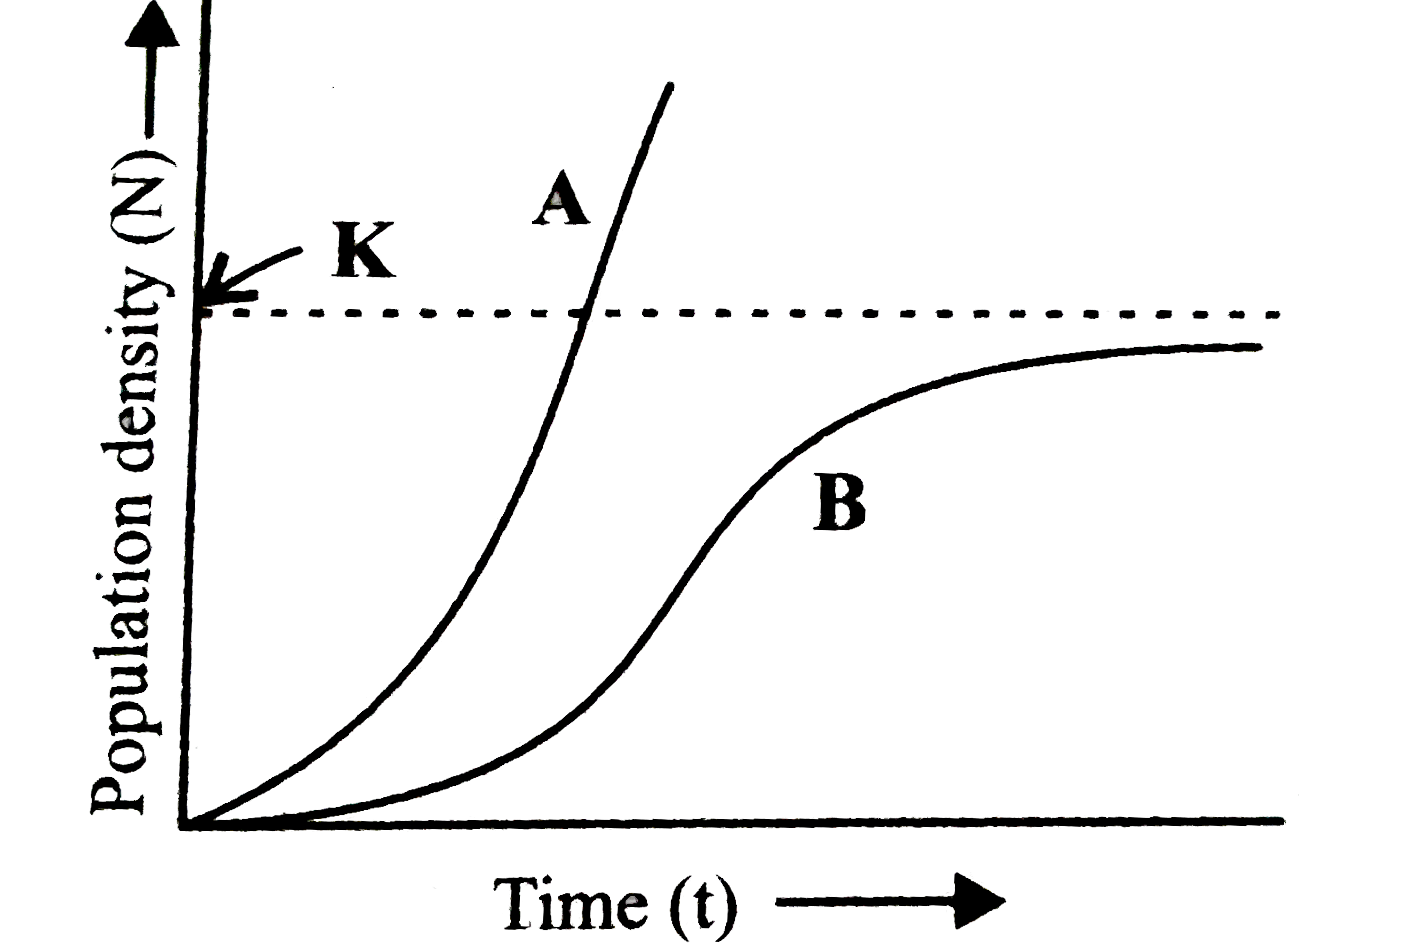
Population growth curve is sigmoid, if the growth pattern is
Logistic
Geometric
Exponential
Accretionary
The correct Answer is:A
Step by step video, text & image solution for Population growth curve is sigmoid, if the growth pattern is by Biology experts to help you in doubts & scoring excellent marks in Class 12 exams.
Updated on:21/07/2023Topper's Solved these Questions
- ORGANISMS AND POPULATIONS Book:MODERN PUBLICATIONChapter:ORGANISMS AND POPULATIONS Exercise:COMPETITION FILE (OBJECTIVE TYPE QUESTIONS)(B. MATCHING TYPE QUESTIONS: )
Explore 4 Videos
- ORGANISMS AND POPULATIONS Book:MODERN PUBLICATIONChapter:ORGANISMS AND POPULATIONS Exercise:COMPETITION FILE (OBJECTIVE TYPE QUESTIONS)(C. ASSERTION - REASON TYPE QUESTIONS: )
Explore 10 Videos
- ORGANISMS AND POPULATIONS Book:MODERN PUBLICATIONChapter:ORGANISMS AND POPULATIONS Exercise:REVISION EXERCISES (VI. LONG ANSWER TYPE QUESTIONS)(B. QUESTIONS FROM CBSE EXAMINATIONS)
Explore 8 Videos
- MOLECULAR BASIS OF INHERITANCE Book:MODERN PUBLICATIONChapter:MOLECULAR BASIS OF INHERITANCE Exercise:CHAPTER PRACTICE TEST (Section - E)
Explore 1 Video
- PRINCIPLES OF INHERITANCE AND VARIATIONBook:MODERN PUBLICATIONChapter:PRINCIPLES OF INHERITANCE AND VARIATIONExercise:CHAPTER PRACTICE TEST section-e(Long answer type question)
Explore 1 Video
Similar Questions
Knowledge Check
In the logistic population growth curve shown below, the rate of growth is greatest at which point?
 A1B2C3D4
Human population growth is:
AlagBstationaryCexponentialDnone of theseIn sigmoid populations growth curve, the initial stage of the curve is called :
APlateauBLag pahseCLog phaseDExponential phase
Study the population growth curves (A and B) in the given graph and select the incorrect option.

View SolutionRead the following text and answer the following question on the basis of the same :
Growth of population with time shows specific and predictable patters. Two types of growth patter of populaiton are exponetial and logistic growth . When resource in the habitat are unlimited each species has the ability to relize fully its innate potential to grow in number . Then the population gorws in exponential fashion . When the resource are limited growth curve shows an inital slow rate and then it accelerates and finally slows giving the gorwth curve which is sigmoid .
Study the population growth curves (A and B) in the given graph and select the incorrect statement :

View Solution
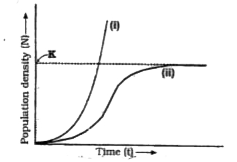
Study the population growth curves shown in the above diagram.
Which options is the best for curve (i) and (ii).
View SolutionThe population growth rate in India is :
View SolutionPopulation growth curve in most animals , except humans, is
View Solution

