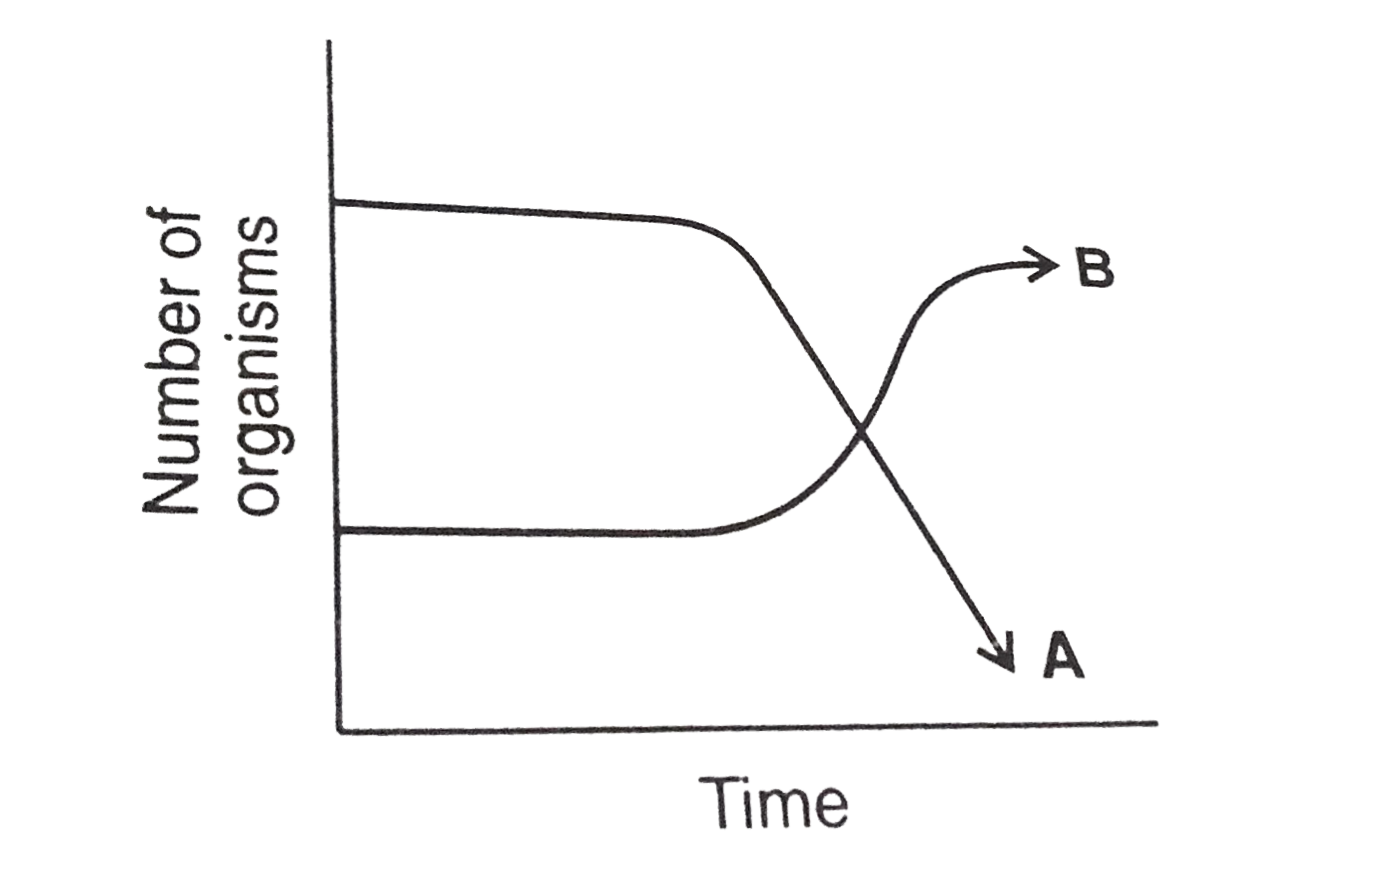
The following graph depicts changes in two populations (A and B) of herbivores in a grassy field. A possible reason for these changes is that :
Both plant populations in this habitat decreased
Population B competed more successfully for food than population A
Population A produced more offsprings than population B
Population A consumed the members of population B
The correct Answer is:B
Step by step video, text & image solution for The following graph depicts changes in two populations (A and B) of herbivores in a grassy field. A possible reason for these changes is that : by Biology experts to help you in doubts & scoring excellent marks in Class 12 exams.
Updated on:21/07/2023Topper's Solved these Questions
- ORGANISMS AND POPULATIONS Book:MODERN PUBLICATIONChapter:ORGANISMS AND POPULATIONS Exercise:COMPETITION FILE (OBJECTIVE TYPE QUESTIONS)(B. MATCHING TYPE QUESTIONS: )
Explore 4 Videos
- ORGANISMS AND POPULATIONS Book:MODERN PUBLICATIONChapter:ORGANISMS AND POPULATIONS Exercise:COMPETITION FILE (OBJECTIVE TYPE QUESTIONS)(C. ASSERTION - REASON TYPE QUESTIONS: )
Explore 10 Videos
- ORGANISMS AND POPULATIONS Book:MODERN PUBLICATIONChapter:ORGANISMS AND POPULATIONS Exercise:REVISION EXERCISES (VI. LONG ANSWER TYPE QUESTIONS)(B. QUESTIONS FROM CBSE EXAMINATIONS)
Explore 8 Videos
- MOLECULAR BASIS OF INHERITANCE Book:MODERN PUBLICATIONChapter:MOLECULAR BASIS OF INHERITANCE Exercise:CHAPTER PRACTICE TEST (Section - E)
Explore 1 Video
- PRINCIPLES OF INHERITANCE AND VARIATIONBook:MODERN PUBLICATIONChapter:PRINCIPLES OF INHERITANCE AND VARIATIONExercise:CHAPTER PRACTICE TEST section-e(Long answer type question)
Explore 1 Video
Similar Questions
Knowledge Check
Changing population is -
APopulation growthBPopulation dynamicsCPopulation explosionDPopulation ethologyWhich of the following graphs best depicts the changes in one cycle of PCR ?
A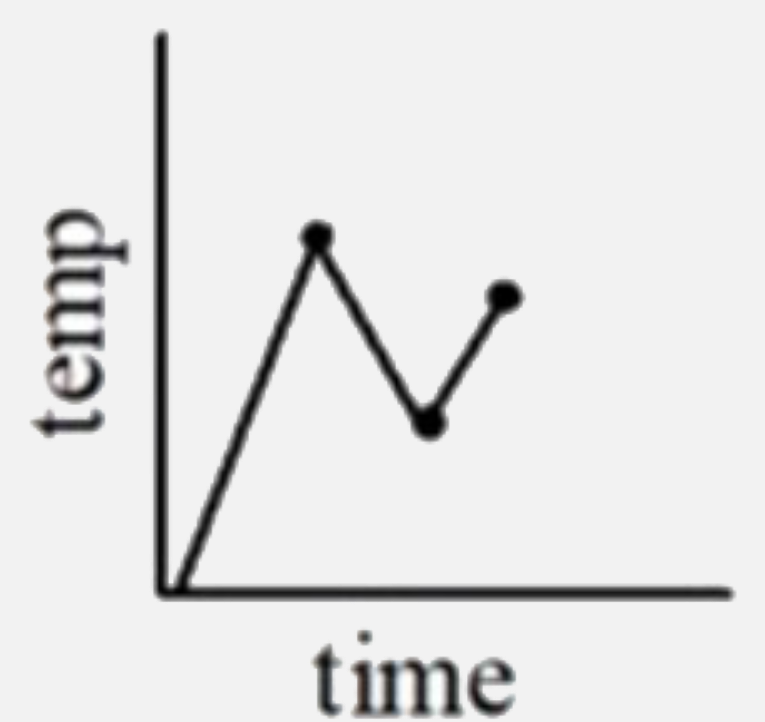 B
B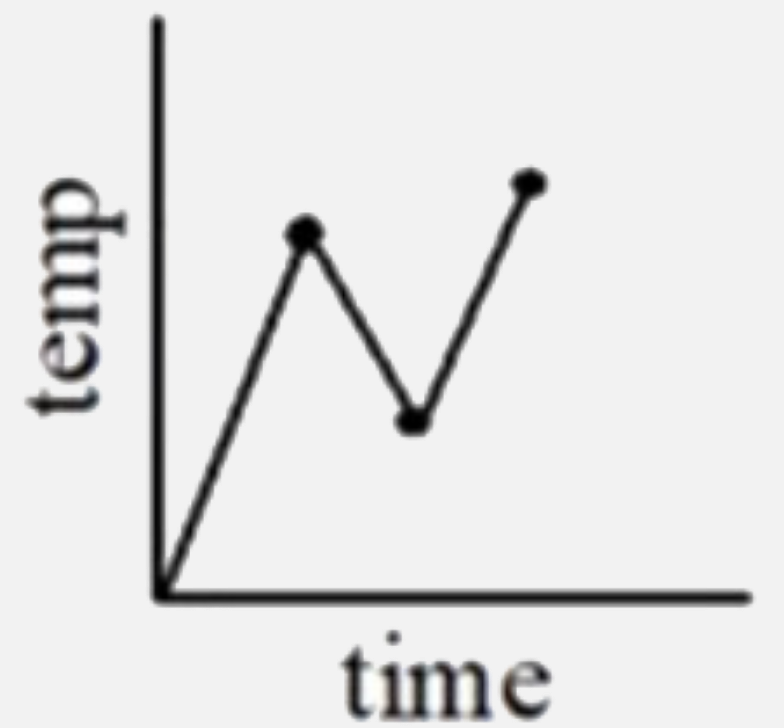 C
C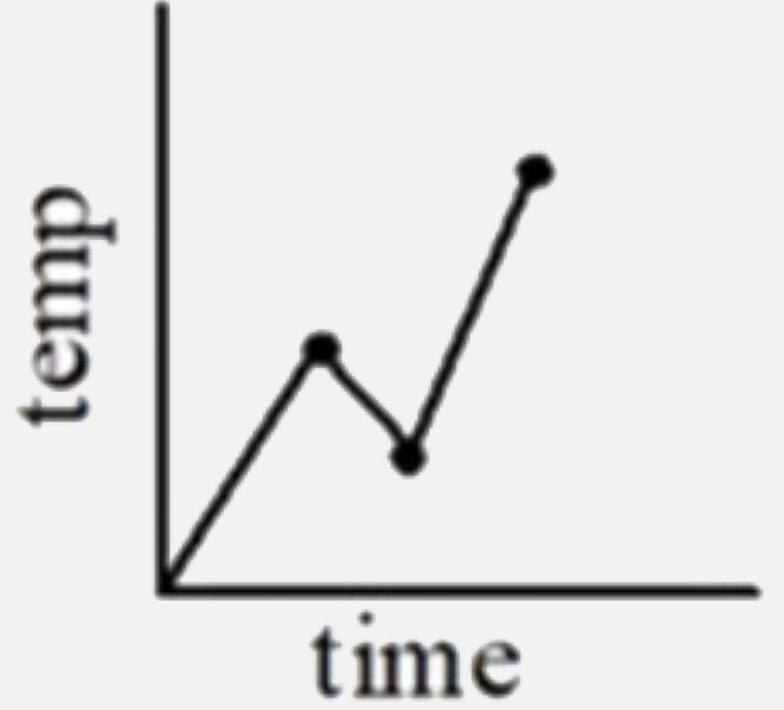 D
D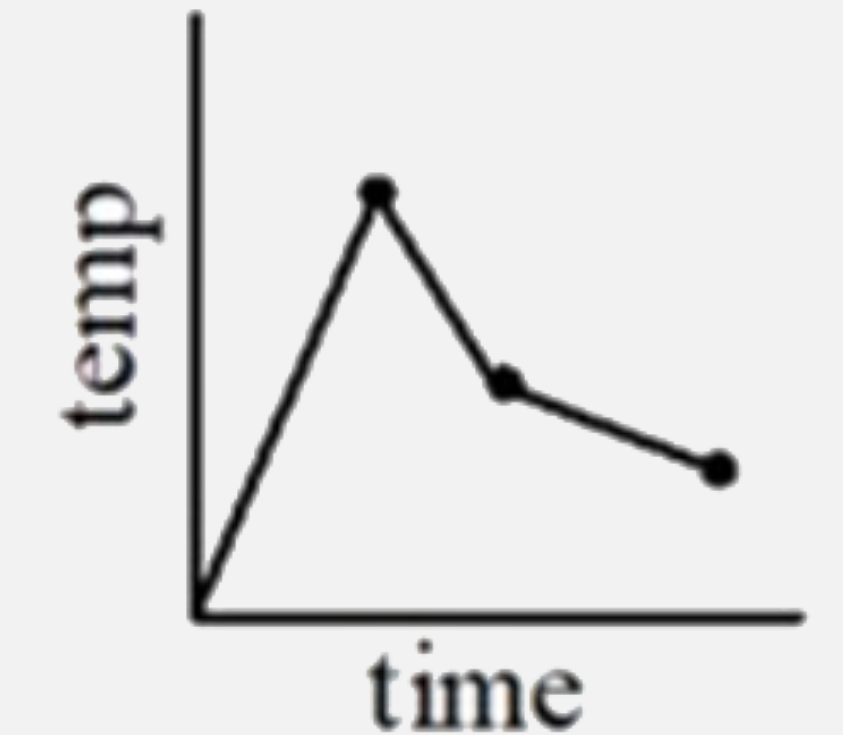
The accompanying figure depicts a change in concentration of species A and B for the reaction A→B, as a function of time. The point of inter section of the two curves represents
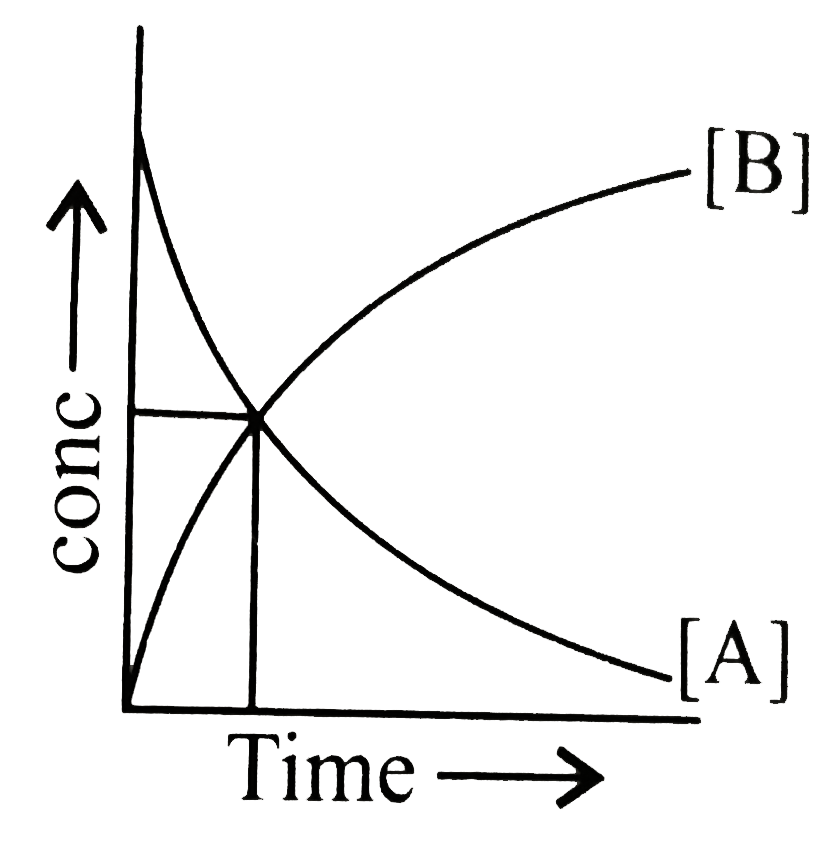 At1/2Bt3/4Ct2/3DData insufficient to predict
The following graph represents enzyme activity with changing

View SolutionGive the determinants of population change?
View SolutionHow is migration a determinant of population change?
View SolutionGive the formula for the change in population size .
View SolutionThe accompanying figure depicts a change in concentration of species A and B for the reaction A→B, as a function of time. The point of inter section of the two curves represents

View Solution


