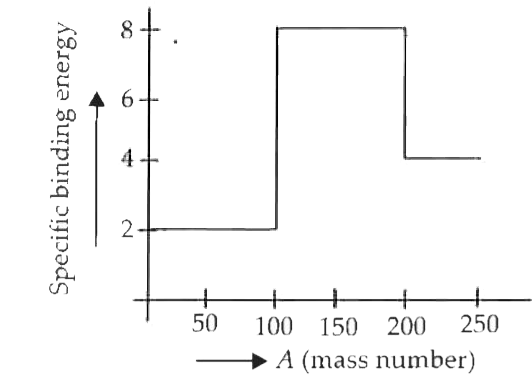
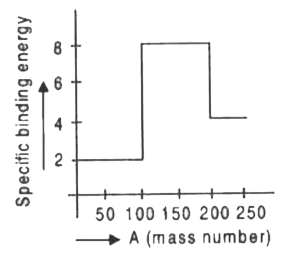
Assume the graph of specific binding energy versus mass number is as shown in the figure. Using this graph, select the correct choice from the following :
 Solution in Kannada
Fusion of two nuclei of mass number lying in the range of 100<A<200 will release energy
Fusion of two nuclei of mass number lying in the range of 51<A<100 will release energy.
Fusion of two nuclei of mass number lying in the range of 1<A<150 will release energy.
Fission of the nucleus of mass number lying in the range of 100<A<200 will release energy when broken into two fragments.
The correct Answer is:B
When two nuclei of mass number lying in the range of 51<A<100 combined then a nuccleus is formed in the range of 102<A<151 which has high value of specific binnding energy.
Topper's Solved these Questions
Similar Questions
In ruby laser, the stimulated emission is due to transition from
View SolutionWhich of the following graphs correctly represents the variation of heat energy (U) produced in a metallic conductor in a given time as a function of potential difference (V) across the conductor ?
View SolutionAssume that the nucles binding energy per nucleus(B/A) versus mass number (A) is as shown in the figure Use this plate to choose the energy the correct (s) given below
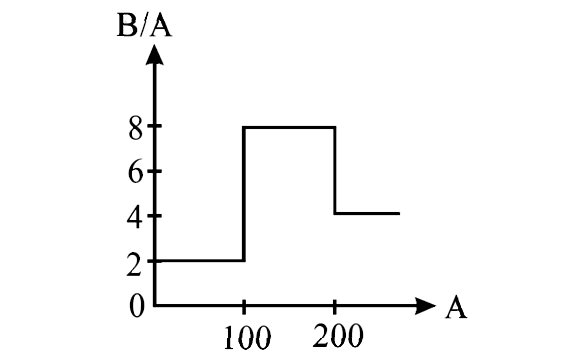
View SolutionAssume that the nuclear binding energy per uncleon (B/A) versus mass number (A) is as shwon in Fig. Use this plot to choose the correct choice (s) given below:
View SolutionFrom the graph of binding energy (B.E.) usmass number plotted as shown, identify the correct option (s). (All the graphs are straight line)
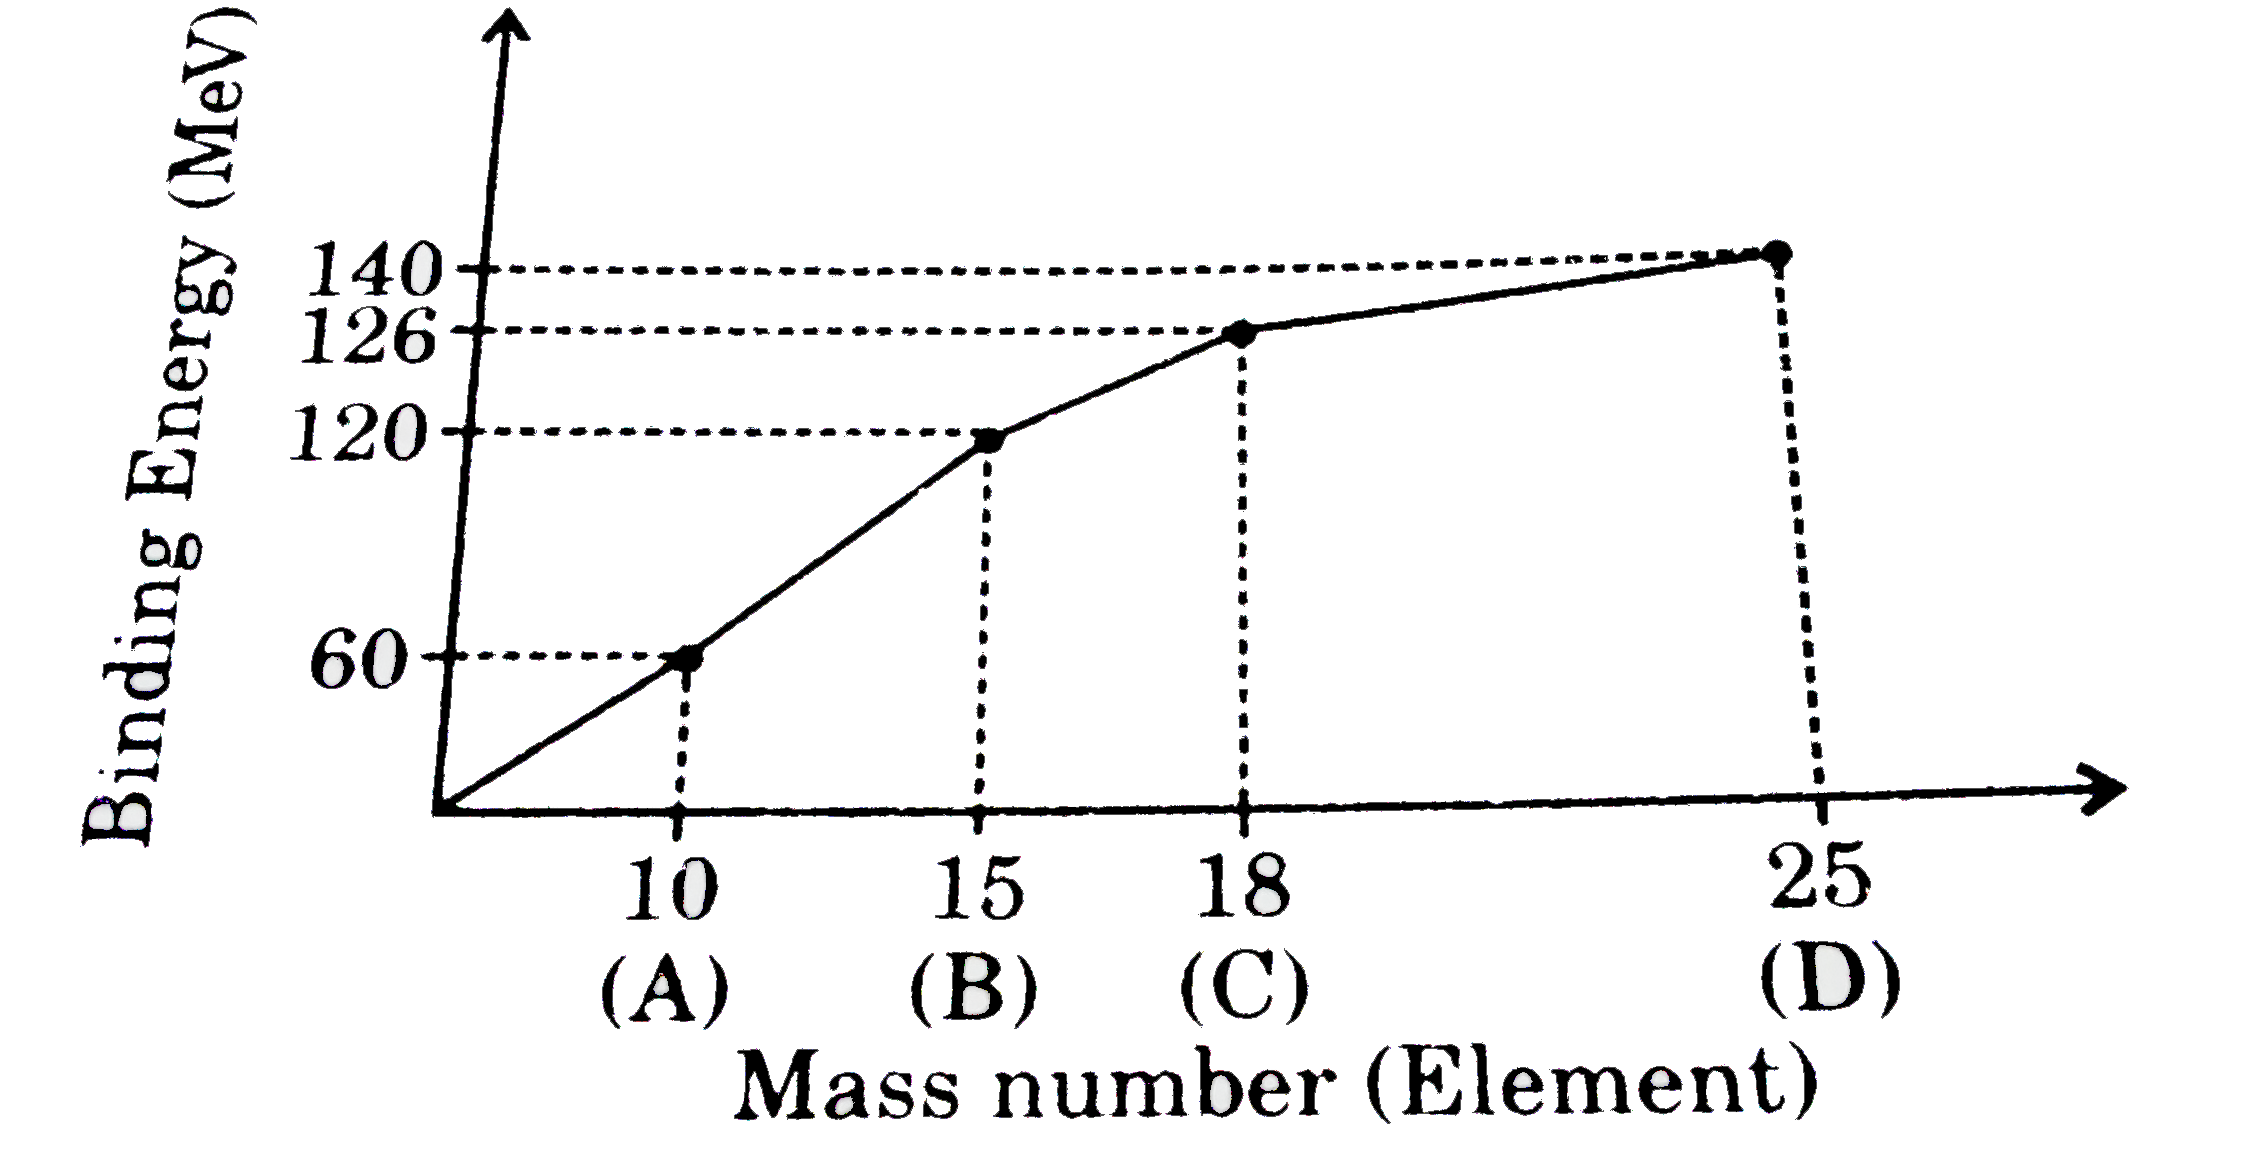
View SolutionFrom the graph of binding energy (B.E.)vs mass number plotted as shown , identify the correct option (s)
View SolutionAssume that the nuclear binding energy per nucleon (B/A) versus mass number (A) is as shown in the figure. Use this plot to choose the correct choice(s) given below. Figure
View SolutionThe graph in figure shows the velocity v versus time t for a body. Which of the graphs shown in figure represents the correesponding acceleration versus time graphs ?
View SolutionVARIATION OF BINDING ENERGY OF PER NUCLEON WITH MASS NUMBER
View SolutionAssume that the nuclear binding energy per nucleon (BIA) versus mass number (A) is as shown in the figure. Use this plot to choose the correct choice(s) given below:
View SolutionAssume the graph of sepecific binding energy versus mass number is as shown in the figure. Using this graph, select the correct choice from the following.
View Solutionमान लें कि न्यूक्लिऑन नाभिकीय बंधन ऊर्जा B/A का द्रव्यमान संख्या A के साथ ग्राफ चित्र में दिखाया अनुसार है |
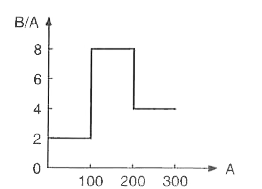
इस ग्राफ़ का प्रयोग करते हुए नीचे दिए गए विकल्प (विकल्पों) को चुने :
View SolutionDraw the graph showing variation of binding energy per nucleon with mass number. Write the inferences drawn from the graph.
View Solutionमान ले कि नाभिकीय बंधन-ऊर्जा प्रति न्यूक्लियान (B/A) बनाम द्रव्यमान संख्या (A) नीचे दर्शाये चित्र के अनुसार है। इस ग्राफ का उपयोग करते हुये सही उत्तरों का चुनाव करें।
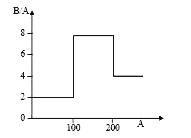
View SolutionAssume that the nuclear binding energy per nucleus(B/A) versus mass number (A) is as shown in the figure Use this plot to choose the correct (s) choice given below

View Solution
