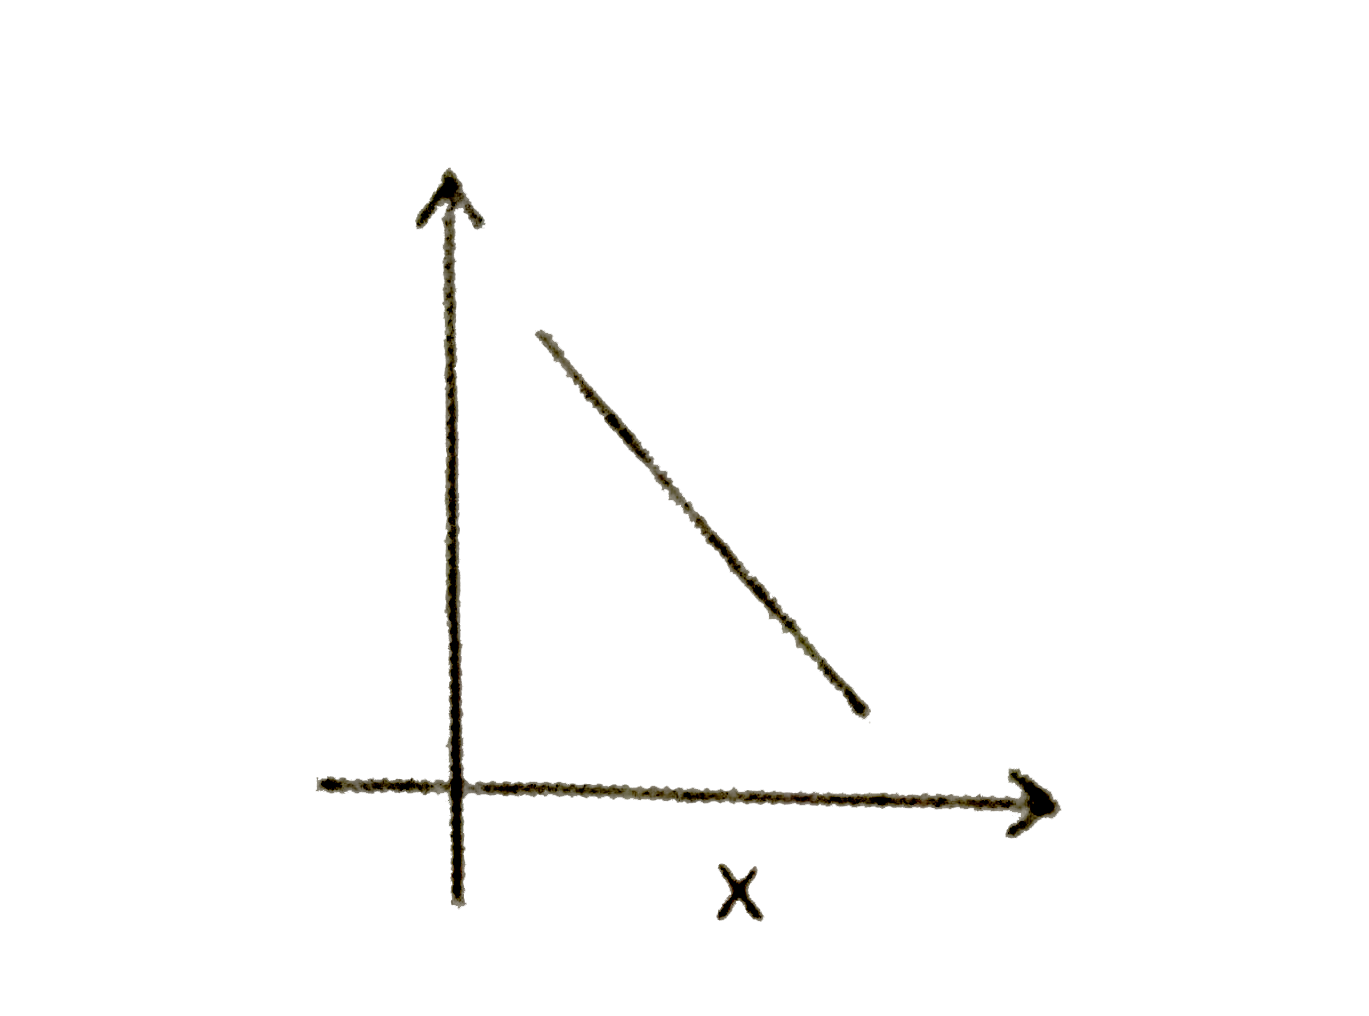
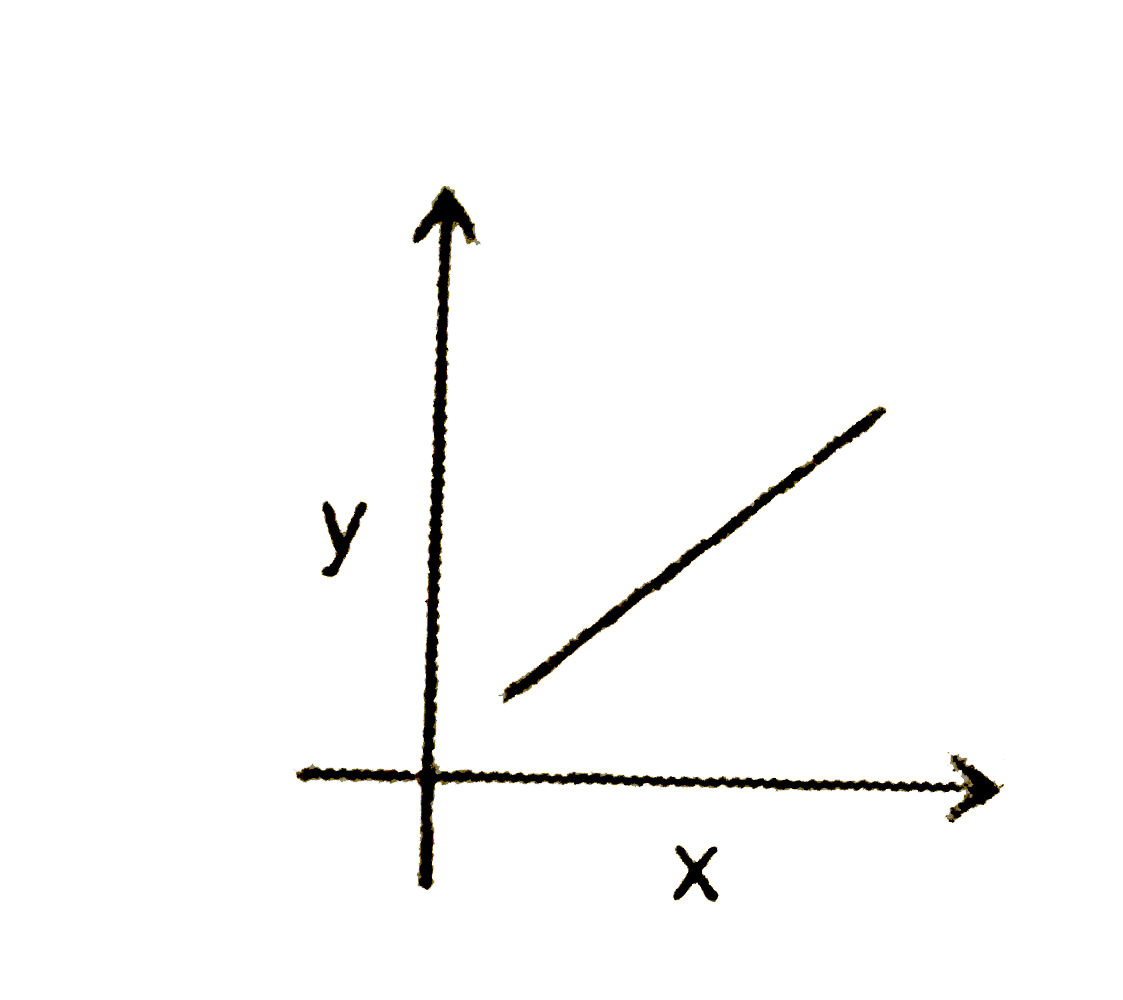
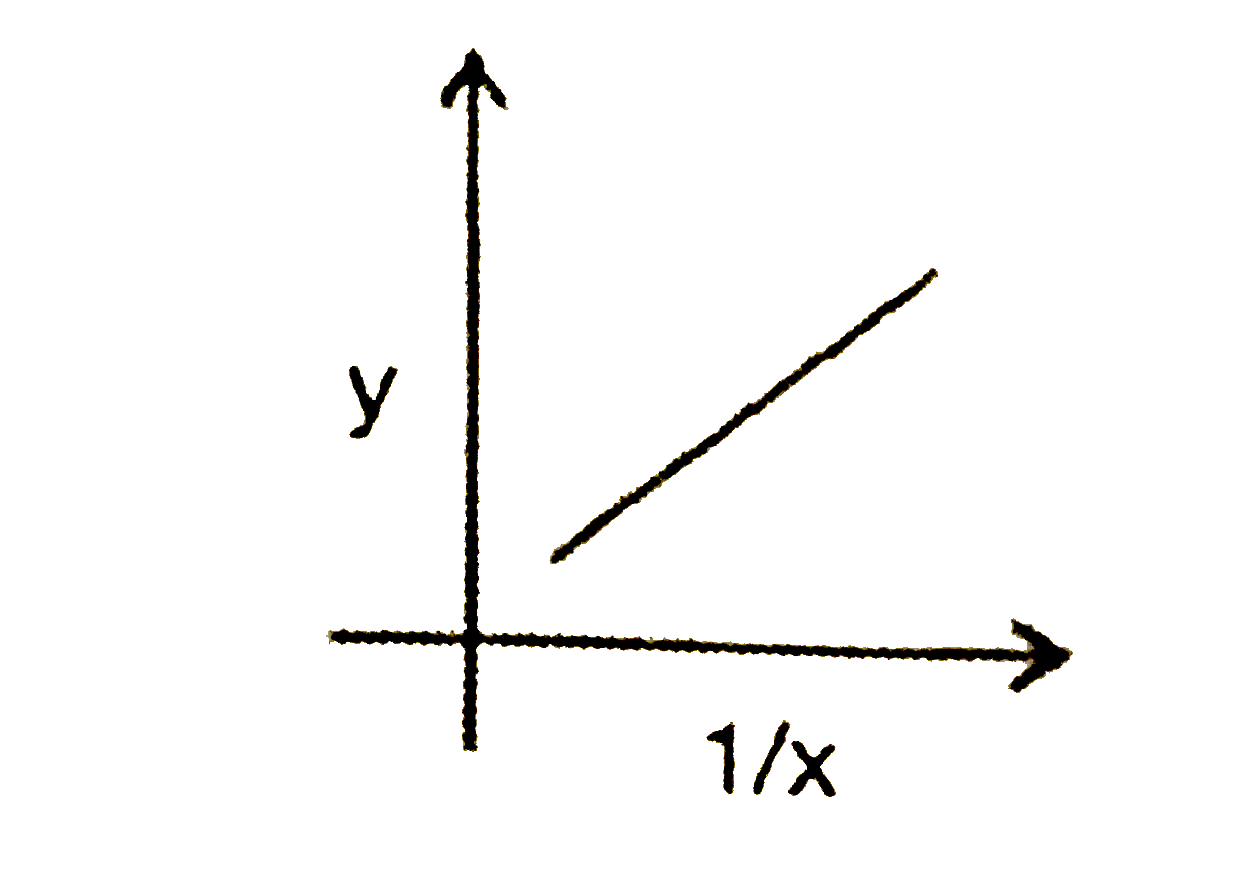
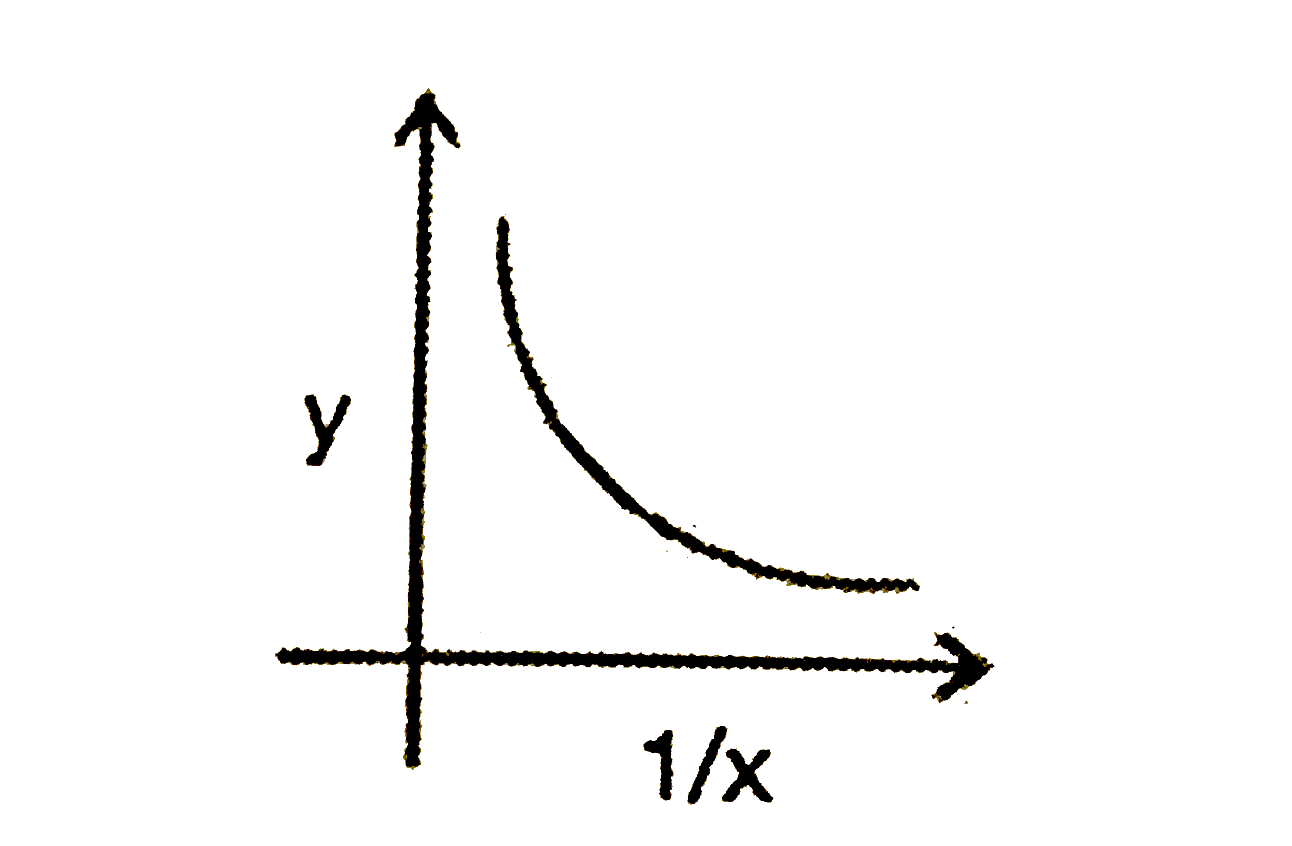
Two variables x and y very such that xy = constant.
Which of the following graphs represent the above relationship ?
A
B
C
D
Video Solution
Text Solution
The correct Answer is:C
|
Answer
Step by step video, text & image solution for Two variables x and y very such that xy = constant. Which of the following graphs represent the above relationship ? by Physics experts to help you in doubts & scoring excellent marks in Class 9 exams.
Updated on:21/07/2023Topper's Solved these Questions
- MEASUREMENTSBOOK - PEARSON IIT JEE FOUNDATIONCHAPTER - MEASUREMENTSEXERCISE - Level 2
24 Videos
- MEASUREMENTSBOOK - PEARSON IIT JEE FOUNDATIONCHAPTER - MEASUREMENTSEXERCISE - Level 3
8 Videos
- MEASUREMENTSBOOK - PEARSON IIT JEE FOUNDATIONCHAPTER - MEASUREMENTSEXERCISE - Essay Type questions
5 Videos
- MAGNETISMBOOK - PEARSON IIT JEE FOUNDATIONCHAPTER - MAGNETISMEXERCISE - Level-3
10 Videos
- MODERN PHYSICSBOOK - PEARSON IIT JEE FOUNDATIONCHAPTER - MODERN PHYSICSEXERCISE - Level 3
5 Videos
Similar Questions
Knowledge Check
Which of the following graph represents e−x?
A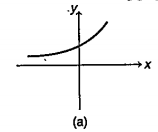 B
B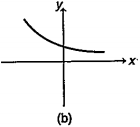 C
C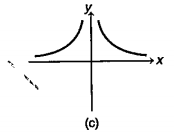 D
D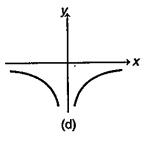
Which of the following graph represents e−x?
A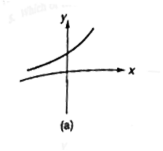 B
B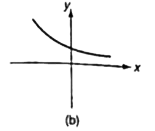 C
C D
D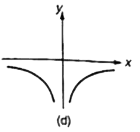
Which of the following graph represents e−x?
A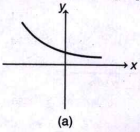 B
B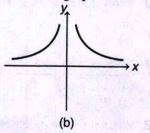 C
C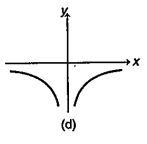 D
D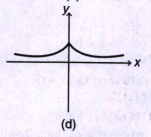
Which of the following pairs represents a parasitic relationship?
View SolutionWhich of the following pairs represents a parasitic relationship?
View SolutionWhich of the following graphs represents the velocity-time relationship for a falling apple?
View SolutionWhich of the following graph is correctly represented?
View SolutionWhich of the following x-t graphs does not represent periodic motion?
View Solution

