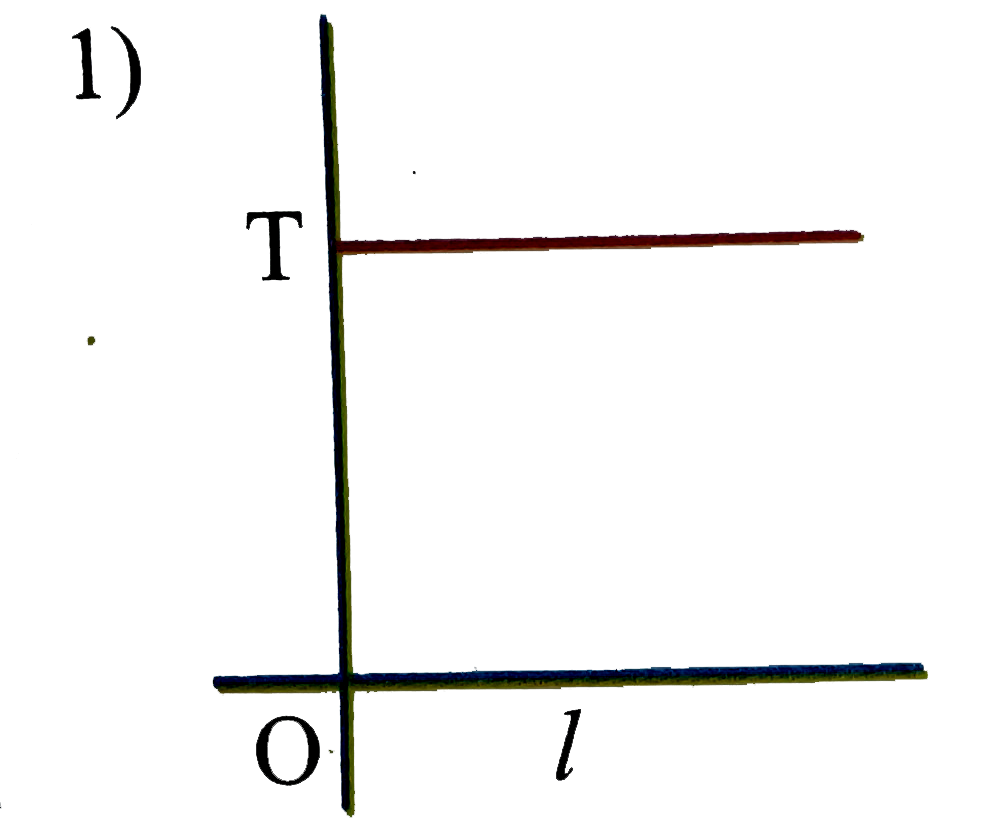
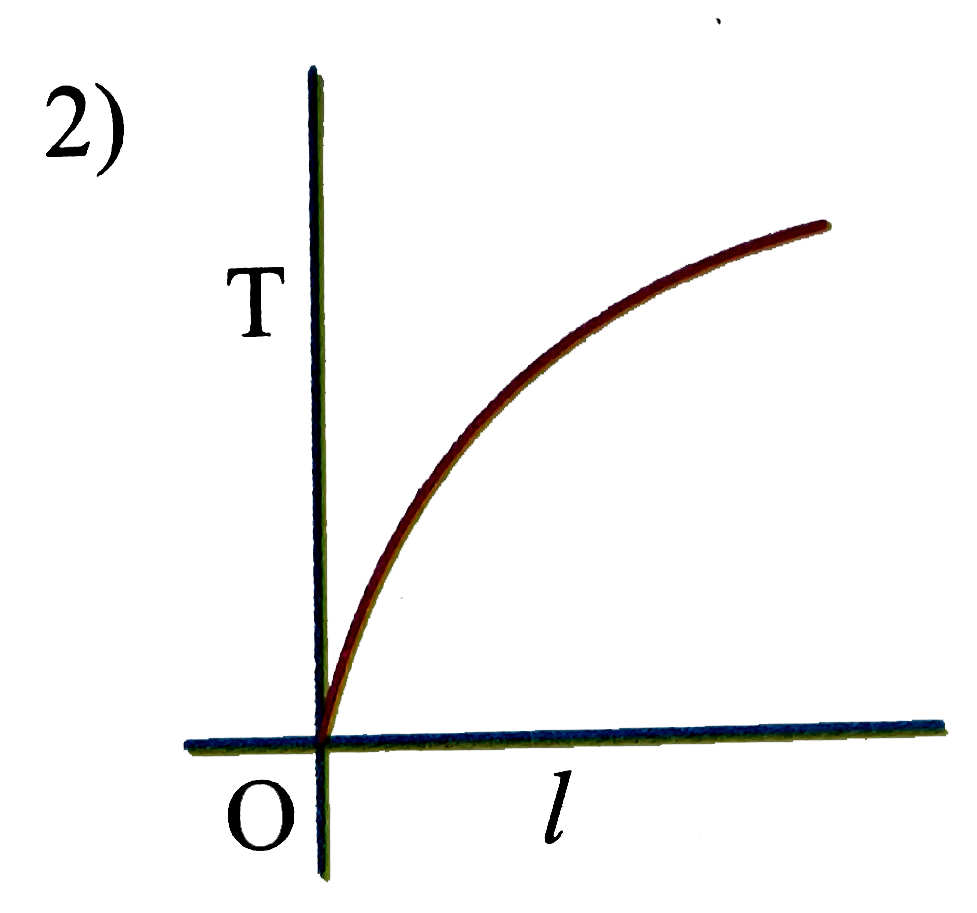
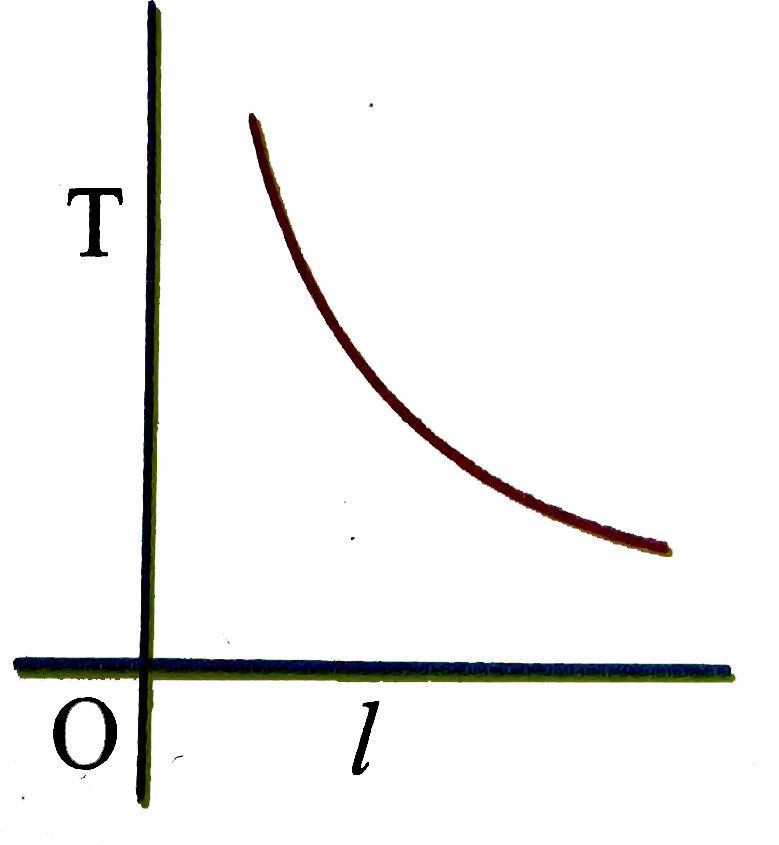
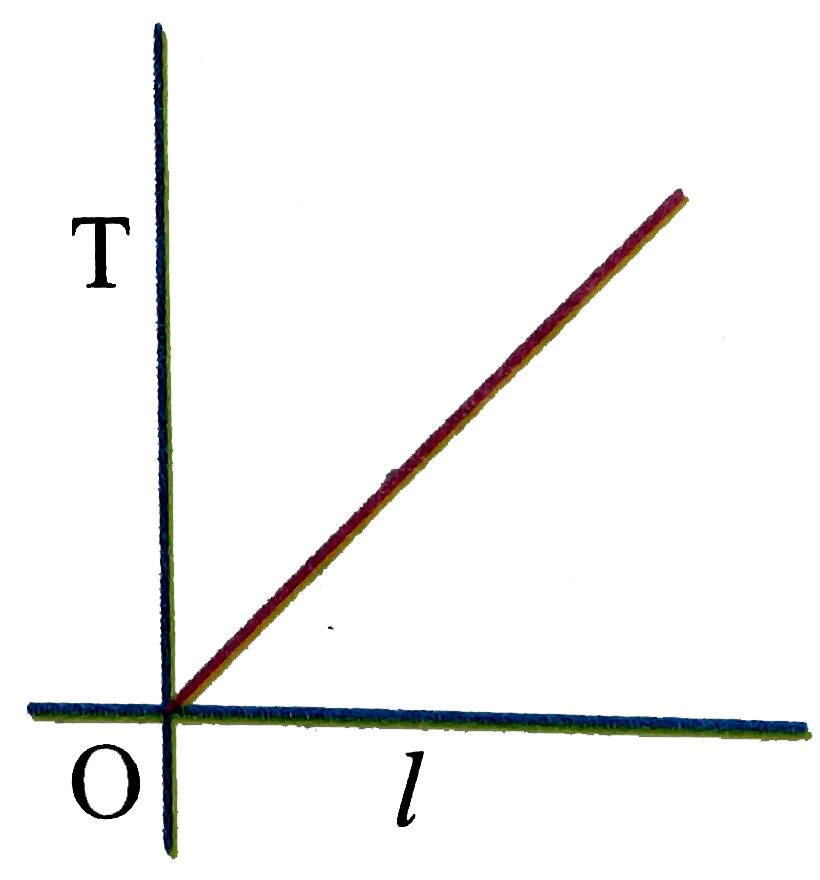
if a graphs is plotted between the length of a pendulum (l) and its time period (T) then the two guanttities are plotted as _______
(A) l along X-axis
(B) T along Y-axis
olny (A) is true
only (B) is true
both (A) and (B) are true
both (A) and (B) are false
The correct Answer is:C
Step by step video, text & image solution for if a graphs is plotted between the length of a pendulum (l) and its time period (T) then the two guanttities are plotted as "_______" (A) l along X-axis (B) T along Y-axis by Physics experts to help you in doubts & scoring excellent marks in Class 9 exams.
Updated on:21/07/2023Topper's Solved these Questions
- MEASUREMENTSBOOK - PEARSON IIT JEE FOUNDATIONCHAPTER - MEASUREMENTSEXERCISE - Level 2
24 Videos
- MEASUREMENTSBOOK - PEARSON IIT JEE FOUNDATIONCHAPTER - MEASUREMENTSEXERCISE - Level 3
8 Videos
- MEASUREMENTSBOOK - PEARSON IIT JEE FOUNDATIONCHAPTER - MEASUREMENTSEXERCISE - Essay Type questions
5 Videos
- MAGNETISMBOOK - PEARSON IIT JEE FOUNDATIONCHAPTER - MAGNETISMEXERCISE - Level-3
10 Videos
- MODERN PHYSICSBOOK - PEARSON IIT JEE FOUNDATIONCHAPTER - MODERN PHYSICSEXERCISE - Level 3
5 Videos
Similar Questions
Knowledge Check
The graph between time period (T) and length (l) of a simple pendulum is
A B
B C
C D
D
A graph is plotted taking .∘C along the Y-axis and .∘F along the X-axis. It is a/an
AparabolaBstraight lineCellipseDcircleFor a simple pendulum, the graph between T2andL (where T is the time period & Lis the length) is
Astraight line passing through originBparabolicCcircleDnone of the above
The graph of time period (T) of a simple pendulum versus its length (I) is
View SolutionA graph is plotted taking ∘––C along the Y - axis and of along the X - axis .It is a /an
View SolutionHow does time period (T) of seconds pendulum very with length (l) ?
View SolutionIn the experiment to study relationship between temperture of the body and time if a graph is plotted between log(θ−θ0) taking it along y−axis and time (t) taking along x−along, it is
View SolutionThe graph of time period (T) of simple pendulum versus its length (l) is
View Solution
