A block of ice −10∘C is slowly heated and converted to steam at 100∘C. Which of the following curves represent the phenomenon qualitatively?
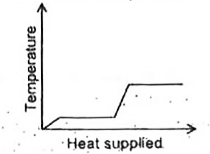
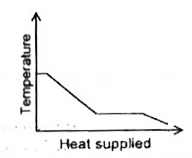
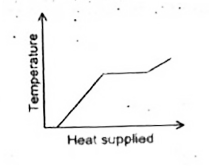
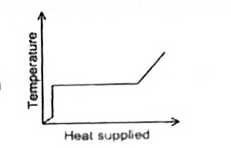
The correct Answer is:A
To analyze the heating process of a block of ice at -10°C being converted to steam at 100°C, we can break down the process into several steps and represent it qualitatively on a temperature vs. heat graph.
1. Initial State: The block of ice starts at -10°C. At this stage, it is in solid form.
2. Heating the Ice: As heat is supplied, the temperature of the ice will increase from -10°C to 0°C. This is a linear increase in temperature as the ice absorbs heat.
3. Phase Change (Melting): At 0°C, the ice begins to melt into water. During this phase change, the temperature remains constant at 0°C while the ice absorbs heat (latent heat of fusion). This heat is used to break the bonds between the ice molecules, allowing them to transition into the liquid state.
4. Heating the Water: Once all the ice has melted and we have water at 0°C, further heating will raise the temperature of the water from 0°C to 100°C. This again is a linear increase in temperature as the water absorbs heat.
5. Phase Change (Vaporization): At 100°C, the water begins to convert into steam. Similar to the melting process, during this phase change, the temperature remains constant at 100°C while the water absorbs heat (latent heat of vaporization). This heat is used to convert the water into steam.
6. Final State: After all the water has been converted to steam, the temperature can increase further if more heat is supplied, but for this problem, we stop at the steam phase at 100°C.
Qualitative Graph Representation:
- The graph will have a rising slope from -10°C to 0°C (heating the ice).
- A horizontal line at 0°C (melting the ice).
- Another rising slope from 0°C to 100°C (heating the water).
- A horizontal line at 100°C (vaporizing the water).
- The graph will illustrate the temperature changes and the constant temperature during phase changes.
Conclusion:
The correct qualitative curve representing the phenomenon involves two linear segments (heating the ice and heating the water) and two horizontal segments (melting and vaporization).
---
- The graph will have a rising slope from -10°C to 0°C (heating the ice).
- A horizontal line at 0°C (melting the ice).
- Another rising slope from 0°C to 100°C (heating the water).
- A horizontal line at 100°C (vaporizing the water).
- The graph will illustrate the temperature changes and the constant temperature during phase changes.
The correct qualitative curve representing the phenomenon involves two linear segments (heating the ice and heating the water) and two horizontal segments (melting and vaporization).
Topper's Solved these Questions
- HEAT AND TEMPERATUREBook:FIITJEEChapter:HEAT AND TEMPERATUREExercise:ASSIGNMENT PROBLEMS (OBJECTIVE) (LEVEL-I) (ASSERTION AND REASON)
Explore 2 Videos
- HEAT AND TEMPERATUREBook:FIITJEEChapter:HEAT AND TEMPERATUREExercise:ASSIGNMENT PROBLEMS (OBJECTIVE) (LEVEL II)
Explore 20 Videos
- HEAT AND TEMPERATUREBook:FIITJEEChapter:HEAT AND TEMPERATUREExercise:ASSIGNMENT PROBLEMS (SUBJECTIVE) (LEVEL II AND III)
Explore 15 Videos
- GRAVITATIONBook:FIITJEEChapter:GRAVITATIONExercise:Numerical based Question
Explore 2 Videos
- KINEMATICSBook:FIITJEEChapter:KINEMATICSExercise:NUMERICAL BASED QUESTIONS DECIMAL TYPE
Explore 5 Videos
Similar Questions
Knowledge Check
A block of ice at −10∘C is slowly heated and converted to steam at 100∘C. Which of the following curves represents the phenomenon qualitatively?
A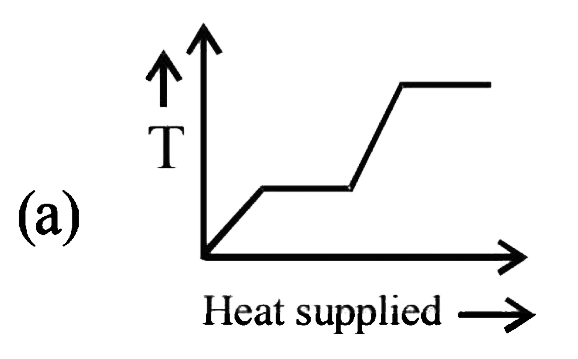 B
B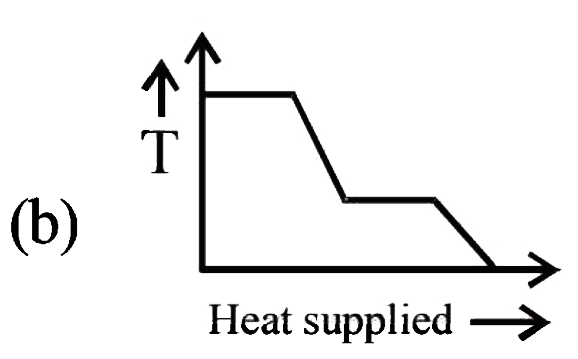 C
C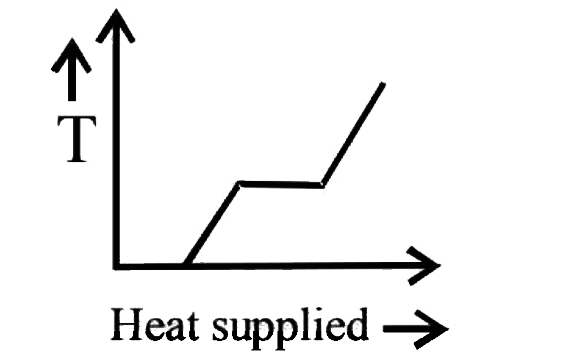 D\
D\A block of ice at −12∘C is slowly heated and converted into steam at 100∘C. Which of the following curves best represents the event ?
A B
B C
C D
D
A block of ice at temperature −20∘C is slowly heated and converted to steam at 100∘C. Which of the following diagram is most appropriate?
A B
B C
C D
D
100g of ice at 0∘ is mixed with 100g of water at 100∘C. What will be the final temperature (in K ) of the mixture?
View Solutiona block of ice at temperature −20∘C is slowly heated and converted to steam at 100∘C which of the following diagram is most appropriate
View Solutiona block of ice at temperature −20∘C is slowly heated and converted to steam at 100∘C which of the following diagram is most appropriate
View SolutionA block of ice at −5∘C is slowly heated and converted to steam at 100∘C . The process can be qualitatively represented by the curve
View SolutionA block of ice at 0∘C is converted to steam at 100∘C. Which process will require the most amount of heat?
View Solution