Observe this bar graph which is showing the sale of shirts in a ready made shop from Monday to Saturday
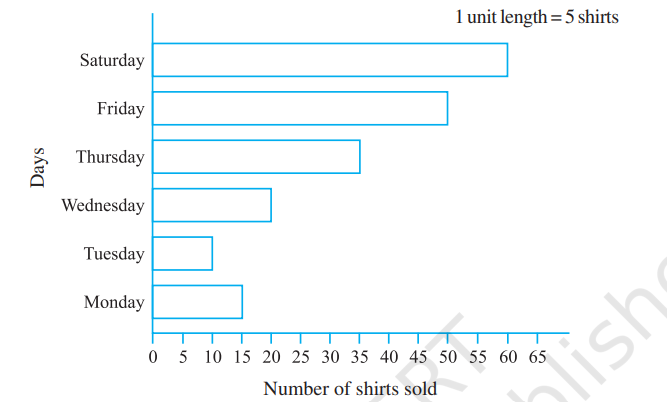
a) The above bar graph gives the information about the sale of shirts in a ready-made shop from Monday to Saturday.
b) The scale chosen to represent the number of shirts on the horizontal line is 1 unit length = 5 sold shirts.
c) On Saturday, the maximum shirts were sold for the week. 60 sold.
Topper's Solved these Questions
- BOOK - NCERTCHAPTER - DATA HANDLINGEXERCISE - EXERCISE 9.44videos
DATA HANDLING
- BOOK - NCERTCHAPTER - DATA HANDLINGEXERCISE - EXERCISE 9.17videos
DATA HANDLING
- BOOK - NCERTCHAPTER - DATA HANDLINGEXERCISE - SOLVED EXAMPLES9videos
DATA HANDLING
- BOOK - NCERTCHAPTER - BASIC GEOMETRICAL IDEASEXERCISE - EXERCISE 4.64videos
BASIC GEOMETRICAL IDEAS
- BOOK - NCERTCHAPTER - DECIMALSEXERCISE - EXERCISE 8.110videos
DECIMALS
Similar Questions
Study the line graph given below to answer the following questions.
The line graph given below shows the percentage of orders delivered from Monday to Saturday of week III out of the orders received on Sunday of Week II and it also shows the number of orders returned on any given day as a percentage of total number of orders delivered till previous day.
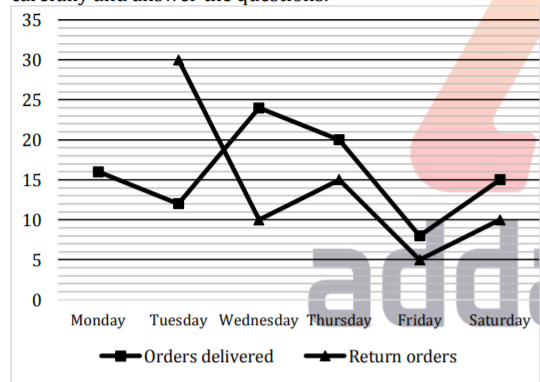
Note: • Number of orders which were yet to be delivered after Saturday of week III were 25.
• Orders cannot be returned on the same day of delivery. It has to be returned on next day of delivery and no order was returned on Sunday of Week III.
Find the average number of orders delivered on Monday, Tuesday and Thursday of week III.View SolutionObserve this bar graph which shows the marks obtained by Aziz in half-yearly examination in different subjects.
View SolutionObserve this bar graph which shows the marks obtained by Aziz in half-yearly examination in different subjects.
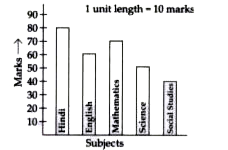
Answer the given questions.
What information does the bar graph give ?View SolutionThe given bar graph shows the sale of different brands of shirts in a shop in one month.
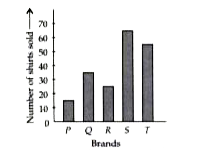
(i) How many total shirts are sold in the month ?View SolutionThe given bar graph shows the sale of different brands of shirts in a shop in one month.

Find the ratio of number of shirts sold of brand S to the number of shirts sold or brand P and R together.
{ ((a),8:9),((b)13:8),((c )11:7),((d)13:6): }View SolutionStudy the double bar graph shown below and answer the questions that follow:
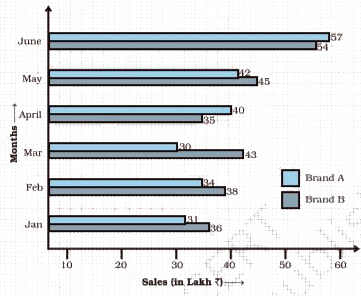
(a) What information is represented by the above double bar graph?
(b) In which month sales of Brand A decreased as compared to the previous month?
(c) What is the difference in sales of both the Brands for the month of June?
(d) Find the average sales of Brand B for the six months.
(e) List all months for which the sales of Brand B was less than that of Brand A.
(f) Find the ratio of sales of Brand A as compared to Brand B for the month of January.View SolutionRead the following bar graph shown in Figure and answer the following questions: What is the information given by the bar graph? In which month was the sale of the book maximum? In which month was the sale of the book minimum? What is the total sale of the book during these five months?
View SolutionThe given bar graph shows the number of students of two schools over a period of six years.
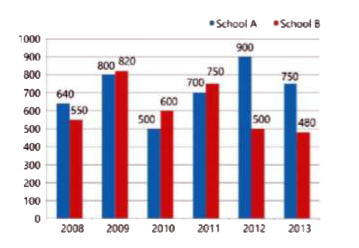
In the bar graph, in which year is the absolme difference of the students from schools A to B taken together, the maximum?View SolutionGiven below is a graph showing the number of electric bulbs sold in a shop during a week
Read the bar graph carefully and answer the following questions
(i) On which day of the week was the sale minimum?
(ii) On which day of the week was the sale maximum
(iiI) What was the total sale during the week
(lv) What is the ratio between the minimum sale and the maximum sale
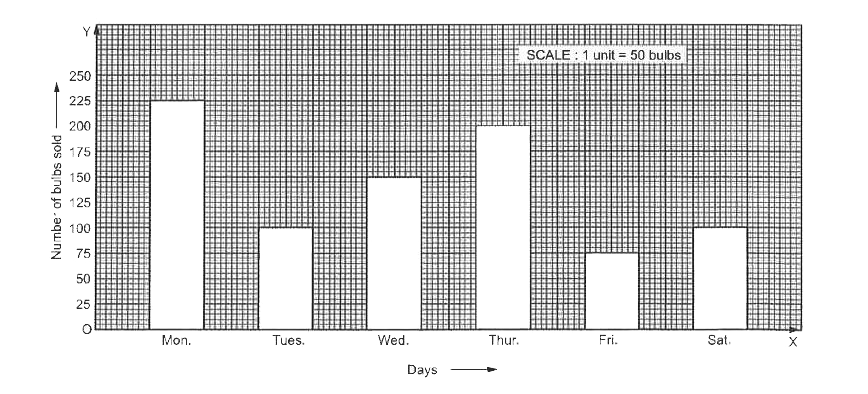 View Solution
Study the following graph and answer the question based on the graph.
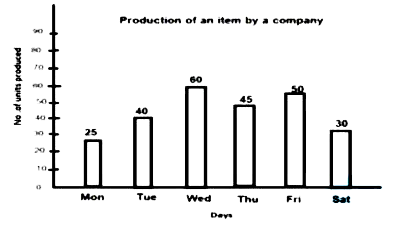
What was the percentage decline in the production from Friday to Saturday?View Solution

