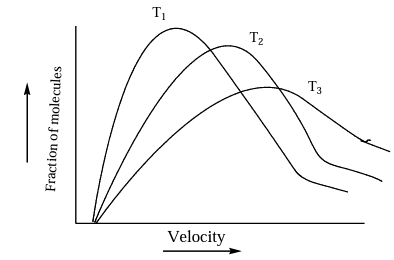
Plot of Maxwell's distribution of velocities is given below:
Which of the following is correct about this plot?
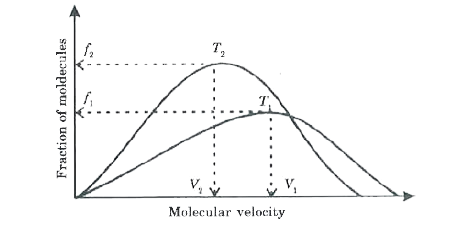
A
f1>f2
B
V1<V2
C
T1<T2
D
T1>T2
Video Solution
Text Solution
The correct Answer is:D
|
Answer
Step by step video, text & image solution for Plot of Maxwell's distribution of velocities is given below: Which of the following is correct about this plot? by Chemistry experts to help you in doubts & scoring excellent marks in Class 11 exams.
Updated on:21/07/2023Topper's Solved these Questions
- STATES OF MATTER : GASES AND LIQUIDSBOOK - MODERN PUBLICATIONCHAPTER - STATES OF MATTER : GASES AND LIQUIDSEXERCISE - COMPETITION FILE OBJECTIVE TYPE QUESTIONS (B. MULTIPLE CHOICE QUESTIONS)(JEE (ADVANCED) FOR IIT ENTRANCE)
8 Videos
- STATES OF MATTER : GASES AND LIQUIDSBOOK - MODERN PUBLICATIONCHAPTER - STATES OF MATTER : GASES AND LIQUIDSEXERCISE - COMPETITION FILE OBJECTIVE TYPE QUESTIONS (C. MULTIPLE CHOICE QUESTIONS)
10 Videos
- STATES OF MATTER : GASES AND LIQUIDSBOOK - MODERN PUBLICATIONCHAPTER - STATES OF MATTER : GASES AND LIQUIDSEXERCISE - COMPETITION FILE OBJECTIVE TYPE QUESTIONS (B. MULTIPLE CHOICE QUESTIONS)
32 Videos
- SOME BASIC CONCEPTS OF CHEMISTRY BOOK - MODERN PUBLICATIONCHAPTER - SOME BASIC CONCEPTS OF CHEMISTRY EXERCISE - COMPETITION FILE (INTEGER TYPE AND NUMERICAL VALUE TYPE QUESTIONS)
10 Videos
- STRUCTURE OF ATOMBOOK - MODERN PUBLICATIONCHAPTER - STRUCTURE OF ATOMEXERCISE - Unit Practice Test
13 Videos
Similar Questions
Knowledge Check
Plot of Maxwell's distribution of velocities is given below:
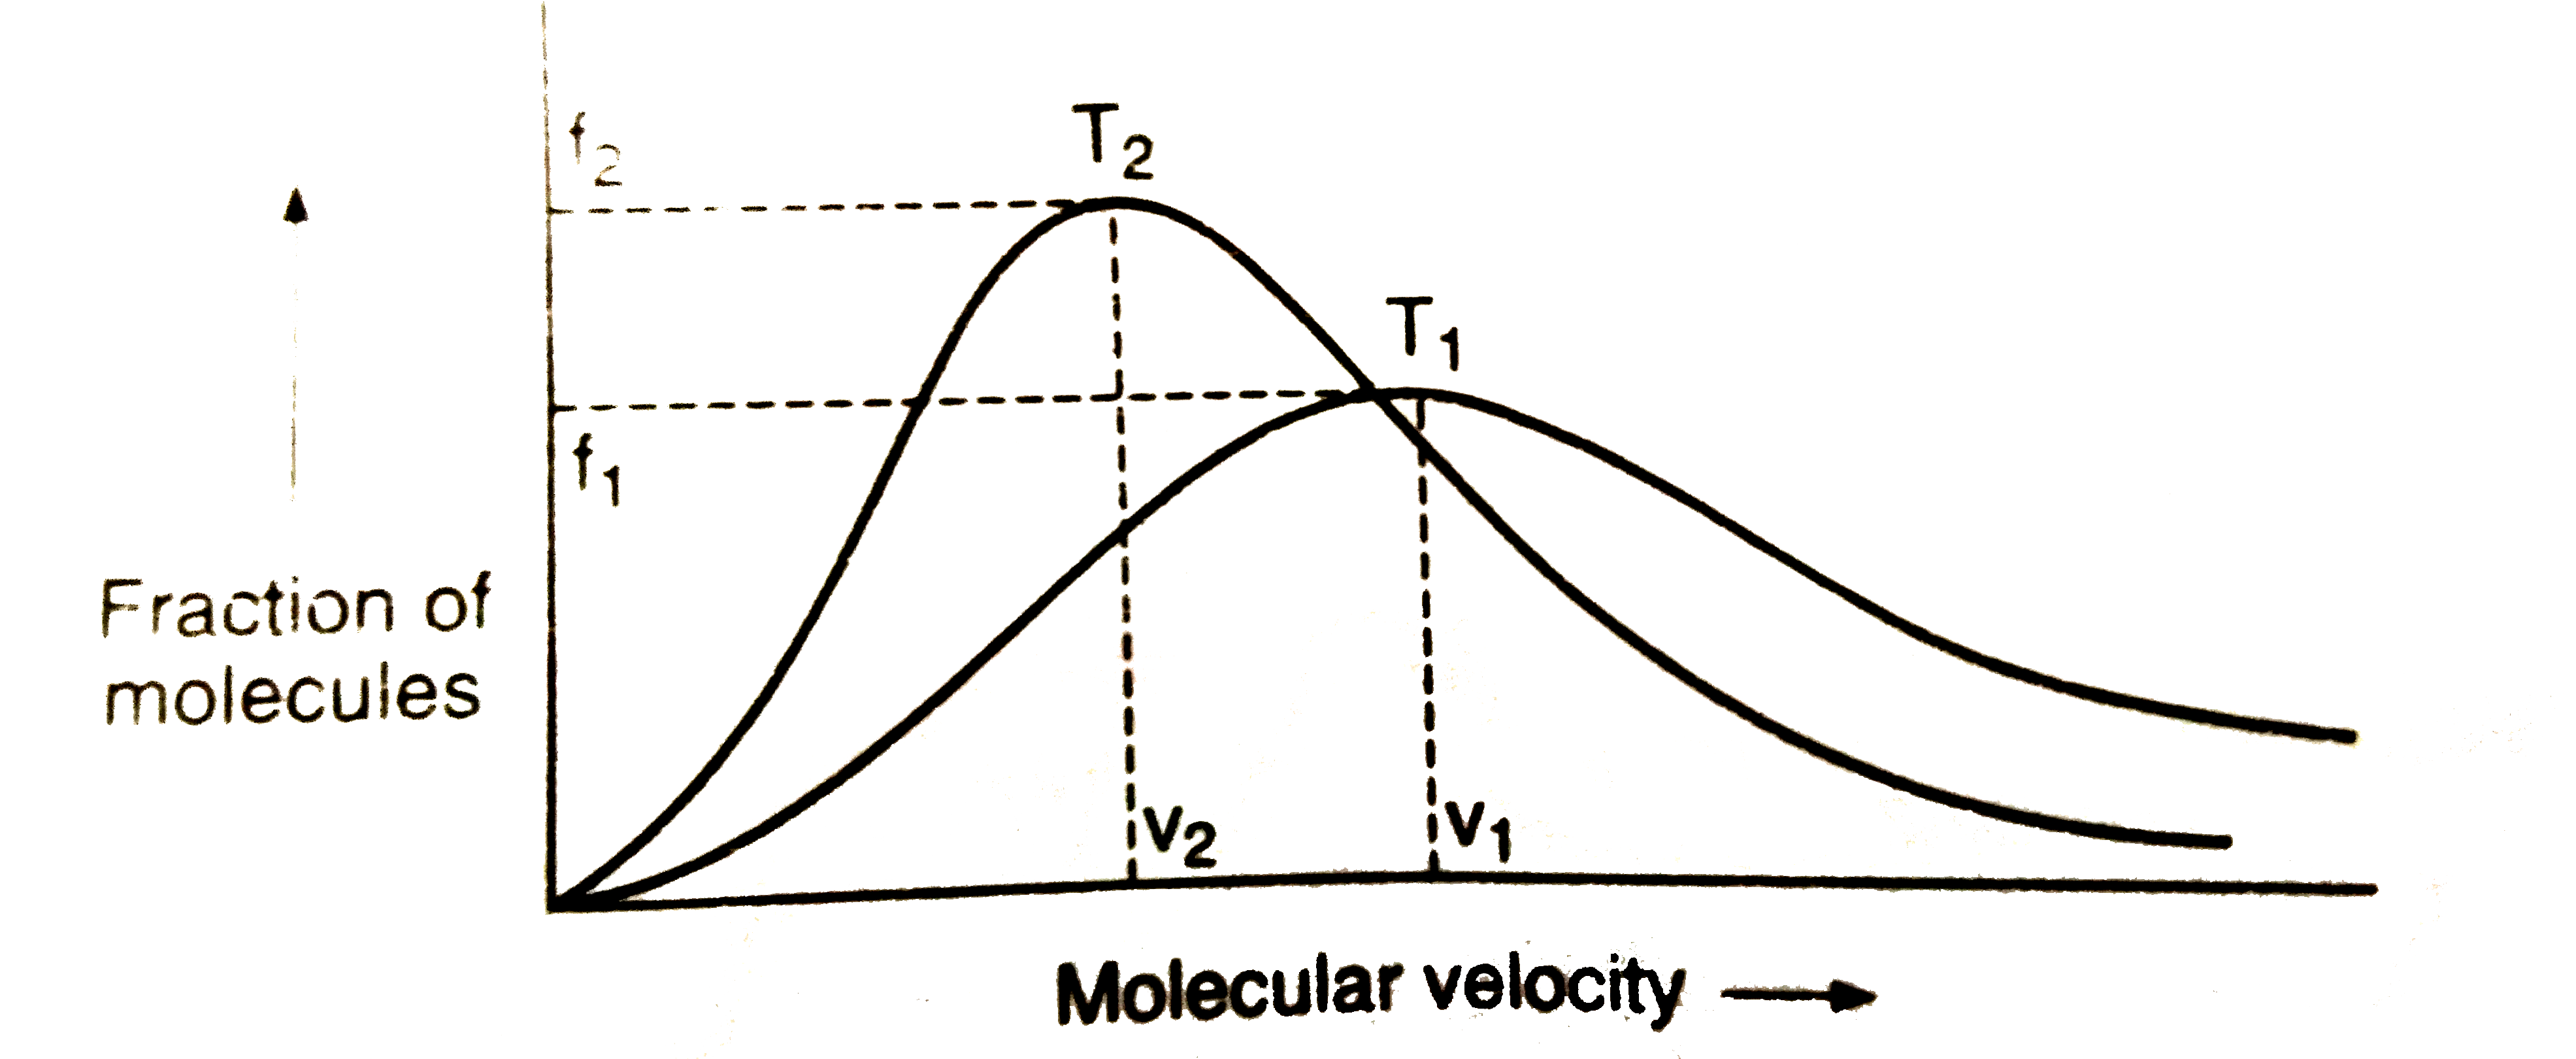
which of following is correct ?AT1>T2BT1<T2Cv1<v2Df1>f2Which of the following plots are correct ?
A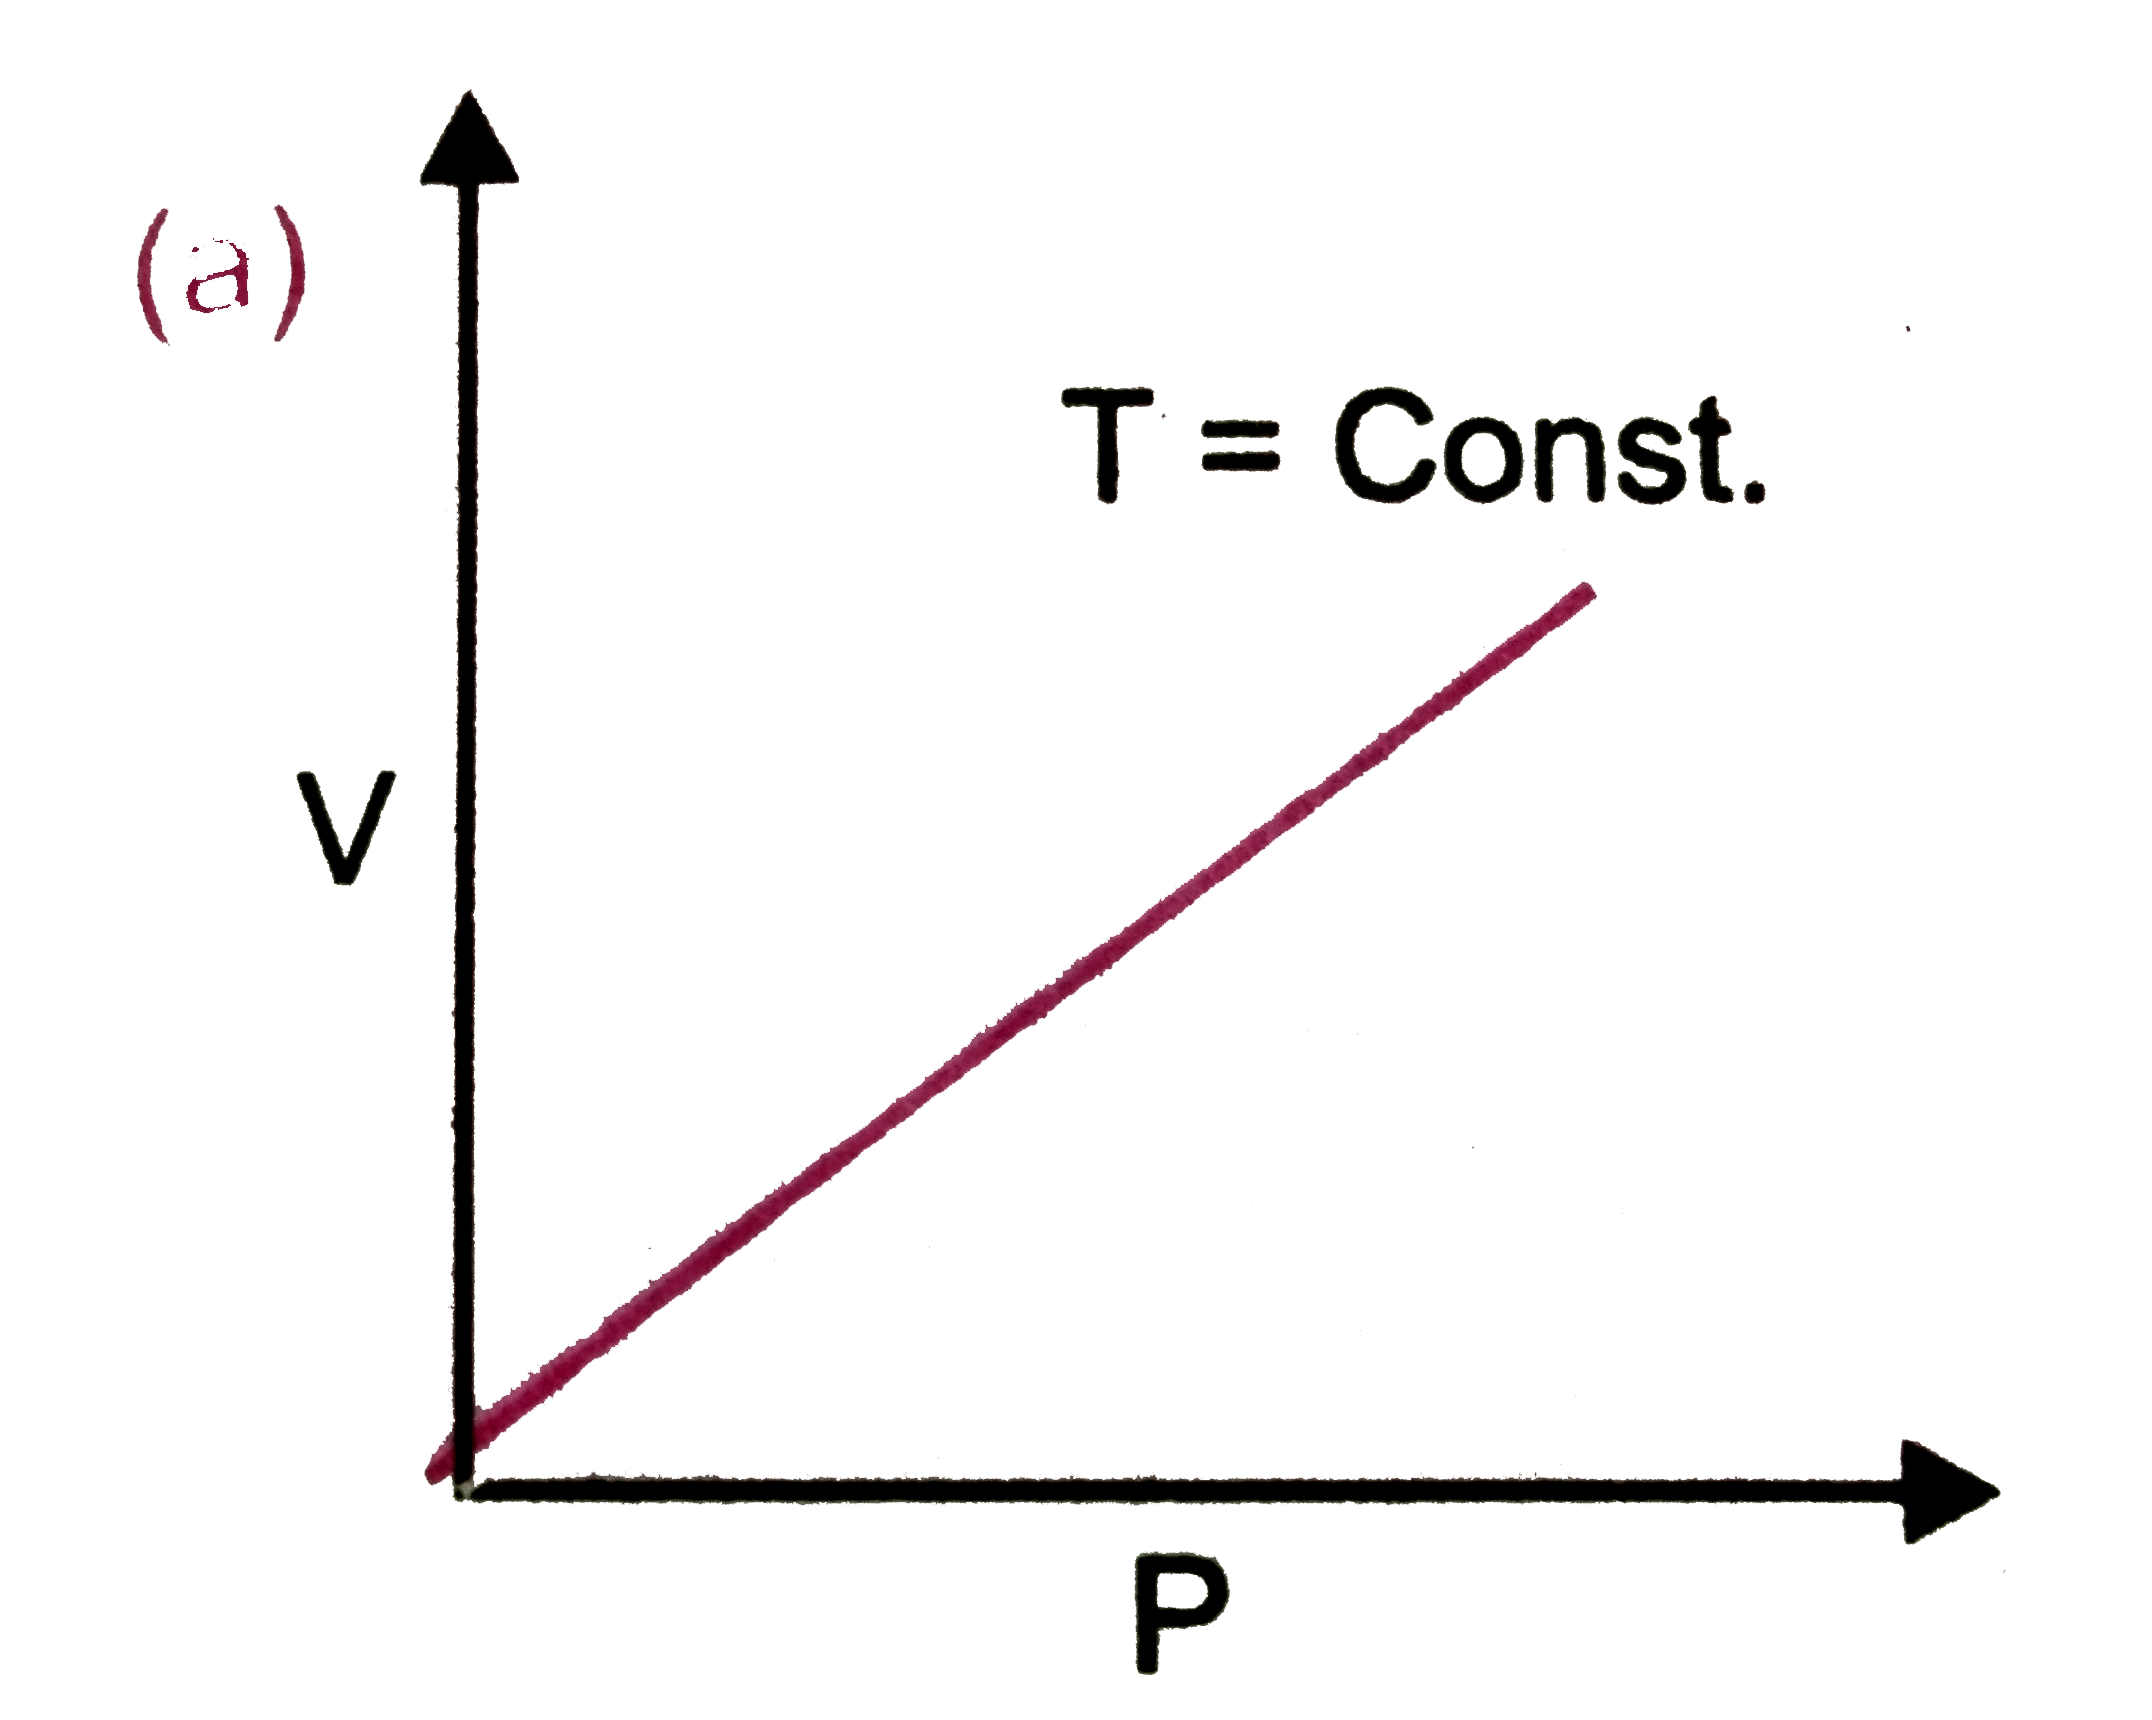 B
B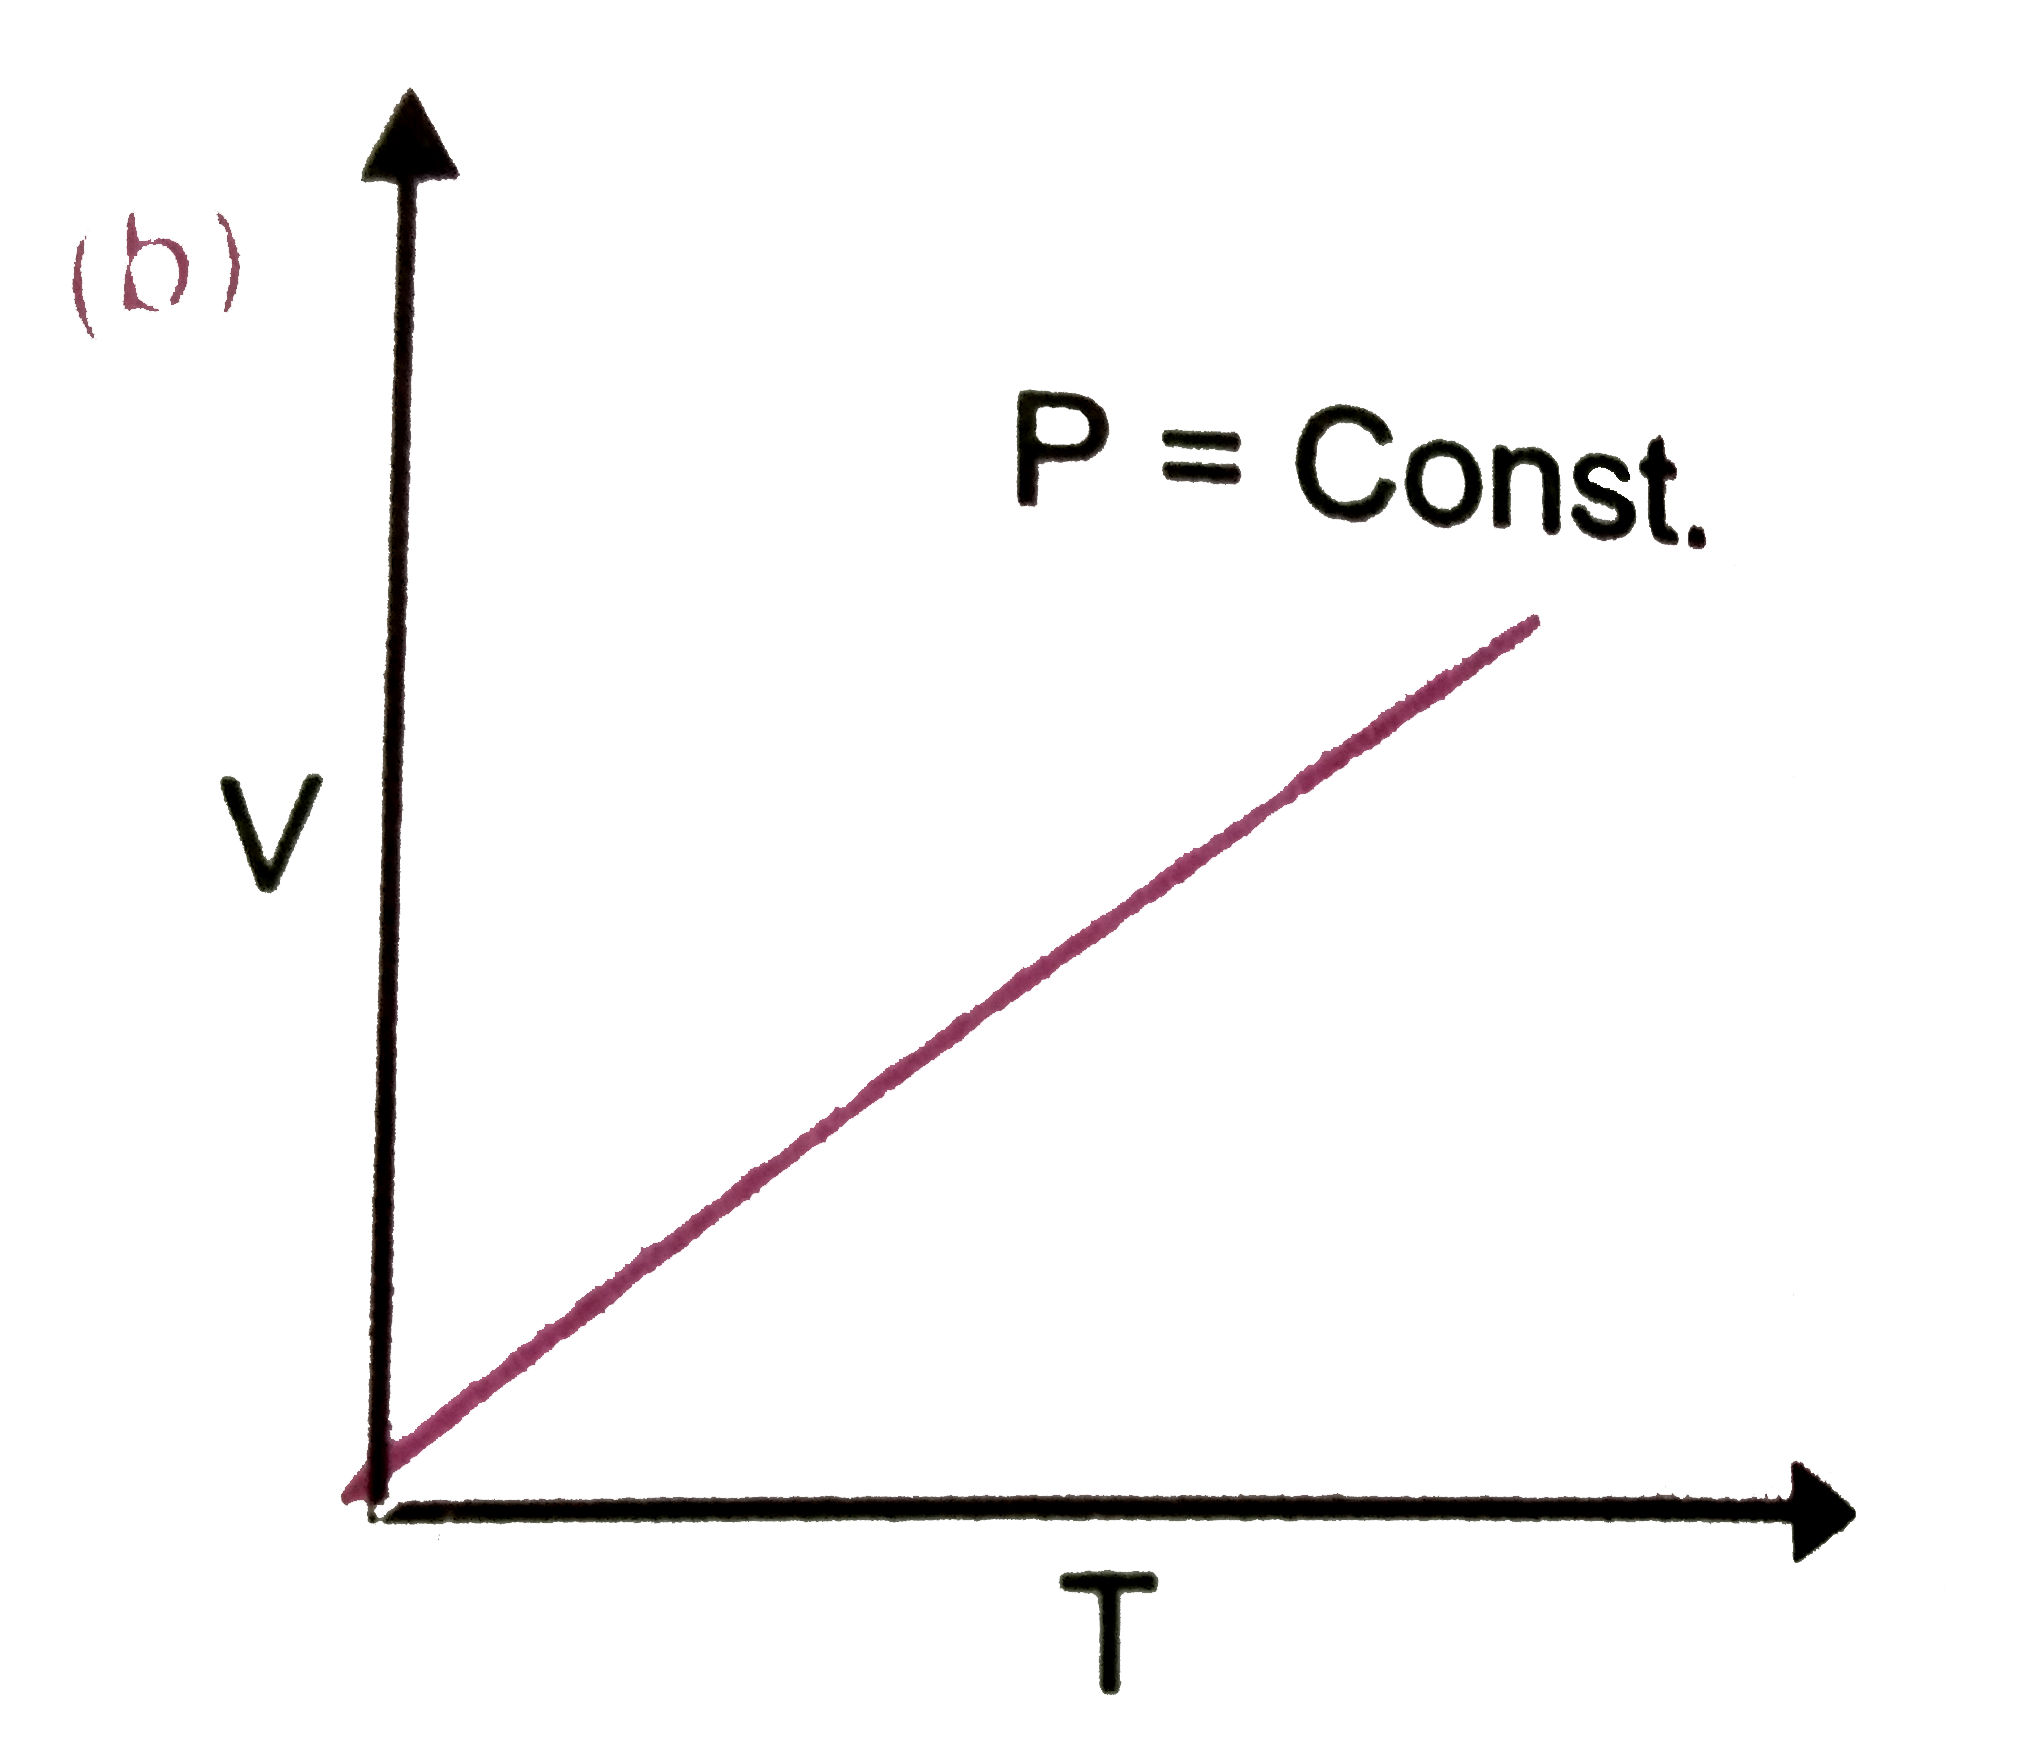 C
C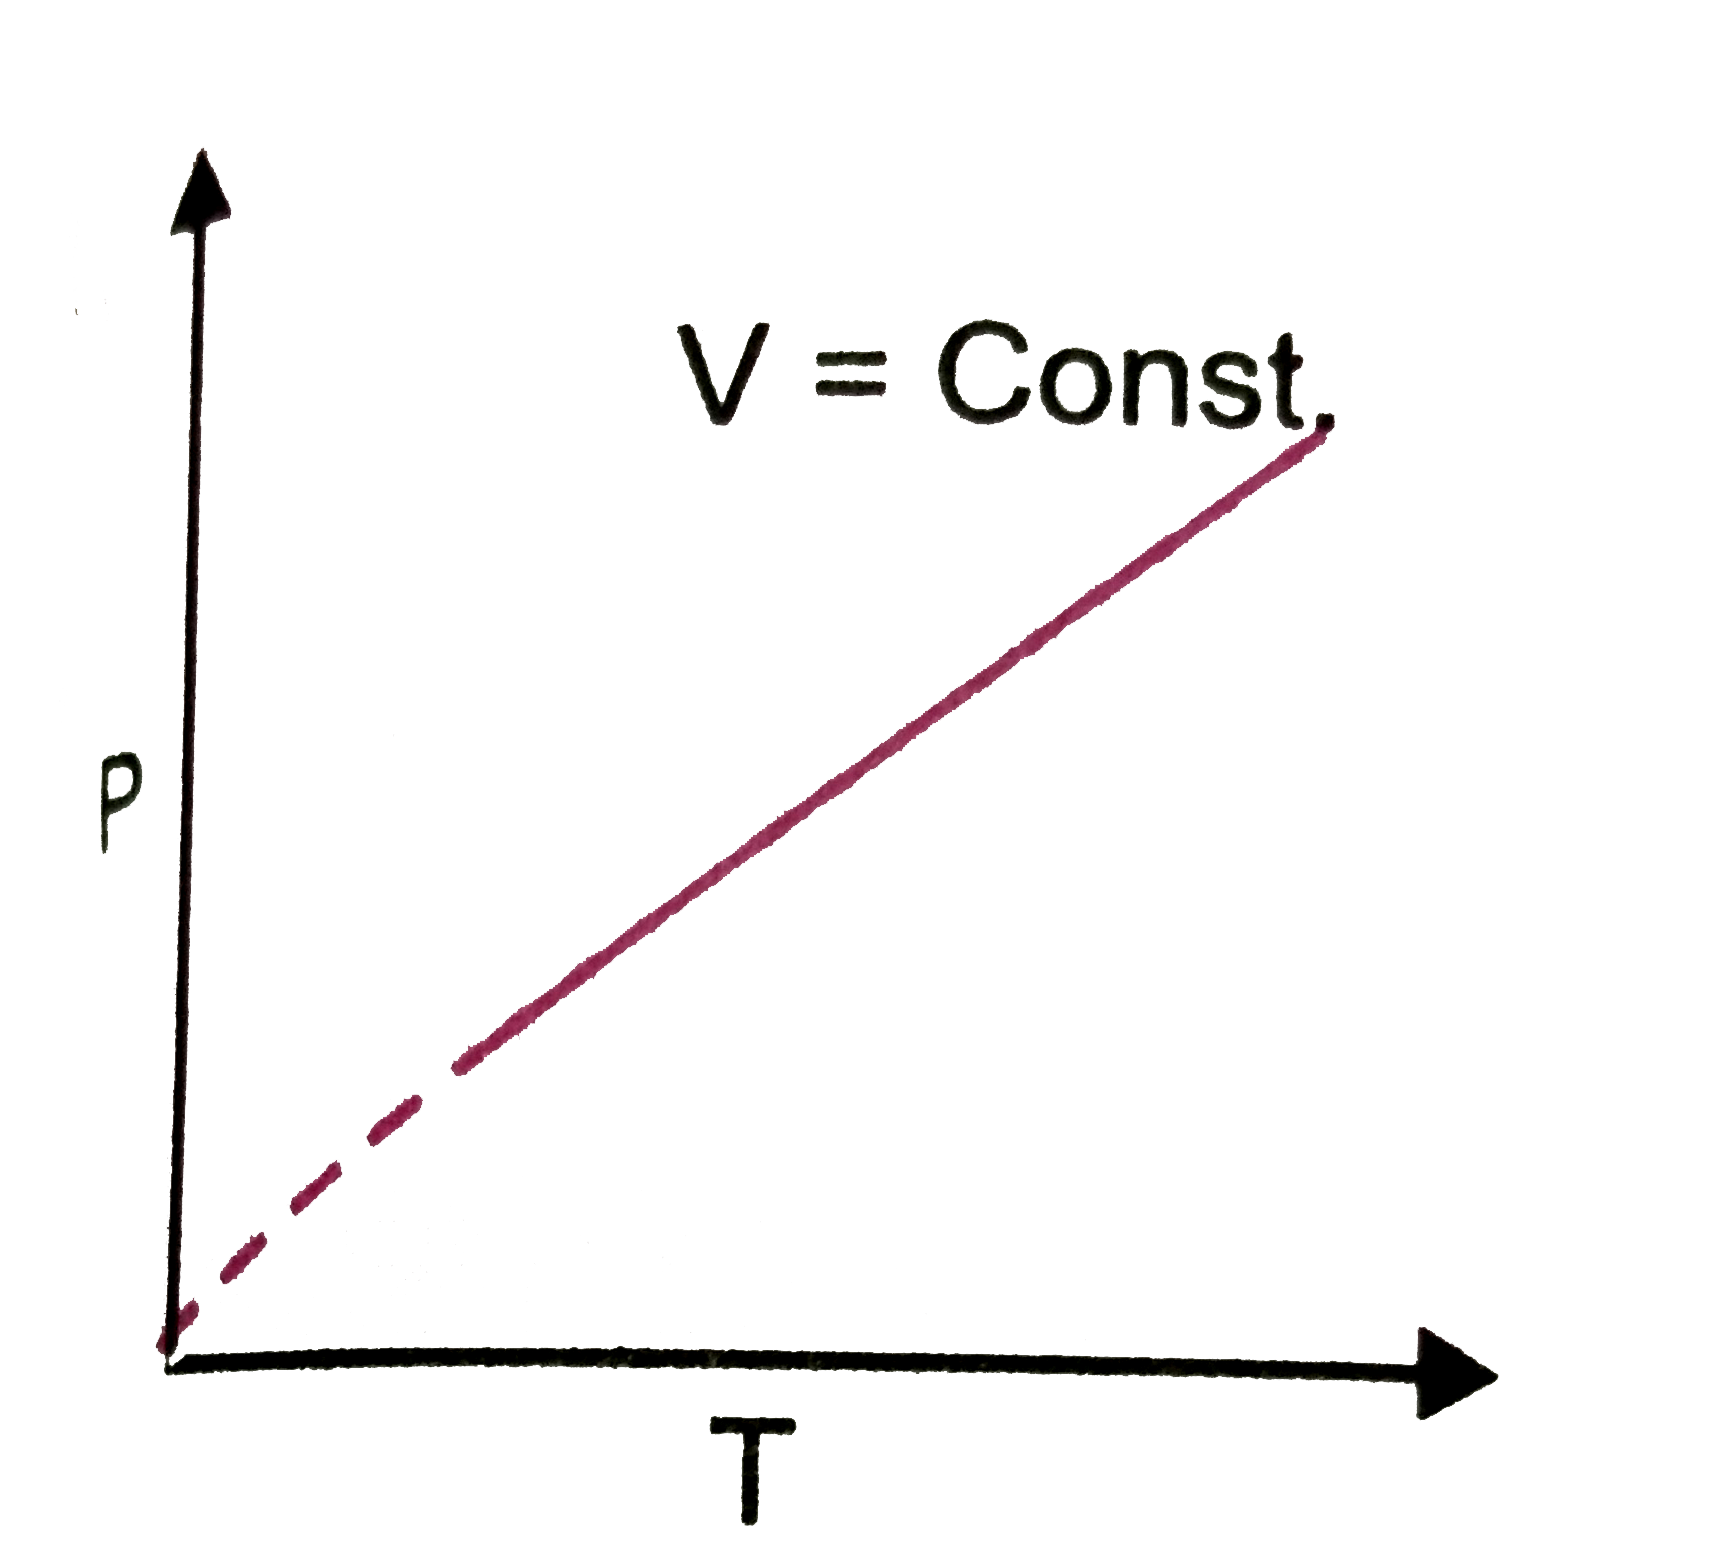 D
D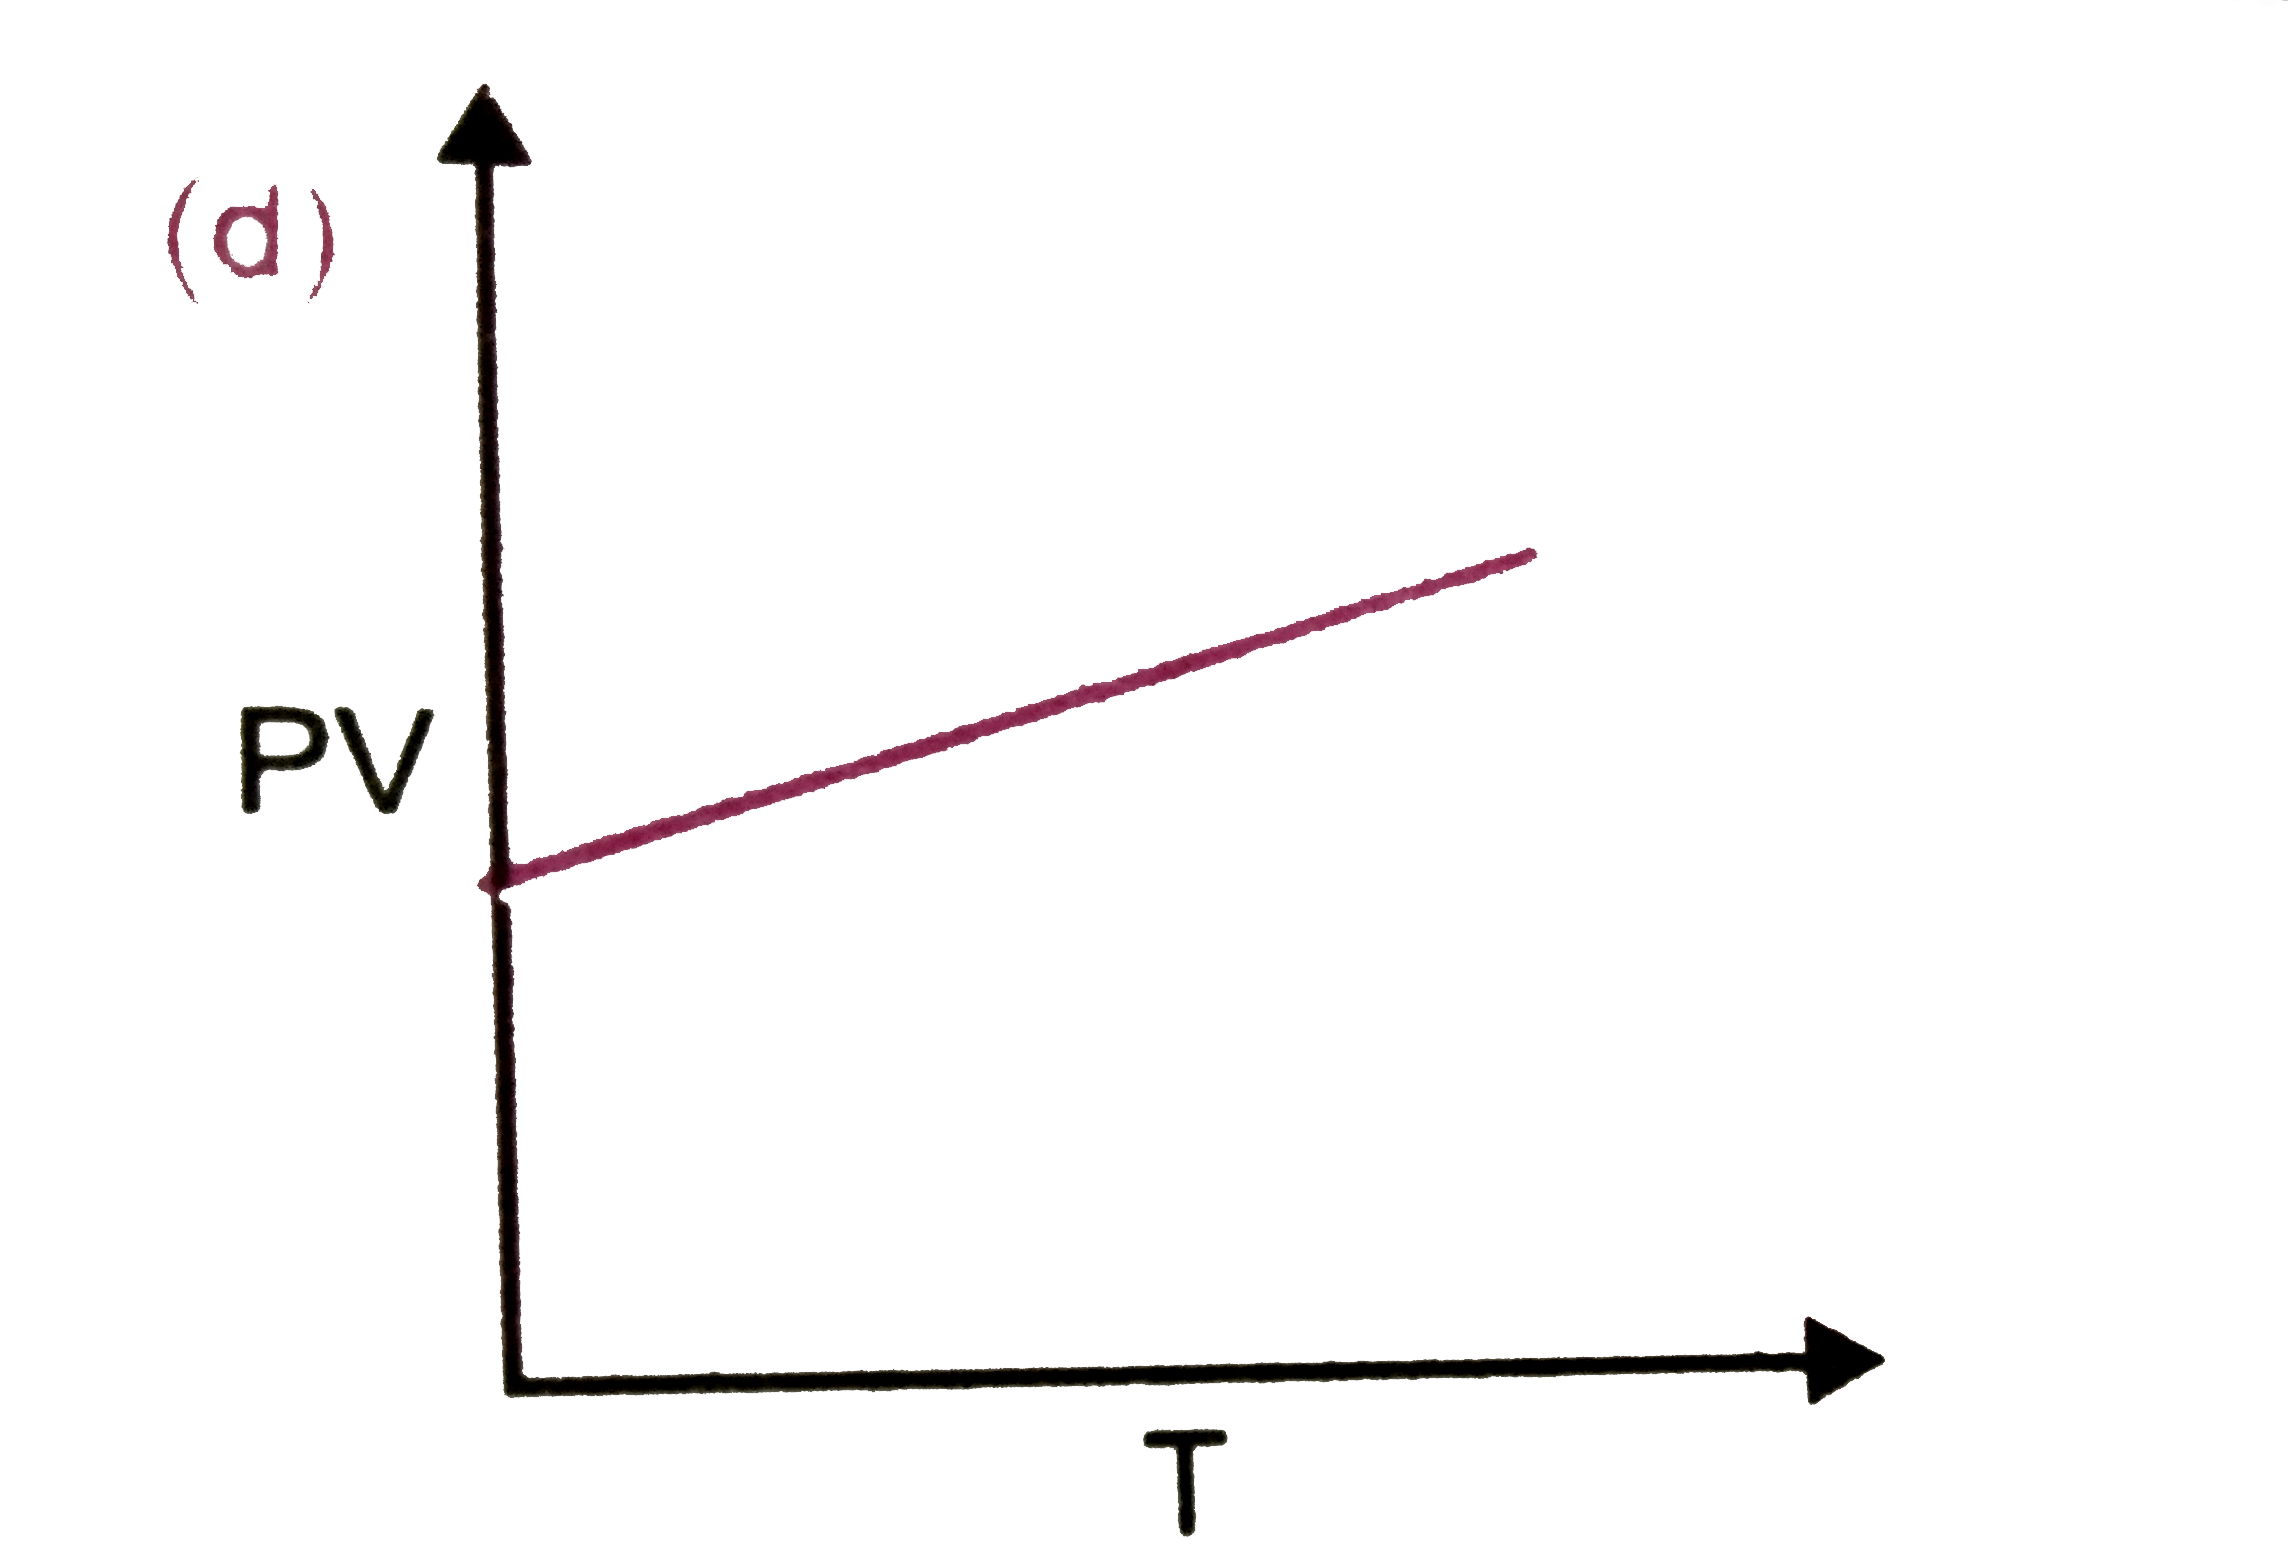
Which of the following plots is/are correctly labelled ?
A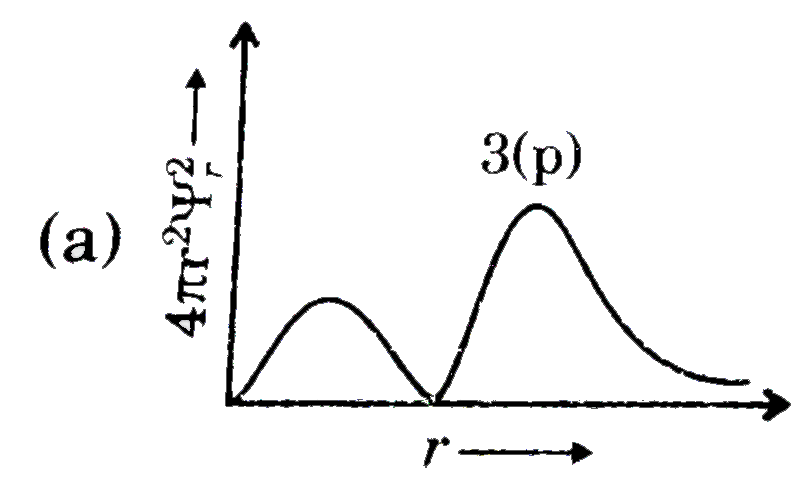 B
B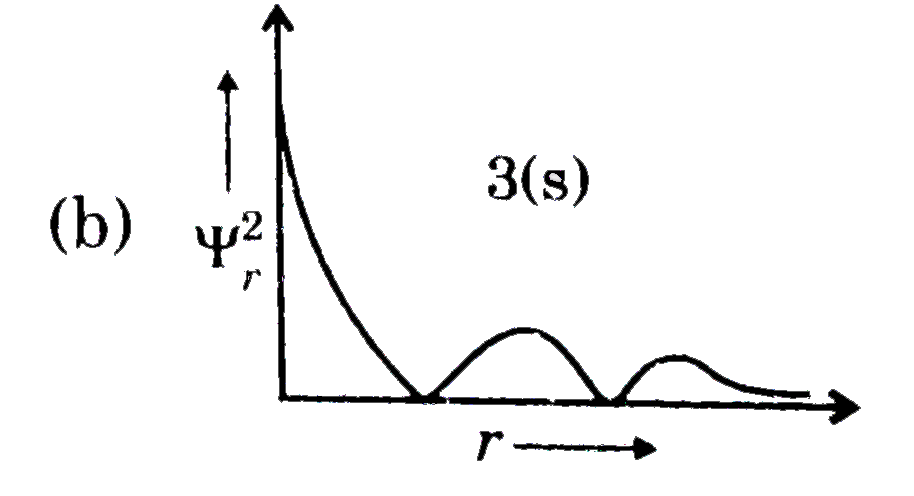 C
C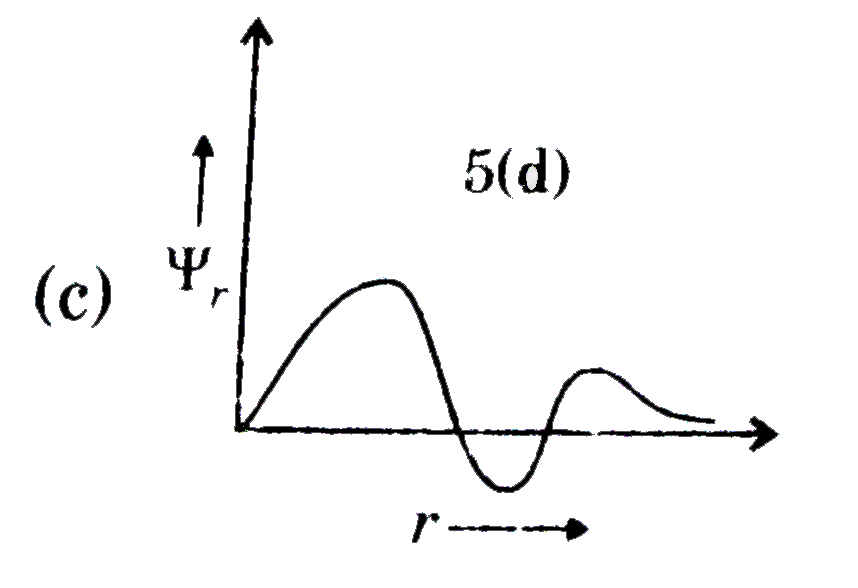 D
D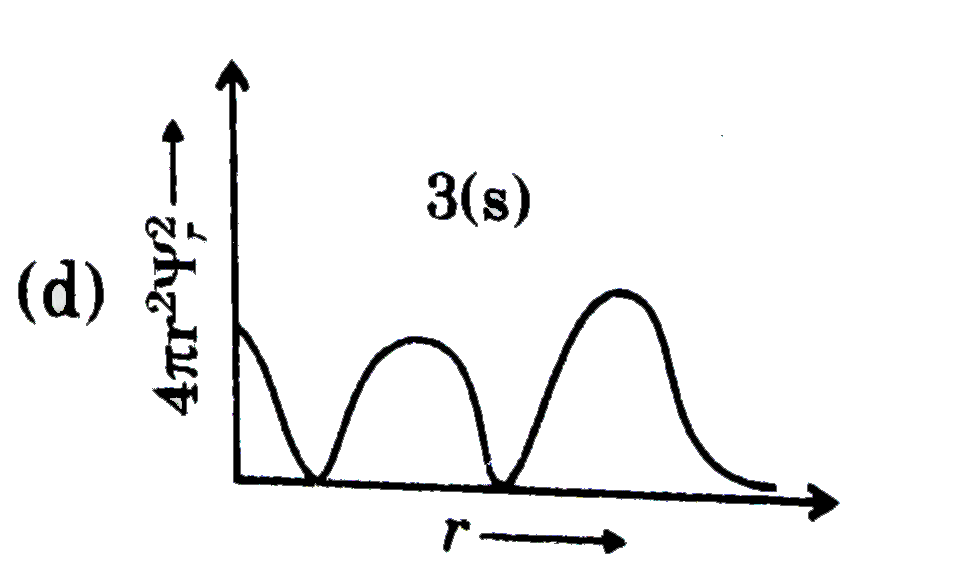
In the following graph of Maxwell - Boltzmann distribution of molecular velocities . Which of the following is the correct order of temperature ?
View SolutionWhich of the following will give linear plots ?
View SolutionWhich of the following plot will not be linear ?
View SolutionWhich of the following plots are correct for an ideal gas ?
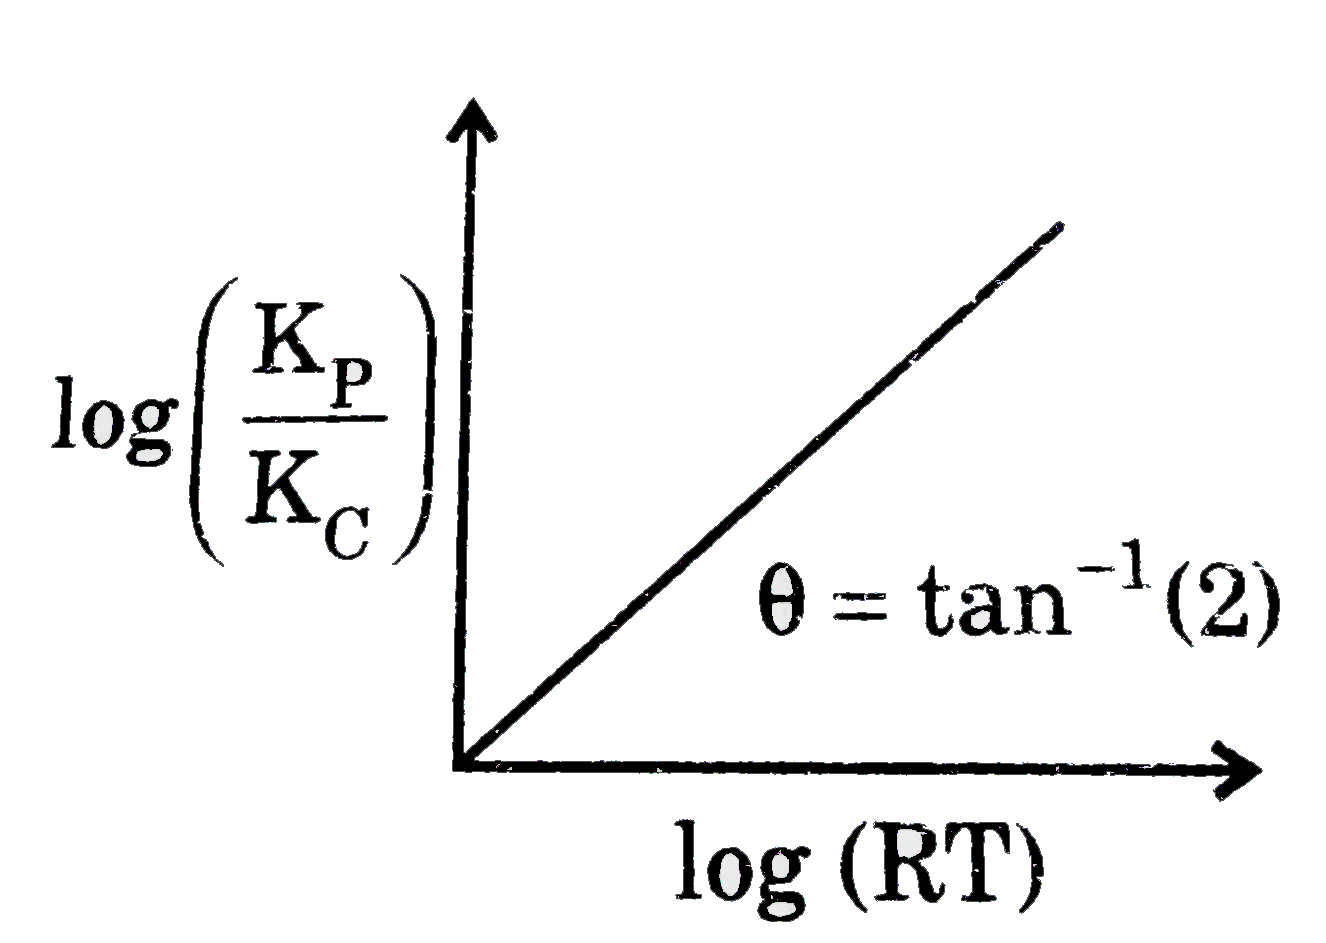
View SolutionGiven plot is valied, for which of the following reaction ?
View Solution
